 MetaTrader 5
 Experts
 Indicatori
 librerie
 Utilità
 Widget
 Regole
Guarda i video tutorial del Market su YouTube
Come acquistare un Robot di Trading o un indicatore
Esegui il tuo EA
hosting virtuale
hosting virtuale
Prova un indicatore/robot di trading prima di acquistarlo
Vuoi guadagnare nel Market?
Come presentare un prodotto per venderlo con successo
Indicatori tecnici per MetaTrader 5 - 88
 I segnali degli indicatori tecnici giocano un ruolo cruciale nell'apertura e nella chiusura delle transazioni sui mercati azionari e Forex. L'essenza degli indicatori è una trasformazione matematica del prezzo di un simbolo finanziario, finalizzata alla previsione dei cambiamenti futuri dei prezzi. Prova gli indicatori tecnici, per prevedere al meglio il comportamento del mercato e ricavarne dei guadagni.
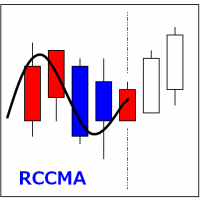
RCCMA is a general moving average indicator that works with ReviewCandleChart. Original is "Custom Moving Average" provided by MetaQuotes Software Corp. Based on that source code, I corresponded to ReviewCandleChart .
Advantages When ReviewCandleChart is ON, no line will be displayed on the right side from the vertical reference line. When ReviewCandleChart is ON and you press a key such as "Z" or "X" Following that, the MA is drawn. When ReviewCandleChart is OFF, the same drawing as the origin
FREE
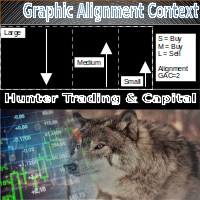
The Graphic Alignment Context (GAC) Technical Indicator measures the vertical difference of the simple average price of a financial instrument in the context of three different timeframes determined by a defined number of bars or candles (periods) to determine the strength of the buy or sell trend. sale. Ascending average prices indicate Buying strength (1), Descending average prices indicate Selling strength (-1) and any scenario different from the previous two conditions indicates Neutrality
FREE

OVERVIEW Sierra Capital Multi-Timeframe ATR puts the daily Average True Range (ATR) of the chart symbol into a compact panel on your chart. Several ATR periods sit side by side, together with today’s range so far, so you can see at a glance whether today is quiet or active compared with recent days. It is a display tool. It draws nothing on the price chart, gives no signals or alerts, and does not open or manage trades.
WHAT YOU SEE A small panel in a corner of the chart (top right by default)
FREE

Descrizione in Italiano Ghost Horizon è un indicatore trend-following professionale per MetaTrader 5, progettato per identificare istantaneamente le inversioni di tendenza e i punti di ingresso ottimali sul grafico attraverso un sistema avanzato di crossover. L'algoritmo analizza la dinamica del prezzo combinando una Media Mobile Veloce (identificazione del trend di breve periodo) e una Media Mobile Lenta (struttura del trend di medio periodo). Il software elimina completamente il rumore di
FREE
A buy signal can be seen on the dashboard when the previous signal is red and the next signal is green, then the SAR is green and the RSI is green.
A Sell Signal can be seen on the dashboard when the previous Signal is green and the Signal after it is red, then the SAR is red and the RSI is red.
Line function - shows on the chart the lines of Opening, Stop Loss, Take Profit. With this function, it is easy to create a new order and see its additional characteristics before opening. TP and SL
FREE
This is a Price Projection for Current Candle from Time Frame M15 To Weekly, It's shows Market Trends Teji (Bullish) Or Mandi (Berries). It's Show Teji High & Low for Bullish Market and Mandi High & Low for Berries Market. We can Plan Our Trade in Well Advance for our Current Open Trade. It's Generate New Data for Every New Candle. You are requested to Please Test it with demo Ac before Use in Real Trade. Please Save it to your Mql\Indicator folder and attache to your chart. if any quay Please
FREE

Produto Teste para testar chaves e validações. Ao instalar entre em contato. Mais informações entrar comunicação Instalando por favor revisar os testes querendo mais informações leia as instruções podendo estar errado entrar em contato Espero que este indicador auxilie nos trades dos usuários. O indicador será avaliado em outras metodologias para melhor atender
FREE

*Used by MeditionSeed EA. Meditation is a practice in which an individual uses a technique – such as mindfulness, or focusing the mind on a particular object, thought, or activity – to train attention and awareness, and achieve a mentally clear and emotionally calm and stable state.[1][2][3][4][web 1][web 2] Plant a Meditation Seed to have wonderful future.
FREE

*Used by MeditionSeed EA. Meditation is a practice in which an individual uses a technique – such as mindfulness, or focusing the mind on a particular object, thought, or activity – to train attention and awareness, and achieve a mentally clear and emotionally calm and stable state.[1][2][3][4][web 1][web 2] Plant a Meditation Seed to have wonderful future.
FREE

TBC...#property copyright "Phoenix Trading Copyright 2026, MetaQuotes Ltd." #property link " https://www.phoenixautrading.com/ " #property version "1.0"// Current version of the Expert Advisor #property icon "Phoenix.ico" #property description "At Phoenix Trading, we specialize in the engineering of high-precision MQL5 Expert Advisors," #property description "designed to transform market volatility into consistent opportunities. Our EAs are built for the modern trader, comb
FREE

HCS MarketWatch is a free, read-only MetaTrader 5 indicator that displays current spread, ATR, and spread relative to ATR in one compact chart panel.
The Spread/ATR ratio provides context for current spread relative to recent market movement.
The panel displays:
• Latest terminal Bid/Ask spread in points • MT5 ATR in points • Spread/ATR percentage • LEVEL: LOW, MEDIUM, or HIGH • Average spread during the current indicator run • Maximum spread during the current indicator run
The ATR timefra
FREE

Индикатор SpreadTimeInfo
Многофункциональный индикатор для отслеживания времени сессий, спреда и торговых инструментов.
Основные возможности Отображение времени до открытия/закрытия Американской сессии Таймер обратного отсчета до закрытия текущей свечи Мониторинг спреда с визуальным предупреждением Русскоязычные названия более 100 торговых инструментов Автоматический учёт выходных и праздничных дней
Настройки индикатора
### Американская сессия - Время открытия NY (в вашем времени)
FREE

Product Description: Adaptive Y-Axis Scaling is a powerful MT5 indicator designed to enhance your trading experience by providing precise control over the Y-axis (price) scaling of your charts. This innovative tool allows you to customize the price scaling by specifying the number of pips from the visible chart's highs and lows. The calculated price range from this input is then used to set the maximum and minimum prices for the open chart, ensuring an optimized and comprehensive view of market
FREE

Risk Guardian Lite - Institutional Risk Monitor MT5 Are you trading blind? Most traders fail because they don't know their real-time exposure. Risk Guardian Lite is a high-performance monitoring tool designed for institutional traders who demand precision without visual clutter. Why choose Risk Guardian Lite? Unlike generic monitors, this version focuses on the "Golden Triad" of profitability: Net Profit, Real Exposure, and Efficiency Ratio (R:R). Elite Features: ️ Capital at Risk Monito
FREE

MTF TradeDeck is an all-in-one trading dashboard for MetaTrader 5 that combines multi-timeframe visualization, line-cross alerts, a lot-size calculator, symbol switcher, and Forex session boxes in a single indicator. Key Features Multi-Timeframe Candles (up to 5 TFs): Compact higher-timeframe candles render to the right of the last price on the current chart. Each TF group is scaled to the visible price range to preserve proportions. Choose which TFs (M1 → MN1) and how many candles per group.
FREE
Это специальная утилита, для подключения внешнего индикатора к торговой панели . Она позволяет получать данные из буфера индикатора и рисует стрелочные объекты для передачи их в торговую панель. Входные параметры
Number of call buffer - номер индикатора для покупки Number of sell buffer -номер индикатора для продажи Indicator window - окно индикатора Indicator position in list - позиция индикатора в списке Default value of indicator - значения по умолчанию для индикатора Show information - показ
FREE

SPREAD TRAFFIC LIGHT — FREE ADAPTIVE SPREAD MONITOR FOR MT5
Turn raw spread data into a clear green, amber or red status before a manual entry.
MAIN FEATURES • Current spread in points • Rolling average and maximum spread • Current-to-average spread ratio • Adaptive green, amber and red classification • Configurable sample window and calibration samples • Optional absolute maximum-spread filter • Optional alert when status changes to red • Compact configurable panel for any MT5 symbol and time
FREE
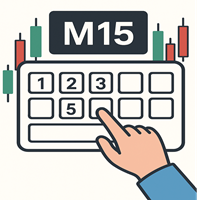
**Cambia Timeframe all'Istante con TimeView!**
L'indicatore TimeView per MetaTrader 5 ti permette di passare a qualsiasi timeframe con pochi tasti. Niente menu complicati, niente ricerche. Veloce, intuitivo ed efficiente!
**Caratteristiche Principali:** Scorciatoie da Tastiera: Attiva il pannello con i tasti numerici (1-6, 8) Personalizzabile: Regola colori, font e dimensioni del pannello Tutti i Timeframe: Supporta da M1 a MN1 Interazione Fluida: Conferma con Invio, annulla c
FREE

Full Description Overview Drawdown Controller Calculator Indicator is an advanced professional risk-management tool for MetaTrader 5 , specially designed for traders who use multiple running trades, pending orders, grid systems, and martingale strategies . This indicator allows you to see the future drawdown in advance — not only for currently running trades, but also for all pending orders combined , assuming they get triggered step by step. Instead of guessing or hoping, you will know ex
FREE
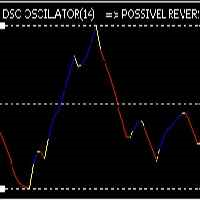
Recomended broker: https://tinyurl.com/5ftaha7c Indicator used to monitor price fluctuations in the market and discover possible reversals through reversal points or divergences in the indicator. All assets and all timeframes. SEE OUR RESULTS ON INSTAGRAM: https://www.instagram.com/diogo.cansi/ TELEGRAM GROUP = https://t.me/robosdsc More information by email dscinvestimentos@gmail.com or by Whatsapp 55-991372299
FREE

TPB – Comportamento dei Ritracciamenti di Tendenza Prezzo: $0 Piattaforma: MetaTrader 5 Tipo: Indicatore di condizione di mercato (non automatizzato) Panoramica Questo indicatore fa parte del GomerAI Market Research Framework, una raccolta di strumenti analitici progettati per studiare la struttura del mercato e gli ambienti di trading. Ogni indicatore si concentra su un aspetto specifico del comportamento del mercato per aiutare trader e sistemi automatizzati a comprendere meglio le condizioni
FREE

An improved version of the standard Standard Deviation indicator.
It is now a responsive and smoothed line.
The setup is not straightforward - but I hope you can do it.
It is very easy to understand the readings of this indicator, the meaning is the same as that of the usual Standard Deviation.
//////////////////////////////////////////////// ///////////////////////////////////
I hope this indicator will be very useful to you in successful trading.
Good luck.
FREE
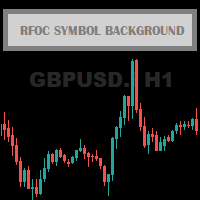
The RFOC Symbol Background was created to display the name of the asset and the current timeframe in the background of the chart.
Displaying the name of the asset at the bottom of the chart is often used by traders who are designing the screen for spectators, making it easier to identify the asset and the timeframe during a class, for example.
It is available for the user to select the font size (small, medium or large) and select the color for better viewing according to the background color
FREE

A simple indicator showing the size of the spread at the current time, the maximum for the day and the maximum for the entire duration of the indicator.
Daily statistics of the maximum spread are also displayed, indicating the time when this spread was fixed.
The location of the display of the received information can be changed depending on your preferences and positioned anywhere on the screen.
It is possible to output alerts about exceeding the size of the spread specified in the input pa
FREE

The RSI everyone uses. Finally READABLE.
RSI is one of the most famous indicators in the world... and one of the most misread. RSI Clarity Zones makes it crystal clear, with colored zones and a plain word.
️ WHAT YOU SEE • The RSI with its colored zones overbought / neutral / oversold • A label stating the state plainly: OVERBOUGHT, OVERSOLD or NEUTRAL • A flag when it crosses the 50 line (the momentum shift) ️
WHO IT'S FOR Beginners who want to understand RSI without memori
FREE
Мультивалютный индикатор в отдельном окне отображает движение валютных пар в пунктах с расхождением от начала дня. Во время работы, динамически возможно включать и отключать различные пары прямо на графике. При первом запуске, возможно, потребуется продолжительное время, пока загрузиться история для основных валютных пар. Расчет всех кроссов происходит на основе мажоров. Для валют CAD, CHF, JPY - график перевернут. При повторном открытии, все настройки индикатора восстанавливаются автоматически.
FREE
Мультивалютный индикатор в отдельном окне отображает движение валютных пар в пунктах с расхождением от начала дня. Во время работы, динамически возможно включать и отключать различные пары прямо на графике. При первом запуске, возможно, потребуется продолжительное время, пока загрузиться история для основных валютных пар. Для валют CAD, CHF, JPY - график перевернут.
При повторном открытии, все настройки индикатора восстанавливаются автоматически.
FREE
The Periodic ATR Indicator visually compares the ATR values of each bar to the average ATR values for the same time of day over previous days. By contrasting the current ATR value with the historical average, this tool allows traders to identify exceptionally strong or weak market movements. It also helps to contextualize each market movement within the broader framework of long-term market behavior. This versatile indicator is compatible with all timeframes, including higher ones such as 4-hou
FREE

``` Bneu GLA Trend Indicator — Grover Llorens Activator
This indicator for MetaTrader 5 displays a dynamic trend activation line based on the Grover Llorens Activator method. The line changes color based on price position relative to the activation level, with signal arrows appearing on trend changes.
What It Does
Plots a dynamic activation line on your chart: - Green line when price is above (bullish condition) - Red line when price is below (bearish condition) - Arrows appear on trend cha
FREE
Unlike many other indicators including the moving average indicator, Pivot Point can be a leading indicator. In these systems, the price levels of the previous period are used to determine the critical points instead of relying on the current price performance. Such an approach provides a clear framework for traders to plan their trades in the best possible way.
You can use this method and its combination with the methods you want to build and use a powerful trading setup. MT4 version
Let us kno
FREE
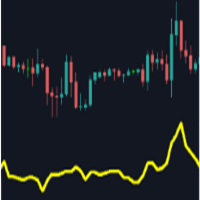
Main purpose: This indicator calculates the average of previous candles (a half of candle points). This value represent the strength of market (buy/sell) in each candle.
Parameters: . Period: indicating previous candles to calculate average . Shift: draw line at a shift on chart.
Tip: We can use this value to consider TP and SL of a position before opening.
FREE
The Visual Result Calculator Indicator is a powerful tool designed to enhance your trading experience on the MetaTrader platform. This intuitive and user-friendly indicator allows you to visualize potential profits or losses on a trading chart, helping you make better-informed decisions and manage your trades with precision. The Indicator displays a dynamic line on the trading chart, representing the potential profit or loss of a trade based on the start and end of the line. Simply click and
FREE

Dynamic Theoretical Stop
Histogram indicator that dynamically analyzes the theoretical Stop levels in real time.
Operation :
The DTS - Dynamic Theoretical Stop does a mapping of fractals in previous candles and suggests two levels of Stop: For purchase and for sale.
Suggested reading :
It is necessary to make the definition of Maximum Stop in points in the Trading Plan. In this way, the trader can decide the best entry point by analyzing the theoretical stop levels:
Stop for sales: Shown a
FREE

Nexora EA Monitoring System — Free Remote Position Monitor for MetaTrader 5 (VPS-Friendly) Nexora Monitor is a free, read-only MetaTrader 5 indicator that displays a live dashboard of your open positions — designed for traders who run an Expert Advisor on a VPS and want to check its status from a separate MT5 desktop terminal without remoting into the VPS itself.
Attach it to a chart on any MT5 desktop terminal (Windows or Mac) logged into the same trading account and it reconstructs a clear s
FREE
This indicator shows the value of returns in the selected time frame
They are calculated as logarithm of returns , rather than price or raw returns. For small returns, arithmetic and logarithmic returns will be similar. The benefit of using returns, versus prices, is normalization. It is possible measures all variables in a comparable metric despite originating from price series of unequal values
Inputs You can display data both as a Histogram or a Line It's also possible to display the a
FREE

ZumikoFX Trading Stats - Professional Account Dashboard Overview ZumikoFX Trading Stats is a comprehensive, real-time account monitoring dashboard designed for serious traders who need complete visibility of their trading performance. This indicator displays all crucial trading statistics in an elegant, easy-to-read panel positioned in the top-right corner of your chart. Key Features Complete Account Monitoring Balance & Equity - Real-time account status with current balance and equity includ
FREE
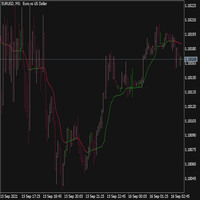
An Adaptive Moving Average (AMA) is one more moving average overlay, just like EMA. It changes its sensitivity to price fluctuations . The Adaptive Moving Average becomes more sensitive during periods when price is moving in a certain direction and becomes less sensitive to price movement when price is volatile. For more information, welcome to our Telegram Group. https://t.me/InfinXx
FREE

Indicator-forecaster. Very useful as an assistant, acts as a key point to forecast the future price movement. The forecast is made using the method of searching the most similar part in the history (pattern). The indicator is drawn as a line that shows the result of change of the close price of bars. The depth of history, the number of bars in the forecast, the patter size and the quality of search can be adjusted via the indicator settings.
Settings: PATTERN_Accuracy_ - quality of the search.
FREE

Simple Moving Average (SMA) Indicator The Simple Moving Average (SMA) is one of the most fundamental and widely used tools in technical analysis. It provides a clear visual representation of the market trend by smoothing out price fluctuations over a specified period. Unlike the Exponential Moving Average (EMA) , which reacts more quickly to recent price changes, the SMA gives equal weight to all price points in the calculation, making it ideal for identifying long-term trend direction and re
FREE
A professional-grade Bollinger Bands percentage analyzer.
Transform your trading strategies with the BBPCT Indicator, an advanced Bollinger Band Percentage indicator developed by iDevelop.expert. This tool is tailored to provide traders with a clear and actionable visualization of price movements relative to Bollinger Bands, along with insightful overbought and oversold signals.
Key Features: Dynamic Histogram Visualization: A dual-colored histogram for quick identification: Green bars indicat
FREE

Never Lose Your FundedNext Challenge Again UZFX FundedNext Guardian PRO is an advanced MT5 account monitoring indicator built exclusively for FundedNext traders . If you are Looking Best indicators in Mql5 Market. Check these out!
SSS Scalping Smart Signals MT5 Indicator
Scalping Winning Signals Pro SWS
LTL Long Trend Locator
It is a professional account monitoring and risk management dashboard specifically designed for FundedNext traders. This powerful dashboard continuously monitors your t
FREE
RSI magic kjuta trial is the demo version of RSI magic kjuta.
Custom Indicator (RSI magic kjuta) based on the standard (Relative Strength Index, RSI) with additional settings and functions. The maximum and minimum RSI lines on the chart have been added to the standard RSI line. Now you can visually observe the past highs and lows of RSI, and not only the values of the closing bars, which avoids confusion in the analysis of trades. For example, the EA opened or closed an order, but the RSI li
FREE
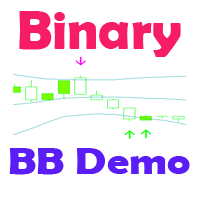
Стрелочный индикатор, выдающий сигнал при пересечении канала боллинждера. Сигналы выдаются в виде стрелок и подходят для торговли бинарными опционами.
Входные параметры Period of BB - период боллинджера Shift of BB - смещение боллинджера Deviation of BB - отклонение боллинджера Inform about finding the signal - параметр, отвечающий за получение уведомлений (Alert) о найденном сигнале. По умолчанию - да
FREE

LPE – Ambiente di Bassa Probabilità Prezzo: $0 Piattaforma: MetaTrader 5 Tipo: Indicatore di Condizione di Mercato Panoramica LPE (Low Probability Environment) è un indicatore progettato per identificare periodi in cui la struttura del mercato e il comportamento dei prezzi sono statisticamente sfavorevoli alle decisioni di trading ad alta probabilità. Non genera segnali di acquisto o vendita. Condizioni rilevate • Struttura di mercato poco chiara • Movimento di prezzo erratico • Compressione del
FREE

*Used by MeditionSeed EA. Meditation is a practice in which an individual uses a technique – such as mindfulness, or focusing the mind on a particular object, thought, or activity – to train attention and awareness, and achieve a mentally clear and emotionally calm and stable state.[1][2][3][4][web 1][web 2] Plant a Meditation Seed to have wonderful future.
FREE
RCH FX Spread + Bar Close Countdown Indicator
What This Indicator Does
A simple, professional tool that displays real-time spread information and bar closing countdown directly
on your MT5 charts.
Key Features
• Real-time spread display - Shows current spread in pips or points
• Bar close countdown timer - Exact seconds remaining until current bar closes
• Customizable alerts - Audio notification before bar closes
• Fully adjustable display - Position, colors, fonts, and sizing options
• Works o
FREE
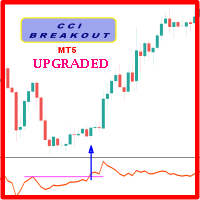
Probability emerges to record higher prices when CCi oscillator breaks out oscillator historical resistance level when exhibit overbought values. Since, oscillator breakout of support and resistance have similar effect as price breaks support and resistance levels, therefore, its highly advised to confirm price breakout with oscillator breakout; certainly, will have the same output in short trades. Concept is based on find swing levels which based on number of bars by each side of peak or troug
FREE

Канал фрактальной дивергенции базируется на паттернах фрактальной дивергенции , представляя их в виде канала, границы которого изменяются в момент появления очередного паттерна. Верхняя граница канала соответствует верхней части последнего найденного медвежьего паттерна фрактальной дивергенции. Нижняя граница канала - это нижняя часть последнего найденного бычьего паттерна (см. скриншот 1). По отношению к индикатору FractalDivergence_Patterns , канальная версия обладает теми же параметрами,
FREE

Main Features Calculates average values over a defined number of candles: Average volume Average close price Average candle range Average bullish and bearish candle size Displays current and previous candle statistics (Open, Close, Range, Volume). Provides an instant market summary without opening additional indicator windows. Works on any symbol and any timeframe . ️ Inputs BarsToCheck – number of candles to analyze. TextColor – color of the displayed text. FontSize – text size. (Demo only) D
FREE
The Market Thermometer can be used to help traders identify sleepy or turbulent periods.
It helps beginners to check when is the ideal time to enter operations, that is, when the value of the thermometer is below its average for several periods, identifying a peaceful market. When the market is heated, that is, the thermometer is above three times its average, it is time to make profits. The Thermometer measures the extent to which the end of a period, maximum or minimum price, projects outsid
FREE

【SecMode Series】SecModeCCI – High‑Resolution Tick‑Based CCI Indicator Overview SecModeCCI is part of the SecMode Series , a next‑generation suite of indicators designed to reveal the micro‑structure of price action at the tick/second level —a level of detail that traditional 1‑minute indicators cannot capture. While standard indicators refresh only once per minute, SecModeCCI uses a proprietary second‑level engine to: Update up to 60 times per minute (or at user‑defined intervals) Visuali
FREE

White Crow Indicator
by VArmadA A simple yet powerful candle analysis based indicator using the White Soldiers & Crow patterns.
Works with timeframes 1H and higher and tested on all major pairs. Pay attention to the signal: An arrow indicating a long or short entry.
How It Works:
Arrows indicate a ongoing trend. After multiple bullish or bearish candles in a row the chances for another candle towards that trend is higher.
Instructions: - Crow Count: Set the number of candles that need to su
FREE

Swap is the part of the cost that is easy to forget, because it arrives once a day, quietly, and never appears in the spread. Swap Cost Calendar puts it on the chart as a number you can act on. What It Shows The panel reads what the broker publishes for the current symbol and shows four things. The cost of one night for a long position and for a short one, in your account currency or in points. The weekday line, showing how many nightly charges a position carries on each day of the week. The tri
FREE

Crypto Position Size Calculator - a free position size calculator built for cryptocurrency traders. Enter your account balance, risk percentage, entry and stop-loss prices, and instantly get the exact position size for BTC, ETH and any other crypto symbol your broker offers. Crypto prices move fast and vary wildly between coins, so a fixed position size can mean wildly different risk from one trade to the next. This calculator measures the distance to your stop in the coin's own price and conver
FREE

Multi Spread Panel is a practical MetaTrader 5 indicator that displays the live spread of multiple symbols in one compact panel directly on the chart. It is designed for traders who want to monitor trading costs quickly and clearly without switching between multiple charts or Market Watch windows. You simply enter the symbols you want to track, and the indicator shows their current spread in a clean table format. The panel is especially useful for: spread monitoring before trade entry comparing
FREE

Volume Steps (Volume as OHLC candles) Volume Steps displays volume as candlestick-style OHLC bars in a separate subwindow. Each candle compares current volume to the previous bar, making volume shifts and step-changes easier to read than standard histograms. Key features: Volume shown as OHLC candles (open = previous volume, close = current volume) Selectable volume type : Tick Volume or Real Volume (if provided by the broker) Two color modes : Match price candle direction (bull/bear) Independen
FREE

The Luta Volatility Meter is an essential technical indicator for traders in MetaTrader 5 (MT5). It was developed by Eng. Lutandula to clearly measure and visualize market movement, helping you easily identify high and low volatility periods. By calculating the average daily trading range, this tool offers a simple yet powerful way to gauge market activity and potential movement for better trade timing Key Advantages Optimal Trade Timing: Helps you identify whether the market is slow (low vol
FREE
The Commitments of Traders Ratio Indicator is one of these things you never thought about it before you really see the magic behind it. The indicator shows the Ratio of long/short positions released by the CFTC once a week.
If you have a look on the Sreenshot you can see two (three) zones of interest. Important note: MAs are not available in version 1.0. Zone 1: The Switches (Red -> Green, Green -> Red) Zone 2: MA cross Zone 3: If you combine this with the COX indicator an additional zone will
FREE
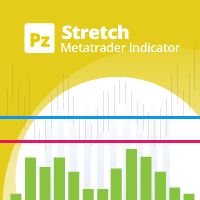
The Stretch is a Toby Crabel price pattern which represents the minimum average price movement/deviation from the open price during a period of time, and is used to calculate two breakout levels for every single trading day. It is calculated by taking the 10 period SMA of the absolute difference between the open and either the high or low, whichever difference is smaller. This value is used to calculate breakout thresholds for the current trading session, which are displayed in the indicator as
FREE
Custom ATR Indicator for Horizontal Levels Trading The Custom ATR Indicator is a powerful tool designed for traders who rely on horizontal levels and understand the importance of the Average True Range (ATR) in making informed trading decisions. This indicator calculates the ATR based on a customizable number of bars, filters out abnormal bars (too large or too small), and provides clear visualizations of key data, including ATR values, Stop Loss levels, and price movement percentages. Key F
FREE
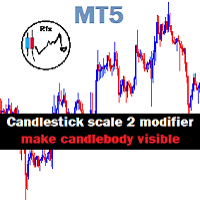
Chart Candlestick scale 2 zoom will visible instead of just a tiny unrecognized line make it look neat and tidy Instruction.
If you don't like the candles colors, you can do so by changing color. read below:
-Colors must be changed in the indicator setting.
-It won't change through the Chart properties to modify.
-After changing the color, save it as template so it wont change the colors to default value.
FREE

Standard PVSR is based on Pivot Points.
Steps to Setup the Indicator: Install the Custom Indicator; Set all the Lines Color, Width and Styles; Set visualization to All Timeframe; and DONE
It can be used for: All Pairs: Forex, Cryptocurrencies, Metals, Stocks, Indices etc. All Timeframe All Brokers All type of Trading Style like Scalping, Swing, Intraday, Short-Term, Long-Term etc. Multiple Chart
-->> For any Type of Support, Guidance, Setup Issue, EA Optimization, Input Setup etc. etc
FREE

Moving Spread – Monitor dei Costi di Mercato in Tempo Reale Monitora lo spread medio in tempo reale ed evita di operare durante periodi ad alto costo. Cosa fa questo indicatore Moving Spread misura lo spread medio (in punti) del mercato in tempo reale, mostrando come varia nel tempo. È uno strumento essenziale per i trader che vogliono capire quando il costo d'ingresso è troppo elevato, poiché può erodere i profitti anche prima che un'operazione abbia inizio. Perché è importante?
Uno spre
FREE

"️ Your opinion matters! Share your comments and product rating to help us improve and make it better for everyone. " " Your feedback counts! Leave a comment and rating to help enhance the product and meet your needs. " In trading, timing is not an advantage — it is everything . The difference between a winning trade and a losing one often comes down to seconds .
Candle Sentinel gives you total control over time by showing you exactly how much life is left in the current candle — in real
FREE
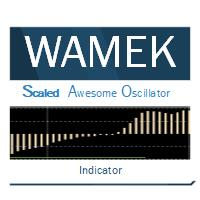
The Scaled Awesome Oscillator (SAO) represents a refined adaptation of the Awesome Oscillator, aimed at establishing consistent benchmarks for identifying market edges. Unlike the standard Awesome Oscillator, which records the variation in pips across different commodities, the only unchanging reference point is the zero line. This limitation hampers investors and traders from pinpointing specific levels for trend reversals or continuations using the traditional Awesome Indicator, a creation of
FREE
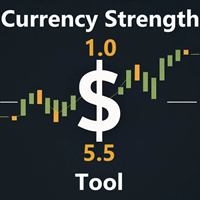
" Currency Strength Tool " is a straightforward and user-friendly indicator designed for analyzing the strength of eight major currencies based on daily price changes of currency pairs. It displays information compactly on the chart in three rows, providing traders with insights into current market dynamics. The indicator serves as an analytical tool, aiding in making informed trading decisions.
It appears as follows: -7.3% 0.5% 0.2% 6.4% 1.2% 3.2% 4.1% 0.4% (daily change) USD E
FREE

Based on two MA line indicators.
Looking at the histogram, if the value is greater than 0, the uptrend will increase, the bigger the value, the stronger the uptrend will be and vice versa, if the value is less than 0, the downtrend will decrease, the smaller the value, the stronger the downtrend . The necessary condition when entering a buy order is that the first histogram is greater than 0 and the current candle is closed, and enter the order when the second histogram appears. The necessary
FREE

HARRAZ HUD BASIC - Your Gateway to Neural Trading Welcome to the future of market analysis. Harraz HUD Basic offers a glimpse into our advanced Artificial Intelligence trading ecosystem, designed to give you a clean, modern, and highly responsive Heads-Up Display directly on your MetaTrader 5 charts. CORE FEATURES (BASIC EDITION): 1. Live Neural AI Typewriter (Jarvis Mode) Experience an animated, real-time Heads-Up Display that types out market sentiment. It reads the underlying momentum
FREE

Indigo Indicator by Quant Atlas Creator: https://www.quant-atlas.com/ Indigo Indicator is a clean reversal focused trading tool designed to identify potential turning points through a price sequence framework. The indicator studies how price has behaved across multiple prior reference points and highlights moments where that sequence may be shifting. When conditions align, it plots indigo triangle signals directly on the chart. Both bullish and bearish signals use the same indigo visual identit
FREE

LIMINAL CSM — Contrast State Modelling Indicator for MetaTrader 5 LIMINAL CSM is a regime-detection indicator that measures the contrast between currency states rather than raw momentum — quantifying the delta between strengthening and weakening pairs to produce a normalised score (0–100) that defines the current market regime before a move fully develops. At its core, CSM combines three proprietary sub-measurements: Variance-of-Variance (VoV) — how unstable volatility itself is; Momentum-Price
FREE
Scopri come acquistare un robot di trading dal MetaTrader Market, il negozio di applicazioni per la piattaforma MetaTrader.
Il sistema di pagamento di MQL5.community supporta le transazioni tramite PayPal, carte bancarie e gli altri sistemi di pagamento più diffusi. Per essere pienamente soddisfatto, ti consigliamo vivamente di testare il robot di trading prima di acquistarlo.

Ti stai perdendo delle opportunità di trading:
- App di trading gratuite
- Oltre 8.000 segnali per il copy trading
- Notizie economiche per esplorare i mercati finanziari
Registrazione
Accedi
Accetti la politica del sito e le condizioni d’uso
Se non hai un account, registrati