Market Structure Break Order Block
- Indicateurs
- Quang Huy Quach
- Version: 4.5
1. Description
The indicator is a technical analysis tool for the MetaTrader 5 platform. It is designed to automatically identify specific price movements and to highlight corresponding price zones based on preceding price action. This provides a visualization of key price areas according to the indicator's internal logic.
2. Visual Elements & Their Identification
The indicator identifies and draws several types of visual elements on the chart:
a. Structure Shift Line
This is a key event the indicator is programmed to detect.
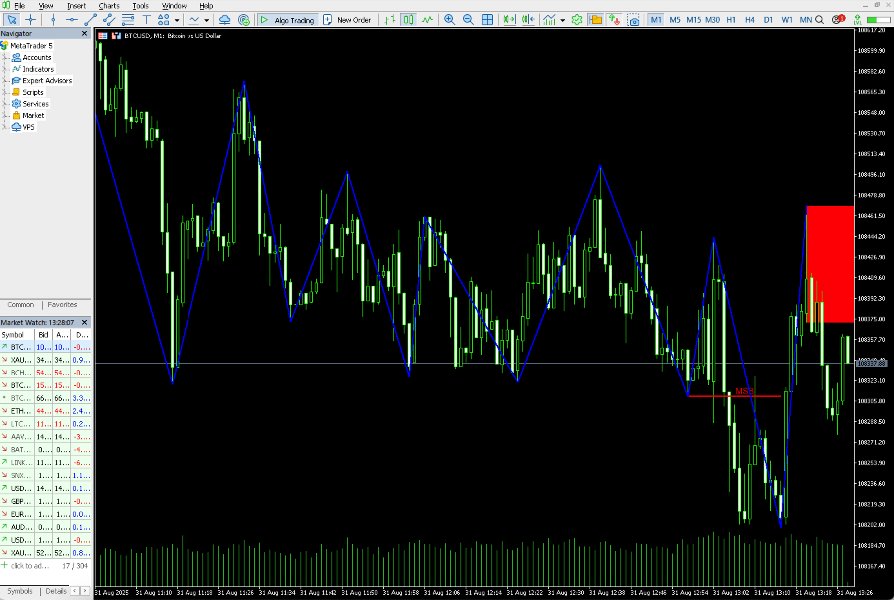
- Upward Shift Line (Blue): When the price closes above a recent high point identified by the indicator's algorithm.
- Downward Shift Line (Red): When the price closes below a recent low point identified by the indicator's algorithm.
On the chart, the indicator will draw a horizontal line (blue for upward, red for downward) with a label to mark this event.
b. Highlighted Price Zones
These are specific price zones identified by the indicator's algorithm following a Structure Shift Line event.
- Green Box: Identified as the last bearish candle before an upward price movement that resulted in an Upward Shift Line. The indicator draws this as a green box with a label.
- Red Box: Identified as the last bullish candle before a downward price movement that resulted in a Downward Shift Line. The indicator draws this as a red box with a label.
c. Other Highlighted Zones
These are variations of the Highlighted Price Zones that the indicator also identifies under specific conditions. The indicator will draw additional labeled boxes (e.g., "Other Green Box" or "Other Red Box") based on its internal calculations.
3. How the Indicator Functions
The indicator first identifies specific price movements (Structure Shift Lines). Following these movements, it then automatically draws the corresponding visual elements (Highlighted Price Zones and Other Highlighted Zones) on the chart.
- After an Upward Shift Line, the indicator will draw corresponding green boxes.
- After a Downward Shift Line, the indicator will draw corresponding red boxes.
These visual elements are intended to assist traders in their own analysis of market behavior. It is up to the individual trader to interpret these signals and decide how to use them in their personal trading strategy.
4. Input Parameters Explained
- Pivot Identification Settings:
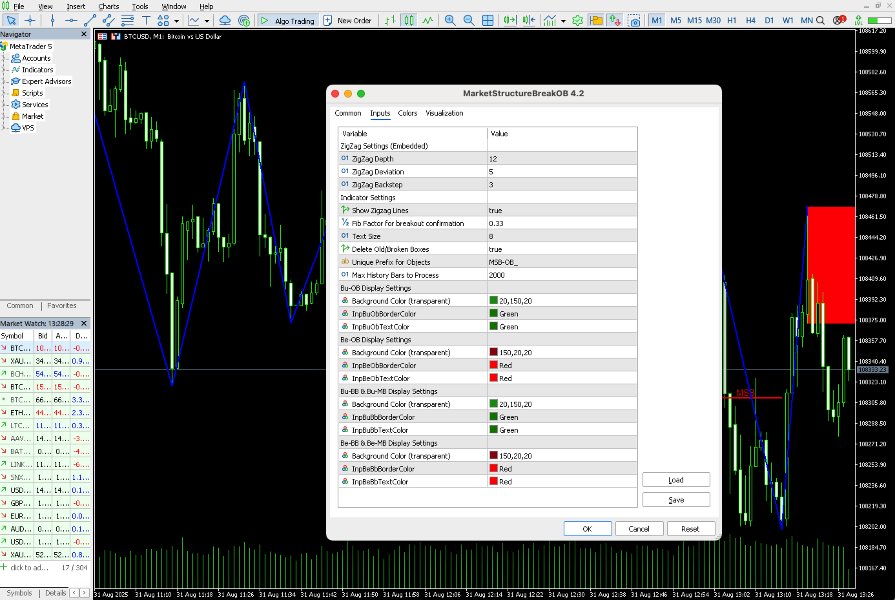
- InpZigZagDepth , InpZigZagDeviation , InpZigZagBackstep : Technical parameters for the algorithm used to identify pivot points. Modifying these will change the sensitivity of the pivot point identification. It is recommended to use the default values unless you are familiar with the algorithm's mechanics.
- Indicator Settings:
- InpShowZigzag : true to display the ZigZag lines on the chart, false to hide them.
- InpFibFactor : A factor used in the calculation to confirm a specific price movement. A smaller number makes the condition less strict, while a larger number makes it more strict. The default is 0.33 .
- InpDeleteBoxes : true to automatically delete boxes that have been invalidated by subsequent price action, false to keep them on the chart for historical analysis.
- Display Settings (Green Boxes, Red Boxes, Other Boxes):
- These parameters allow for the customization of the border color, background color, and text color for all types of boxes drawn by the indicator.
Disclaimer: Trading on financial markets involves significant risk. Technical indicators are analytical tools and should not be considered as a trading signal or a guarantee of profit. Past performance is not indicative of future results. Always use risk management and make your own informed decisions.
