Peak Trough Analysis Tool MT5
- Indicateurs
-
Young Ho Seo
 Harmonic Pattern Indicator - Repainting + Japanese Candlestick Pattern Scanner + Automatic Channel + Many more
https://www.mql5.com/en/market/product/4488 - Version: 1.5
- Mise à jour: 5 février 2020
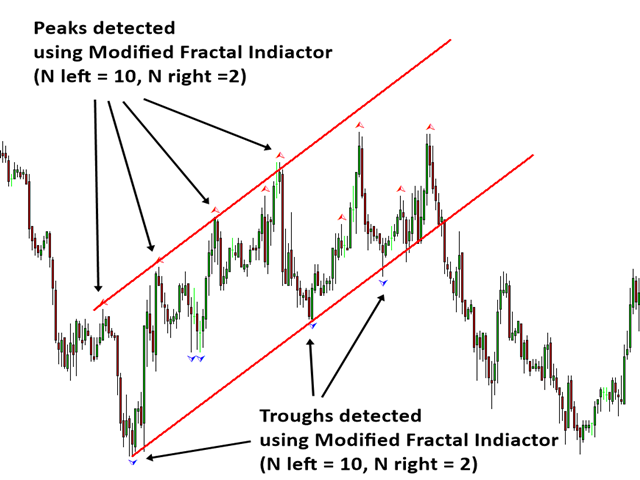
Peak Trough Analysis is the great tool to detect peaks and troughs in your chart. Peak Trough Analysis tool can use three different peaks and troughs detection algorithm. The three algorithm include the orignal Fractals Indicator by Bill Williams, the Modified Fractals indicator and ZigZag indicator. You can use this peak and trough analysis tool to detect the price pattern made up from Equilibrium Fractal-Wave process. For further usage, there are good guide line on how to use this peak trough analysis tool in the chapter 11 in the book: Introduction to Price Action and Pattern Trading. This is a free tool and you can use this powerful tool for your own benefit at your own risk.
How to use
You can use in three mode.
- Mode 1: The Fractals indicator by Bill Williams
- Mode 2: The Modified Fractals indicator
- Mode 3: Zig Zag indicator
To use Modified Fractals Indicator algorithm, set “Use Modified Fractals” = true.
To use for Zig Zag indicator algorithm, set “Modified Fractals” = false.
To use the original Fractals Indicator algorithm by Bill Williams, set “Use Modified Fractals” = true. Set N left = N right = 2.
Input Setting
1. Modified Fractals Setting
- N left - N = number of bars counting to left
- N right - N = number of bars counting to right
2. Zig Zag Setting
Use default setting unless you are familiar with ZigZag indicator.
- ZigZag Depth
- ZigZag Deviation
- ZigZag Backstep
3. General Setting
- Arrow Shift in Pixels - 10 = default
- Use White Background Chart - true or false only
- Enable sound alert - true or false only
- Send email if peak or trough is found - true or false only
- Send notification if peak or trough is found - true or false only
Trading Strategy Guide
Using Peak Trough Analysis is documented in the link below. It is highly recommended to read this article before trading.
https://www.mql5.com/en/blogs/post/750388
In addition, you can find the trading strategy guide from the links below:
Guide for Volume Spread Analysis: https://www.mql5.com/en/blogs/post/750390
Guide for Harmonic Pattern Detection Indicator: https://www.mql5.com/en/blogs/post/750344
Guide for Momentum Indicator: https://www.mql5.com/en/blogs/post/750346
Guide for Supply Demand Indicator: https://www.mql5.com/en/blogs/post/750386
Guide for Elliott Wave Indicator: https://www.mql5.com/en/blogs/post/750343
Guide for Volatility Indicator: https://www.mql5.com/en/blogs/post/750389
Important Note
This is the off the shelf product. Therefore, we do not accept any modification or customization request on this product. In addition, we do not provide any code library or any support for your coding for this product.

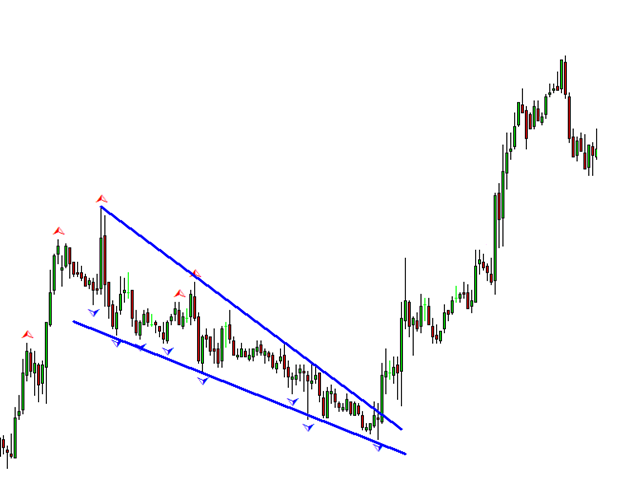
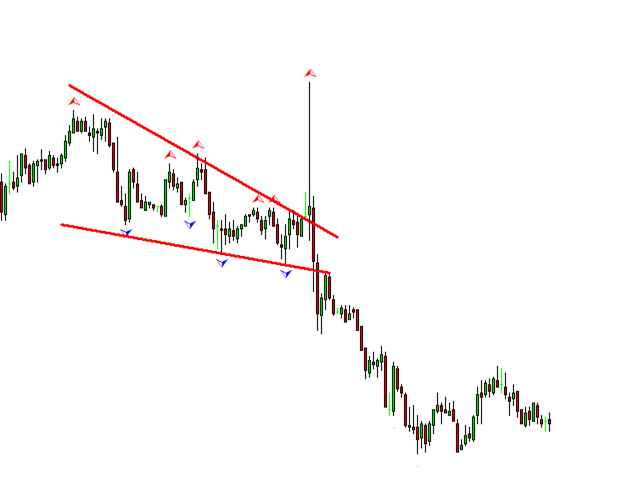


The indicator is one of those hidden gems that does exactly what it promises—identify turning points in the market with clarity and flexibility. I love that it offers three different detection modes, which gives you the freedom to adapt the tool to your own strategy and timeframe. Yes, it does repaint (like most tools of this nature), but that’s not a dealbreaker—you’re not meant to trade it blindly. Used smartly, especially alongside other confirmation tools, it becomes a powerful filter to spot potential reversals, swing highs/lows, or wave structure formations. Setup is super easy, and the visual arrows make chart analysis clean and intuitive. For a free indicator, the value is outstanding. And if you’re into fractal-wave or price action pattern trading, this tool makes life so much easier. Whether you're a beginner trying to understand market swings, or a more advanced trader looking to fine-tune entries and exits, this indicator deserves a place in your toolbox. Simple, smart, and highly practical.