 MetaTrader 5
 Experts
 Indicateurs
 Bibliothèque
 Utilitaires
 Widgets
 Règles
Regardez les tutoriels vidéo de Market sur YouTube
Comment acheter un robot de trading ou un indicateur
Exécutez votre EA sur
hébergement virtuel
hébergement virtuel
Test un indicateur/robot de trading avant d'acheter
Vous voulez gagner de l'argent sur Market ?
Comment présenter un produit pour qu'il se vende bien
Nouveaux indicateurs techniques pour MetaTrader 5 - 123
 Les signaux provenant des indicateurs techniques jouent un rôle crucial dans l'ouverture et la clôture des transactions sur les marchés boursiers et les marchés forex. L'essence des indicateurs est une transformation mathématique du prix d'un symbole financier visant à prévoir les changements de prix futurs. Testez les indicateurs techniques pour mieux prédire le comportement du marché et en tirer profit.

- وصف المنتج - مؤشر احترافي متكامل
لا يعد KING Fusion MACD-Vol من KING TRADING EA مجرد MACD آخر — فهو عبارة عن مجموعة أدوات تداول كاملة تجمع بين مؤشرات احترافية متعددة في نافذة فرعية واحدة أنيقة. لم تعد بحاجة إلى تحميل مخططك بأدوات منفصلة. يجمع هذا المؤشر بين:
MACD مع خطوط مزدوجة ورسم بياني مكبر
رسم بياني ملون ومثبت بالحجم
ملصقات ديناميكية مع قيم المؤشرات في الوقت الفعلي (ATR، ADX، RSI، Volume)
عداد تنازلي للبار
التنبيهات المتقاطعة (مرئية + صوتية)
كل ما تحتاجه من الوضوح والسرعة والدقة -
FREE
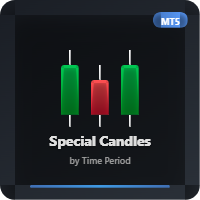
This indicator allows you to observe candle formation over a specific period, such as the Nasdaq, which starts at mid-hour. For example, for the first hour. The distance and size of the candle positioned on the right side can be adjusted. Color can also be assigned based on falling and rising candles. The needle can be made visible or invisible if desired. The body size can also be adjusted as desired.
FREE

Gold Scalper Pro PSAR ADX Dashboard MT5 Indicateur professionnel multi-unités de temps avec détection avancée des signaux de trading. Aperçu Le Parabolic SAR V3 + ADX est un indicateur d’analyse technique sophistiqué combinant la force suiveuse de tendance du Parabolic SAR avec la mesure de la puissance du mouvement fournie par l’ADX (Average Directional Index). Cette version améliorée inclut une optimisation spécifique par paire, un système d’alertes multilingue et un tableau de bord multi-time

MERAVITH est un indicateur de volume et de liquidité multi-unités de temps pour MetaTrader 5 qui montre la tendance, les zones de support et de résistance, l'entrée, les objectifs et le stop loss sur chaque unité de temps. Il vous donne une carte complète de la liquidité du marché, un outil de liquidité dans le style des hedge funds, et il fait tous les calculs automatiquement avec une méthode propre de prix moyen pondéré par le volume, donc il n'y a pas d'interprétation subjective. Fonctionne s

ARICoin is a powerful trading companion designed to generate high-probability entry signals with dynamic TP/SL/DP levels based on volatility. Built-in performance tracking shows win/loss stats, PP1/PP2 hits, and success rates all updated live. Key Features: Buy/Sell signals with adaptive volatility bands Real-time TP/SL/DP levels based on ATR Built-in MA Filter with optional ATR/StdDev volatility Performance stats panel (Success, Profit/Loss, PP1/PP2) Alerts via popup, sound, push, or email Cust
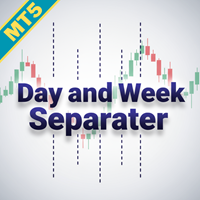
Optimisez votre analyse de trading avec le Day and Week Separator MT5, un outil intuitif conçu pour tracer des lignes de séparation journalières et hebdomadaires personnalisables, parfait pour les traders confrontés aux différences de fuseaux horaires des courtiers. Très apprécié dans les communautés de trading comme Forex Factory et Reddit’s r/Forex pour sa simplicité et son efficacité, cet indicateur répond au défi courant d’aligner les cadres temporels des graphiques avec les horaires locaux
FREE

Indicateur de réseau neuronal avec apprentissage intégré. Il s'agit d'un véritable système d'intelligence artificielle autonome, alimenté par un perceptron personnalisable à plusieurs niveaux et des paramètres d'entraînement avancés pour prédire les fluctuations de prix. Vous pouvez entraîner l'indicateur vous-même sur n'importe quel symbole financier ; aucune connaissance particulière en apprentissage automatique n'est requise. Tout ce dont vous avez besoin est collecté dans cet outil e

DD_Wallpaper – Arrière-plan personnalisé en plein écran et centré pour les graphiques MT5 Transformez vos graphiques MetaTrader 5 (MT5) en un espace de travail plus professionnel, personnalisé et inspirant avec DD_Wallpaper .
Cet indicateur unique vous permet d’ajouter des fonds d’écran ou images de fond en mode plein écran ou centré directement sur vos graphiques MT5. Idéal pour les traders souhaitant améliorer leur environnement de trading avec de la motivation, de l’esthétique ou du branding.

Lot Size Calculator – Calculateur de Taille de Lot Cet indicateur calcule la taille du lot en fonction du pourcentage de risque choisi et de la distance du stop loss. Il peut être utilisé sur le Forex, les métaux, les indices, les matières premières et les cryptomonnaies.
Principales fonctionnalités Calcul de la taille du lot selon le solde et le risque défini Modes ordre au marché et ordre en attente Lignes visuelles sur le graphique : entrée, stop loss et take profit Affichage du ratio risqu

Un indicateur de scalping professionnel multi-unité de temps avec alertes mobiles en temps réel, zones intelligentes d’achat/vente et statistiques quotidiennes de signaux. Conçu pour les day traders et scalpers exigeant précision et efficacité. Vue d’ensemble Cet indicateur a été conçu pour les day traders et scalpers qui recherchent précision, rapidité et clarté. Il combine l’analyse multi-unité de temps avec un filtrage intelligent des signaux afin de fournir des opportunités de trading à fort

Ultimate Professional Trading Analysis System A comprehensive multi-indicator trading system combining 25 professional-grade analysis tools in a single platform. This indicator integrates Smart Money Concepts (SMC) analysis with traditional technical indicators and advanced features for complete market analysis. Core Features: 10 Smart Money Concepts indicators including Order Blocks, Fair Value Gaps, Break of Structure, Liquidity Sweeps, Supply/Demand zones, Market Maker patterns, Premium/Disc
Get ALL my MT4 & MT5 indicators FREE — See how here
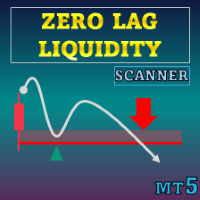
Offre spéciale : ALL TOOLS , seulement $35 chacun ! Les nouveaux outils seront à $30 pendant la première semaine ou pour les 3 premiers achats ! Chaîne Trading Tools sur MQL5 : Rejoignez ma chaîne MQL5 pour recevoir mes dernières actualités Zero Lag Liquidity trace des zones de liquidité à partir des profils de mèches sur des unités de temps inférieures et des mèches à fort volume. Pour chaque bougie anormale, l’indicateur cons
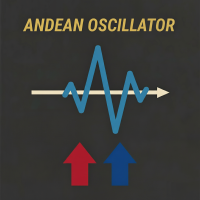
Andean Oscillator – Indicateur de Variations de Tendance Visualisez la force et la direction du marché avec clarté et précision. L' Andean Oscillator est un oscillateur avancé qui mesure les variations haussières et baissières de chaque actif à travers ses principales composantes : Bull (haussier) , Bear (baissier) et une Signal Line qui filtre les faux signaux et confirme les tendances. En utilisant des enveloppes exponentielles et des moyennes mobiles, l'Andean Oscillator offre une vision clai
FREE
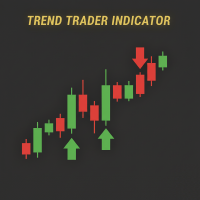
Trend Trader – Signaux d'Achat/Vente et Tendance Description :
Trend Trader combine l'analyse de tendance avec des signaux d'achat et de vente clairs, en utilisant les moyennes mobiles, le MACD et l'ADX pour évaluer la force du marché. Cet indicateur pour MetaTrader 5 montre la direction de la tendance, identifie les moments haussiers et baissiers, et met en évidence visuellement les croisements importants pour optimiser vos entrées et sorties de trading. Principales fonctionnalités Signaux d'a
FREE
Restez en avance sur l’élan du marché avec le Pip Movement Alert MT5, un indicateur polyvalent multi-devises conçu pour suivre et alerter les traders sur des mouvements précis en pips à travers plusieurs symboles, idéal pour le trading de forex, actions, cryptomonnaies et matières premières. Loué dans les communautés de trading telles que Forex Factory et Reddit’s r/Forex, et mis en avant dans les discussions sur Investopedia et TradingView pour sa capacité à détecter les changements soudains du
FREE

Ameers Gann Toolbox – By Ameer À propos de W.D. Gann W.D. Gann (1878–1955) fut l’un des traders les plus légendaires de l’histoire.
Il a développé une méthodologie unique basée sur la relation entre le prix et le temps, utilisant des angles, de la géométrie, des cycles et des proportions. Gann croyait que les marchés évoluent selon des schémas mathématiques prévisibles et que le temps est aussi important que le prix pour prévoir les mouvements futurs. Pourquoi cette boîte à outils est spéciale A

Value Gap est un outil intelligent basé sur la stratégie Fair Value Gap. Comment ça fonctionne :
L’indicateur analyse en continu l’action récente des prix, identifiant les zones où acheteurs et vendeurs ont laissé un déséquilibre. Lorsqu’un gap est détecté, il est marqué directement sur le graphique comme un niveau clair. L’outil surveille ensuite l’évolution future des prix : si le marché revient et comble le gap dans la fenêtre de temps autorisée, un signal est généré. Vous pouvez filtrer l
FREE
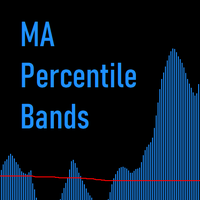
MA Percentile Bands Cet indicateur offre une approche nuancée et statistique pour analyser la relation entre deux moyennes mobiles. Au lieu de se concentrer uniquement sur les croisements, MA Percentile Bands mesure la distance entre une moyenne mobile rapide et une lente, puis la compare à son propre historique récent. Cela permet aux traders d'identifier lorsque la séparation entre les moyennes mobiles est statistiquement significative, offrant des perspectives uniques sur la dynamique du marc

Ce qu'il fait Traque les mêmes niveaux institutionnels clés qui bougent des milliards quotidiennement. Trois algorithmes propriétaires décodent la vraie structure de marché pour exposer les zones de kill à haute probabilité avant que les traders particuliers ne sachent ce qui les a frappés. Éléments visuels Histogramme vert : Pression d'achat institutionnelle détectée Histogramme rouge : Distribution smart money en cours Ligne de signal : Vert = volume haussier, Rouge = vendeurs engagés Paramètr

Améliorez votre précision de trading avec le Fibonacci Killer Alert MT5, un indicateur puissant qui exploite les niveaux de retracement Fibonacci pour fournir des signaux d’entrée précis sur les marchés forex, actions, cryptomonnaies et matières premières. Célébré dans les communautés de trading telles que Forex Factory et Reddit’s r/Forex, et salué dans les discussions sur Investopedia et TradingView pour sa précision dans l’identification des renversements et continuations de tendance, cet ind

FOTSI – Indice de Force Véritable du Forex Découvrez la véritable force de chaque devise et tradez avec avantage. L' indicateur FOTSI est un oscillateur multi-devises qui mesure le momentum réel de chaque devise principale (USD, EUR, GBP, JPY, CHF, AUD, CAD, NZD) à travers tous ses paires. Au lieu d’analyser un seul graphique, FOTSI combine les données de plusieurs paires, lisse les mouvements et applique l’algorithme True Strength Index (TSI) pour offrir une vision claire, stable et sans retard
Tableau de bord Multi-TF – Guide d'utilisation et avantages Nom de l’indicateur : Multi-TF Indicator Dashboard
Version : 1.10
Type : Tableau de bord multi-temporalités 1. Indicateurs inclus RSI (Indice de Force Relative) Mesure la force du prix Signaux : Surachat (>70), Survente (<30), Neutre MACD (Moyenne Mobile Convergence/Divergence) Analyse la direction de la tendance et les retournements potentiels Signaux : Haussier / Baissier Stochastique Détermine les conditions de surachat et de survent
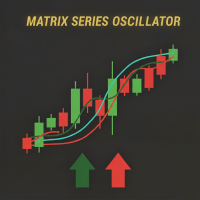
Matrix Series – Indicateur de Support, Résistance & Momentum Visualisez les zones clés de support/résistance, les niveaux de surachat/survente et la force du marché avec un seul indicateur. Le Matrix Series combine le CCI dynamique , des moyennes mobiles lissées et des bandes d'écart-type pour offrir une vue claire de la direction du marché et de ses niveaux critiques. Il colore les chandeliers selon la pression haussière ou baissière et affiche des zones de support/résistance dynamiques ainsi q
FREE

### Dominez les Marchés avec la Détection Professionnelle de Support et Résistance
**Enfin, un indicateur qui fait tout le travail difficile pour vous.**
Arrêtez de vous fatiguer les yeux en essayant d'identifier manuellement les niveaux de support et résistance sur les graphiques. Notre Indicateur SNR Automatique transforme votre trading en révélant instantanément les niveaux de prix critiques que surveillent les traders professionnels !
#### Pourquoi les Traders Passent à la Détection SNR

Voici la traduction complète en français de ta description MQL5, adaptée pour le marché et prête à publier : Buy n Sell Arrows with Trailing Stop – Traderlinkz Fichier de configuration disponible sur demande
Transformez le bruit du marché en signaux clairs d’achat et de vente.
Un outil professionnel pour MetaTrader 5 qui combine des signaux d’entrée précis avec un trailing stop dynamique. Les meilleurs résultats sont obtenus sur l’ unité de temps 5 minutes (M5) , ce qui le rend idéal pour le

The Volume Profile Fixed Range indicator is a powerful tool designed for MetaTrader 5 (MT5) platforms. It visualizes the distribution of trading volume over a fixed historical range of bars, helping traders identify key price levels where significant volume has accumulated. This aids in spotting support/resistance zones, value areas, and potential reversal or breakout points. Below is a detailed description of its features:
Key Features: - Fixed Range Analysis: Analyzes volume profile based on
FREE
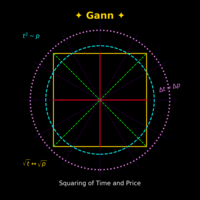
Gann Time–Price Square Cycles (MT5) This indicator applies the concept of time–price balance introduced by W.D. Gann.
It detects price swings on the chart and projects Quarter, Half, and Full cycle time intervals forward, marking them with vertical lines. The tool is designed to help traders study the relationship between swing size and elapsed time directly on MT5 charts. Functions Detects swing highs and lows based on pivot depth and minimum swing size. Projects Quarter, Half, and Full harmon

Automatisez la Géométrie Marché de Gann : L'Indicateur Ultime MT5 pour Prédire les Cycles de Prix et les Niveaux Clés. Arrêtez de deviner et commencez à savoir. fait les calculs complexes pour vous, transformant les théories profondes de W.D. Gann en signaux de trading clairs et actionnables sur votre graphique. Vous avez du mal à... Calculer manuellement les niveaux pivots de support et de résistance ? Identifier les zones de retournement à haute probabilité dans un marché chaotique ? Comprendr

The Breakout Finder (BF) is a powerful MetaTrader 5 indicator designed to detect potential breakout and breakdown opportunities in price action. By analyzing pivot highs and lows over a user-defined period, it identifies consolidation zones where price has repeatedly tested resistance or support levels within a narrow channel. When price breaks out of these zones with sufficient confirmation (based on the minimum number of tests and channel width threshold), the indicator visually highlights th
FREE

** All Symbols x All Time frames scan just by pressing scanner button ** After 19 years of experience in the markets and programming, Winner indicator is ready. I would like to share with you! - Real Price Is 200$. *** Contact me to send you " Trend Finder indicator " FREE 1, instruction and add you in "M1 Signal Scanner group" for sharing or seeing experiences with other users. ++ FREE 2 Trading Utility MT5 - New Update: 2026/9/10
Introduction: M1 Signal Scanner is the indicator

Vision 2.0— L’outil ultime pour trader en toute confiance Vision est un indicateur complet et intuitif qui combine précision, sécurité et simplicité.
Il a été conçu pour les traders qui veulent :
Identifier rapidement les opportunités les plus claires
Protéger leur capital avec une gestion intégrée du risque
Trader en toute confiance grâce à une interface épurée Ce que Vision vous apporte Signaux clairs et sans ambiguïté Flèches visibles directement sur le graphique Entrées et so

Bullhouse MarketProfile Description
The MarketProfile indicator collects and distributes traded volume at different price levels, creating a horizontal histogram that highlights areas of institutional interest. How it helps in trading
It helps traders identify strong support and resistance zones, balance areas, and points of control (POC), offering insights into where the market participants are most active. ️ How to use
Set the desired range of candles or session. The indicator will

Indicador que mostra níveis de variação do preço do ativo durante o dia. Possui alguns parâmetros para ajuste de cores e quantidade de níveis. Excelente como indicativo e utilização com outros indicadores para confirmar entradas e saídas.
Indicador que muestra niveles de variación del precio del activo durante el día. Posee algunos parámetros para el ajuste de colores y cantidad de niveles. Excelente como indicativo y para su uso con otros indicadores para confirmar entradas y salidas.
Indicat

Trend Catcher – Multi-Timeframe MT5 Trend Filter with Mobile Alerts Trend Catcher is a lightweight, multi-timeframe trend detection indicator for MetaTrader 5. It helps traders synchronize signals across different timeframes, filter noise, and stay aligned with momentum for more structured entries. Designed with fast execution and mobile compatibility, this tool adapts to scalpers, day traders, and swing traders who need clarity in rapidly changing markets. Key Features 1. Multi-Timeframe Trend

The Breakout Finder (BF) is a technical analysis indicator designed for MetaTrader 5 (MT5) platforms. It identifies potential breakout and breakdown patterns in price action by analyzing pivot highs and lows over a specified period. The indicator detects "cup" formations—clusters of pivot points within a narrow price channel—indicating areas of consolidation that may lead to strong directional moves when broken. EA: BlackHole Breakout EA https://www.mql5.com/en/market/product/149206
Key Featur
FREE

Smart Money Breakout Channels Indicator
The Smart Money Breakout Channels indicator is a powerful technical analysis tool designed to identify potential breakout opportunities in financial markets by detecting consolidation channels based on price volatility. Built for MetaTrader 5 (MT5), it overlays dynamic channels on the price chart, highlighting areas of low volatility that often precede significant price movements. This indicator is inspired by smart money concepts, focusing on institution
FREE

### Best Order Block Detector Indicator for MT5
The Order Block Detector is a technical analysis indicator designed for MetaTrader 5 (MT5). It identifies potential order blocks (OBs) in the market, which are key price levels where significant buying or selling activity has occurred, often acting as support or resistance zones. These blocks are detected based on volume pivots and market structure swings, helping traders spot areas of institutional interest for potential reversals or continuation
FREE

Basic Smart Breaker Block Zones SMC Indicator
Introduction: Breaker blocks are order blocks that have been broken once by the market . When the price returns to these zones, they often trigger a strong reaction . In technical terms, resistance blocks become support zones after a breakout, and support blocks turn into resistance zones once broken. Understanding breaker blocks is extremely valuable for identifying high-probability trading opportunities , including both

The "Support Resistance Dynamic" indicator is a powerful technical analysis tool for the MetaTrader 5 platform, designed to automatically identify and plot dynamic Support and Resistance zones on price charts. This indicator helps traders easily recognize important price levels, potential reversal points, or breakout areas, thereby enabling more informed trading decisions. 2. Key Features Dynamic S/R Identification : Automatically identifies support and resistance zones based on an advanced Pivo
FREE

"This indicator was designed so that you don't trade against the trend, the price strength helps you have more confidence in your entries. Note: The indicator can be used on any currency pairs, don't worry if you don't have all the indicators it uses installed, it will be calculated from the indicators you already have on the platform.With an interface that changes color for buy (blue), sell (red), and neutral
FREE

Indicator Guide: Key Price Levels & Structure Shifts 1. Description The indicator is a technical analysis tool for the MetaTrader 5 platform. It is designed to automatically identify specific price movements and to highlight corresponding price zones based on preceding price action. This provides a visualization of key price areas according to the indicator's internal logic. 2. Visual Elements & Their Identification The indicator identifies and draws several types of visual elements on the chart
FREE

My Fibonacci MT5 An automated Fibonacci indicator for MetaTrader 5 that combines ZigZag swing detection with comprehensive Expert Advisor integration through a 20-buffer system. More details about data specification and EA integration: https://www.mql5.com/en/blogs/post/764114 Core Features Automated Fibonacci Detection The indicator identifies swing points using configurable ZigZag parameters and draws Fibonacci retracements and extensions automatically. It updates levels as new swing formatio
FREE

TendencyView est un indicateur/expert MQL5 destiné à afficher et analyser la tendance d’un actif financier (le symbol courant) sur plusieurs unités de temps en parallèle : H1, H4 et D1. Il calcule des moyennes mobiles rapides et lentes pour chaque timeframe, compare leurs croisements, et en déduit une tendance : TREND_UP (hausse) -> MA rapide > MA lente TREND_DOWN (baisse) -> MA rapide < MA lente TREND_SIDEWAYS (latéral) -> pas de consensus clair Sur le graphique, quelque soit la période, Il vo

Anchored VWAP Indicator Track the true market consensus price from any point on the chart.
This Anchored VWAP (Volume Weighted Average Price) indicator allows you to anchor the calculation to any candle — highs, lows, breakouts, or key events — offering precise control to identify institutional interest levels. Follow buyer or seller pressure in real-time Add multiple anchors to track various key points of interest simultaneously Ideal for professional and institutional-level analysis

Order Book Tilt with Volume Activity Meter Real-Time DOM Tilt • Session Bias • Volume Momentum Overview
Elevate your order-flow analysis with this clean, lightweight MT5 indicator—designed for traders who value clarity and context: Order Book Tilt (live): Real-time imbalance between sellers and buyers (Depth of Market), smoothed via EMA for actionable clarity. Session Tilt (running average): Tracks the cumulative bias of the current session—ideal for confirming trend setup vs noise. Volume Acti

PriceActionToolKit - Professional ICT & Smart Money Concepts Indicator Transform Your Trading with Institutional-Grade Analysis PriceActionToolKit is a comprehensive indicator that brings the power of Inner Circle Trader (ICT) methodology and Smart Money Concepts directly to your MetaTrader 5 platform. This all-in-one solution eliminates the guesswork from your trading decisions by automatically identifying the key market structures that institutional traders use to move the markets. Why This

Apex Swing VWAP is an advanced indicator for MetaTrader 5 that combines VWAP (Volume Weighted Average Price) analysis with automatic detection of significant swing points. This combination provides accurate market sentiment insight and potential reversal points. Key Features Integrated Technical Analysis - Dynamic VWAP from relevant swing points - Historical VWAP for long-term trend analysis - Multiple configurable VWAP periods
Recommended Trading Types - Swing Trading for medium-term trends -
FREE

1. Overview The Scalping PullBack Signal indicator is a powerful technical analysis tool designed to help traders identify scalping opportunities based on potential pullback and reversal signals. This tool is particularly useful on lower timeframes (below 15 minutes) but can also be applied on higher timeframes for longer-term trades. This indicator integrates several key analytical components, providing a comprehensive view of trends and potential entry/exit points, helping you make quick and e
FREE

Description of the Harmonic Patterns + Fib Indicator
The Harmonic Patterns + Fib indicator is a technical analysis tool designed for MetaTrader 5 (MT5). It automatically detects and visualizes harmonic price patterns on financial charts, leveraging Fibonacci ratios to identify potential reversal points in markets such as forex, stocks, cryptocurrencies, and commodities. The indicator scans for classic harmonic formations like Butterfly, Bat, Crab, Shark, Gartley, and ABCD, drawing them with lin
FREE
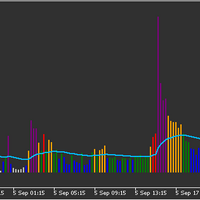
Volume indicator judging level of volume per bar accordingly to Volume Spread Analysis rules. It allows either to set static volume levels or dynamic ones based on ratio comparable to Moving Average. Bars are coloured based on ratio or static levels, visually presenting level of Volume (low, average, high, ultra high). Release Notes - Fixed and optimised calculations of Session Average Volume
- added predefined settings for time to calculate Session Average for EU and US markets
V5*: in.tradin
FREE

Introduction The Parabolic SAR (Stop and Reverse) indicator is a technical analysis tool designed to identify potential trend reversals and provide trailing stop-loss levels. This enhanced version of the standard Parabolic SAR for MetaTrader 5 offers improved visual clarity, customizable alerts, and an optional trend confirmation filter to assist traders in their analysis. Features Enhanced Visualization: Displays Parabolic SAR dots in two distinct colors (Lime for uptrends, Red for downtrends)
FREE
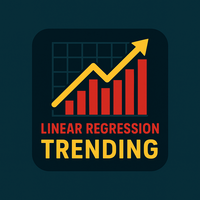
Linear Regression Trending indicator analyzes price trends by plotting a linear regression channel based on user-defined parameters such as source (for example, close prices), channel length, and deviation multiplier.
How It Works: - The indicator calculates a linear regression line over the specified length, forming a channel with upper and lower boundaries offset by the deviation value. - It detects price breaks from the channel and optionally displays broken channel lines (in a customizable
FREE
Reverse RSI Signals Indicator
The Reverse RSI Signals indicator is a versatile technical analysis tool designed for MetaTrader 5 (MT5). It transforms traditional RSI calculations into dynamic price-based bands, integrates Supertrend for trend identification, and includes divergence detection for potential reversal signals. This overlay indicator provides visual and alert-based insights to help traders spot overbought/oversold conditions, trend shifts, and momentum divergences directly on the p
FREE
The Moving Average Ribbon is a technical indicator that overlays a series of moving averages (MAs) on a price chart to visualize trend direction, strength, and potential reversals or reentries. It supports both Exponential Moving Averages (EMA) and Simple Moving Averages (SMA), configurable via user input.
Key Features:
Ribbon Composition: Displays 18 moving averages with periods ranging from 5 to 90 in increments of 5 (e.g., MA5, MA10, ..., MA90), plus an internal MA100 for reference. The MA5
FREE

Trade Filter is a tool designed primarily for traders using many Expert Advisors on the same currency pair and/or grid systems creating many simultaneous trading operations. By adding the filter (as an indicator) to a given chart, must select a magic number of the EA and only its trades remain visible. Numerous settings for colors, line styles, font sizes and others have been added, through which you can adjust the display according to your preferences. Set files also can be created and loaded.

Harness the Force of Market Momentum Stop chasing false breakouts. Trend Force identifies high-probability trend continuations with surgical precision, giving you the edge professional traders demand. Get accurate In/Out signals with smart dynamic stop loss, stop guessing and get results NOW! Why Traders Choose Trend Force Smart Breakout Detection Advanced volatility-adjusted algorithm catches real moves Filters out market noise and false signals automatically Dynamic adaptation to chan
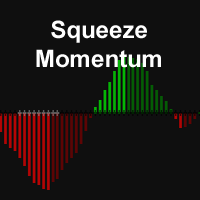
The Squeeze Momentum Indicator, identifies periods of low volatility ("squeeze") when Bollinger Bands are inside the Keltner Channel, marked by black crosses on the midline. This suggests the market is preparing for a significant move.
Gray crosses indicate a "squeeze release," signaling potential breakout. To use it, wait for the first gray cross after a black cross, then enter a trade in the direction of momentum (long if above zero, short if below). Exit when momentum shifts (color change i
FREE

1. Overview The Ichimoku Kinko Hyo (or Ichimoku Cloud) is a comprehensive, all-in-one technical analysis indicator designed to provide a deep understanding of market trends, momentum, and dynamic support and resistance levels. This indicator provides a clean, standard implementation of the five core Ichimoku lines. Its key feature is a non-intrusive Status Dashboard that gives you an at-a-glance summary of the current market situation according to the Ichimoku system, allowing for quick and effi
FREE
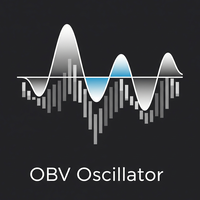
Overview The OBV Oscillator is a custom technical indicator for MetaTrader 5, designed to provide a clearer visualization of On Balance Volume (OBV) by transforming it into an oscillator. This indicator aims to assist traders in identifying trend confirmations, potential reversals, and momentum shifts by analyzing the relationship between price and volume. It features a customizable Moving Average (MA) for smoothing the OBV, a signal line for generating crossover signals, and an alert system to
FREE

1. Overview Thank you for choosing the Trend Maximizer. This tool is designed for technical analysis within the MetaTrader 5 platform. It is a sophisticated trend-following indicator that helps traders identify the prevailing market trend and can also function as a dynamic, trailing stop-loss level. The core of the indicator is based on a combination of a user-selected Moving Average (MA) and the Average True Range (ATR) indicator. By analyzing the relationship between the MA and the calculated
FREE

1. Overview The ATR Dynamic Stop (CE) is a powerful technical indicator designed to help traders identify and follow market trends. Its core function is to provide a dynamic trailing stop-loss based on price volatility, as measured by the Average True Range (ATR) indicator. The main objectives of the ATR Dynamic Stop are: Profit Optimization: It helps you ride a strong trend by setting a reasonable stop-loss, preventing premature exits due to minor market noise and fluctuations. Risk Management:
FREE

Overview EMA Scalper is a technical indicator designed for the MetaTrader 5 platform. This tool helps traders identify potential trading signals based on the crossover between price and an Exponential Moving Average (EMA), combined with a dynamic price channel. The indicator is suitable for scalpers or day traders and works across various timeframes and financial instruments. How It Works The indicator's logic is based on two main components: EMA Crossover: The core signal is generated when the
FREE

1. Introduction The CM_Ultimate_RSI_MTF is a powerful and versatile custom indicator for MetaTrader 5, designed to enhance your Relative Strength Index (RSI) analysis. It provides multi-timeframe (MTF) capabilities, visual signals, and customizable alerts, making it an invaluable tool for traders seeking to identify overbought/oversold conditions, trend strength, and potential entry/exit points across various timeframes. 2. Key Features Multi-Timeframe (MTF) Analysis: Allows you to view RSI from
FREE

Simple Moving Averages Indicator for MetaTrader 5 Overview The Simple Moving Averages (SMA) indicator for MetaTrader 5 is a versatile analytical tool designed to help traders visualize price trends and potential support/resistance levels. It calculates and displays up to ten (10) customizable Simple Moving Averages directly on your chart, providing a comprehensive view of various trend durations. Key Features Multiple SMAs: Plot up to 10 independent Simple Moving Averages simultaneously. Customi
FREE
Range Identifier v3 User Guide 1. Overview The Range Identifier v3 is a technical analysis tool designed to automatically detect and visualize periods of market consolidation, commonly known as ranges. this MQL5 version brings the same powerful logic to the MetaTrader 5 platform. The primary function of this indicator is to draw a channel around recent highs and lows during periods of low volatility. When the price breaks out of this channel, the indicator provides an alert, helping traders iden
FREE

Fibonacci Bollinger Bands (FBB) Indicator - User Manual 1. Introduction Fibonacci Bollinger Bands (FBB) is a technical analysis indicator that combines three tools: Bollinger Bands , Fibonacci Ratios , and the Volume-Weighted Moving Average (VWMA) . The purpose of this indicator is to provide a multi-dimensional view of the market by helping to identify: Dynamic support and resistance zones. The general market trend. Volatility levels and potential accumulation phases (squeezes). Price breakouts
FREE
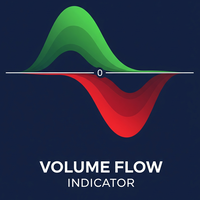
Volume Flow Indicator (VFI) - User Manual 1. General Introduction The Volume Flow Indicator (VFI) is an advanced technical oscillator designed to measure the strength and sustainability of a price trend by incorporating both price and volume data. Developed based on the concepts of On-Balance Volume (OBV) but with significant improvements, the VFI provides deeper insight into money flow and the conviction behind price movements. This indicator is not an automated trading system but a powerful an
FREE
Linear Regression Channel (LRC) Indicator – Overview The Linear Regression Channel (LRC) indicator is a professional tool designed to display dynamic price channels around a regression trendline. It automatically adapts to market conditions, helping traders visualize price movement with clarity. Main Features : Regression-based central line with upper/lower channel boundaries. Fully customizable colors, styles, and levels. Optional labels and forward extensions for better chart visualizati
FREE

1. Overview The Turtle Trade Channels is a comprehensive technical analysis tool for MetaTrader 5, based on the core principles of the classic Turtle Trading system. This indicator is designed to help traders identify significant price movements by plotting dynamic price channels that highlight potential channel breakouts and reversals. The methodology is based on channel breakouts: An upward channel breakout is indicated when the price breaks above the upper channel. A downward channel breakout
FREE
1. Introduction The Squeeze Momentum Plus is a powerful technical analysis tool designed to help traders identify periods of low market volatility (the "squeeze" phase) and assess the direction and strength of price momentum . This indicator combines the principles of Bollinger Bands and Keltner Channels to detect changes in market volatility, along with a momentum oscillator to measure buying/selling pressure. 2. Key Components of the Indicator The Squeeze Momentum Plus is displayed in a separa
FREE
Le MetaTrader Market est le meilleur endroit pour vendre des robots de trading et des indicateurs techniques.
Il vous suffit de développer une application pour la plateforme MetaTrader avec un design attrayant et une bonne description. Nous vous expliquerons comment publier votre produit sur Market pour le proposer à des millions d'utilisateurs de MetaTrader.

Vous manquez des opportunités de trading :
- Applications de trading gratuites
- Plus de 8 000 signaux à copier
- Actualités économiques pour explorer les marchés financiers
Inscription
Se connecter
Vous acceptez la politique du site Web et les conditions d'utilisation
Si vous n'avez pas de compte, veuillez vous inscrire