Best Reverse RSI Signals
- Indicateurs
- Manh Toan Do
- Version: 1.0
Reverse RSI Signals Indicator
The Reverse RSI Signals indicator is a versatile technical analysis tool designed for MetaTrader 5 (MT5). It transforms traditional RSI calculations into dynamic price-based bands, integrates Supertrend for trend identification, and includes divergence detection for potential reversal signals. This overlay indicator provides visual and alert-based insights to help traders spot overbought/oversold conditions, trend shifts, and momentum divergences directly on the price chart.
Key Features:
1. Reverse RSI Bands:
- Calculates price levels corresponding to fixed RSI thresholds: Upper band (RSI=70, overbought), Midline (RSI=50, neutral), and Lower band (RSI=30, oversold).
- Uses an inverted RSI formula to project these levels onto the price chart, allowing traders to see at what price RSI would hit these thresholds.
- Optional smoothing with EMA (length 14) to reduce noise and provide cleaner signals.
- Outer bands extend the inner bands by a factor of 0.25 relative to the midline distance, creating a channel for volatility assessment.
2. Supertrend Integration:
- Applies Supertrend to the RSI midline using ATR (length customizable, default 15) and a factor (default 0.4).
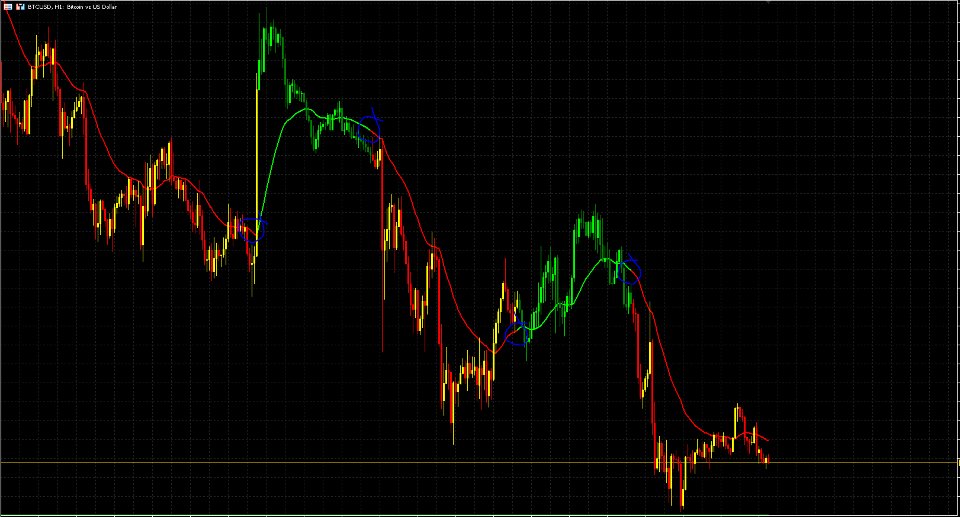
- Determines overall trend direction: Bullish (green midline) or Bearish (red midline).
- Detects trend shifts and triggers alerts when the Supertrend direction changes.
3. Divergence Detection:
- Computes standard RSI (length 14) and identifies regular bullish/bearish divergences.
- Uses pivot lookback (left: customizable, default 5; right: 1) and a confirmation range (5-60 bars).
- Alerts for divergences without plotting arrows on the chart for a cleaner view.
4. Gradient Band Fills:
- Dynamic gradient fills between outer and inner bands with variable transparency (alpha) based on price proximity to the bands.
- Proximity is smoothed using WMA (length 14), creating a visual heat map: Red gradients for upper (bearish) and green for lower (bullish) bands.
- Fades towards the chart background for intuitive overextension signals.
5. Custom Candlestick Coloring:
- Overlays colored candlesticks on the price chart.
- Colors adapt to Supertrend direction: Lime/green for bullish trends, yellow/red for bearish.
- Differentiates between up/down candles within the trend for quick momentum assessment.
6. Alerts and Notifications:
- Configurable alerts for:
- Regular bullish/bearish divergences.
- Bullish/bearish trend shifts via Supertrend.
- Price entering the upper or lower bands (crossover events).
- Alerts are triggered only on the current bar to avoid historical noise.
Customization Options:
- RSI Settings: Length (default 14), divergence lookback (default 5), and band smoothing toggle.
- Supertrend Parameters: ATR length (default 15) and factor (default 0.4).
- Appearance: Customizable bullish (default lime) and bearish (default red) colors.
This indicator is ideal for trend-following and reversal strategies, particularly in volatile markets like forex, stocks, or cryptocurrencies. It emphasizes visual clarity with dynamic elements while providing actionable alerts. For optimal use, combine with other confirmation tools and adjust parameters based on the asset's volatility.
