Volume Flow Index Indicator
- Indicateurs
- Quang Huy Quach
- Version: 3.11
1. General Introduction
The Volume Flow Indicator (VFI) is an advanced technical oscillator designed to measure the strength and sustainability of a price trend by incorporating both price and volume data. Developed based on the concepts of On-Balance Volume (OBV) but with significant improvements, the VFI provides deeper insight into money flow and the conviction behind price movements.
This indicator is not an automated trading system but a powerful analysis tool. It helps traders assess market momentum and identify potential trading signals based on the interaction between price and volume.
This version is specifically designed to work effectively in markets where real volume data is unavailable (such as Forex and CFDs) by using Tick Volume.
2. Indicator Components
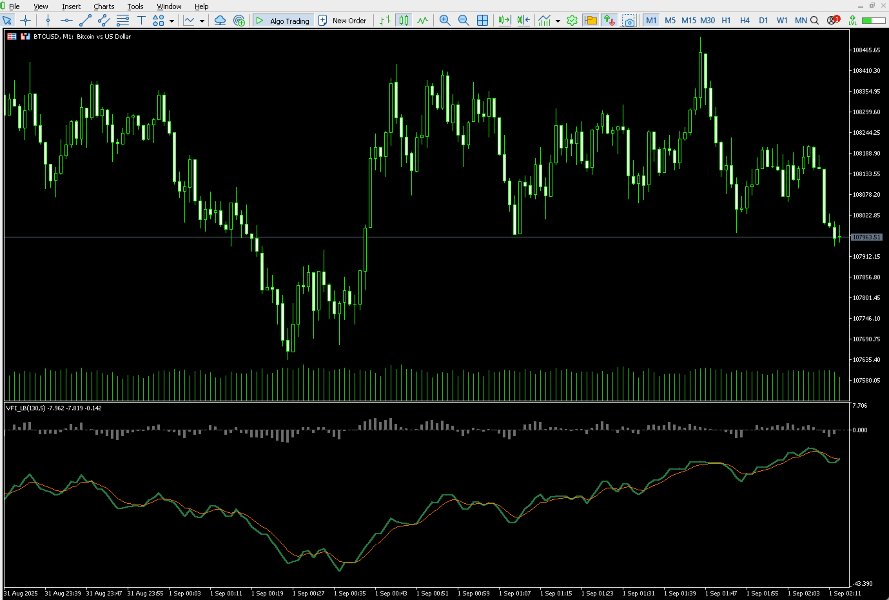
The indicator consists of three main components displayed in a separate window below the main price chart:
- VFI Line (Green): This is the primary indicator line. It calculates the flow of volume based on price changes. Its value above or below zero indicates the overall picture of buying or selling pressure.
- Signal Line (Orange): This is an Exponential Moving Average (EMA) of the VFI line. It smooths out the VFI's fluctuations and is used to generate crossover signals, helping to identify earlier changes in momentum.
- Histogram: Displays the difference between the VFI and Signal lines. The histogram provides a visual representation of the VFI's momentum. When the histogram bars expand away from the zero level, it indicates that momentum is strengthening, and vice versa.
- Zero Line: The centerline. The position of the VFI line relative to the Zero Line is a key factor in determining the dominant trend bias.
3. How to Interpret and Apply in Trading
The VFI offers multiple ways to analyze the market. Below are common application methods.
Important Note: The following methods are for reference and technical analysis purposes. They do not constitute direct trading advice. Always combine signals from the VFI with other analysis methods and a robust risk management strategy.
a. Zero-Line Crossovers
This is the most fundamental and powerful signal from the VFI, indicating a potential shift in the longer-term trend.
- Potential Bullish Signal: When the VFI line (green) crosses above the Zero Line, it suggests that buying pressure, backed by volume, is beginning to dominate. Traders may view this as a sign of a potential uptrend beginning.
- Potential Bearish Signal: When the VFI line crosses below the Zero Line, it suggests that selling pressure is increasing. This could be a sign of a potential downtrend beginning.
b. VFI/Signal Line Crossovers
These signals occur more frequently and provide earlier indications of shifts in momentum.
- Potential Early Bullish Signal: When the VFI line (green) crosses above its Signal Line (orange), it suggests that upward momentum is returning.
- Potential Early Bearish Signal: When the VFI line crosses below its Signal Line, it suggests that downward momentum is forming.
c. Divergence
Divergence is considered by many traders to be one of the most reliable signals from oscillators.
- Bullish Divergence: Occurs when the price forms a new Lower Low, but the VFI line forms a Higher Low. This suggests that although the price has fallen, the selling pressure has weakened, and a potential bullish reversal may be imminent.
- Bearish Divergence: Occurs when the price forms a new Higher High, but the VFI line forms a Lower High. This suggests that the uptrend is losing strength, and a potential bearish reversal may be approaching.
d. Trend Confirmation
- When the market is in a clear uptrend, the VFI line remaining above the zero level helps to confirm that the trend is still strong and supported by money flow.
- Conversely, when the VFI remains below the zero level during a downtrend, it reinforces the validity of that downtrend.
4. Alerts Feature
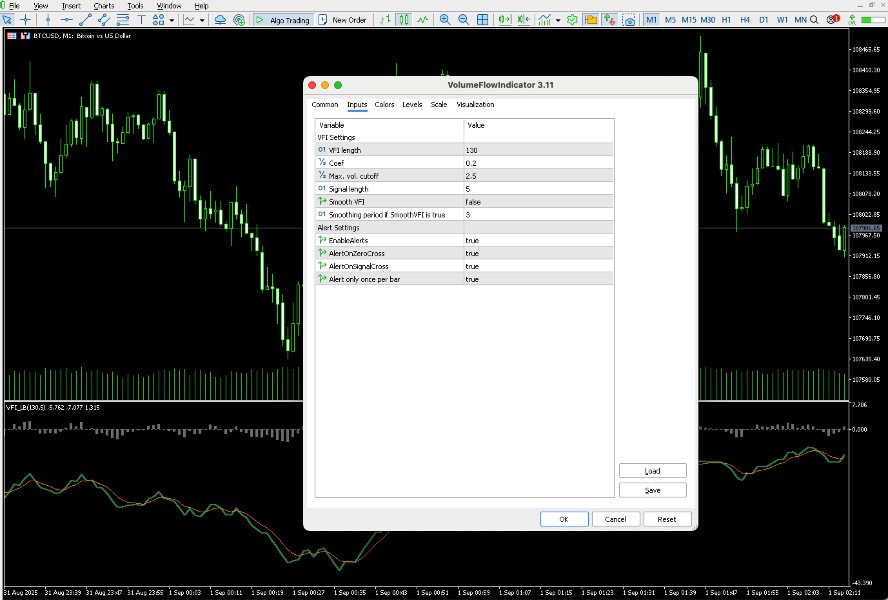
The indicator comes with a built-in alert system so you don't miss important signals. In the settings, you can customize:
- EnableAlerts : Globally enables or disables all alerts.
- AlertOnZeroCross : Enables alerts for when the VFI crosses the Zero Line.
- AlertOnSignalCross : Enables alerts for when the VFI crosses the Signal Line.
- AlertOnNewBar : Ensures that an alert is triggered only once per signal on a newly closed bar, preventing repetitive notifications.
5. Indicator Parameters
- VfiLength : The period length for the main VFI calculation. A higher value results in a smoother but slower indicator.
- Coef : The coefficient for calculating the cutoff threshold, which helps filter out insignificant price fluctuations.
- VCoef : The coefficient for capping volume spikes, making the indicator more stable.
- SignalLength : The period length for the Signal Line (EMA).
- SmoothVFI : Enables or disables an additional smoothing layer for the VFI line.
- SmaSmooth : The smoothing period if SmoothVFI is enabled.
Disclaimer: Financial trading carries a high level of risk. This tool is provided for analytical purposes only and does not constitute investment advice. Trading decisions are the sole responsibility of the user. Past performance is not indicative of future results.
