Accumulation overbought and oversold
- Indicadores
-
Artem Kuzmin
 ALL PRODUCTS ▶️ https://www.mql5.com/ru/users/zombiezorrofx/seller
🔥 Maximum commission discounts:
💠 Binance 35% (trading bypassing sanctions) - Versión: 2.0
- Actualizado: 30 marzo 2020
- Activaciones: 5
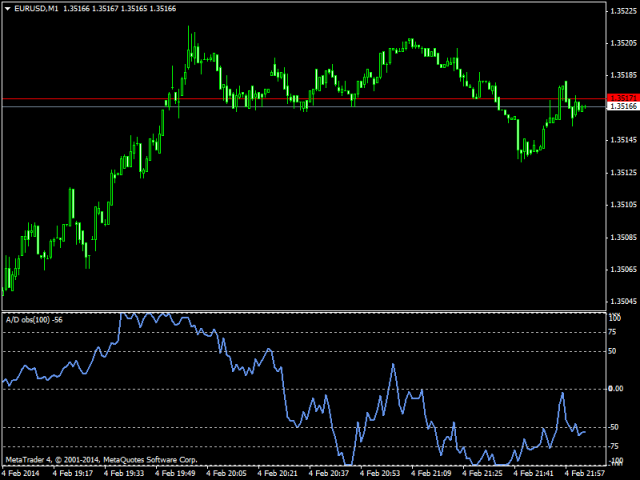
Indicador de acumulación con zonas de sobrecompra y sobreventa.
Dos opciones de visualización: como línea y como histograma.
Una serie de indicadores OBS (sobrecompra y sobreventa): se trata de indicadores mejorados con zonas de sobrecompra y sobreventa.
Ajustes sencillos y directos que se adaptan fácilmente a la herramienta adecuada.
En el indicador, puede ajustar:
Profundidad de visualización del indicador
Color de los niveles del indicador


Nice idea ... From the Author