Force overbought and oversold
- Indicadores
-
Artem Kuzmin
 ALL PRODUCTS ▶️ https://www.mql5.com/ru/users/zombiezorrofx/seller
🔥 Maximum commission discounts:
💠 Binance 35% (trading bypassing sanctions) - Versión: 1.1
- Actualizado: 3 mayo 2022
- Activaciones: 5
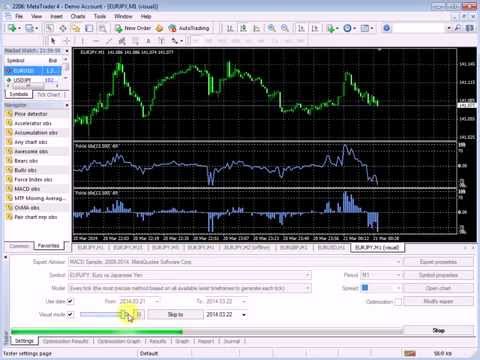
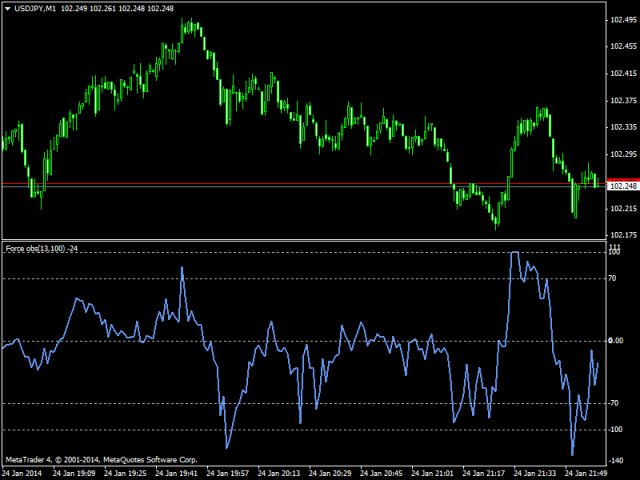
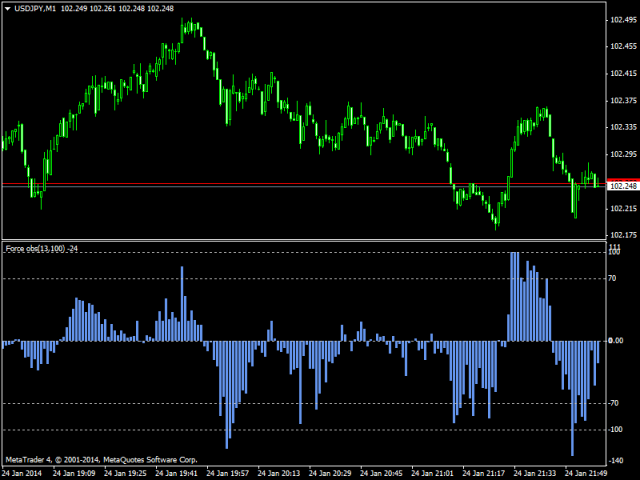
El indicador Force Index con zonas de sobrecompra y sobreventa.
Dos opciones de visualización: como línea y como histograma.
Una serie de indicadores OBS (sobrecompra y sobreventa): se trata de indicadores mejorados con zonas de sobrecompra y sobreventa.
Ajustes
- OBS Period - periodo de cálculo de sobrecompra/sobreventa
- Período de Fuerza - período de Fuerza
- Precio MA - precios para el cálculo de MA
- Método MA - método de cálculo MA
- Línea o Histo - visualización por línea o histograma