OsMA overbought and oversold
- Indicadores
-
Artem Kuzmin
 ALL PRODUCTS ▶️ https://www.mql5.com/ru/users/zombiezorrofx/seller
🔥 Maximum commission discounts:
💠 Binance 35% (trading bypassing sanctions) - Versión: 1.1
- Actualizado: 19 noviembre 2021
- Activaciones: 5
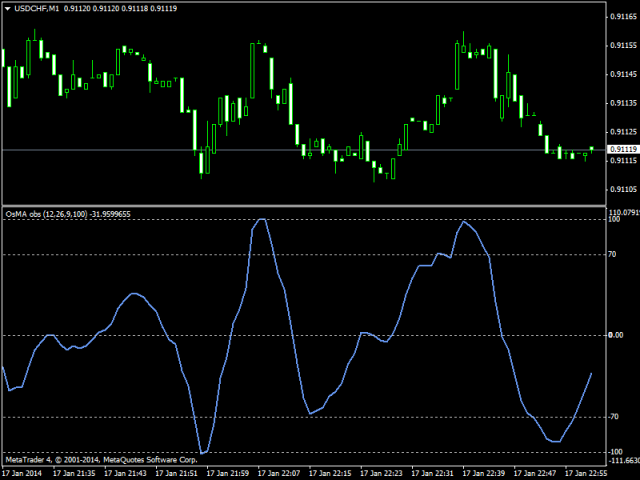
Este indicador altamente informativo aplica niveles de sobrecompra/sobreventa para una representación más precisa de la situación del mercado.
También es posible cambiar la apariencia del indicador: línea o histograma.
Parámetros adicionales permiten un ajuste más fino, mientras que el comercio puede ser dentro del canal y a lo largo de una tendencia.
Características distintivas
- Niveles de sobreventa/sobrecompra;
- No se redibuja.
- Se muestra como una línea o un histograma;
- Funciona en todos los marcos temporales y símbolos.
- Adecuado para la negociación manual y el desarrollo de Asesores Expertos.
Para entradas más precisas y confirmación adicional de señales, puede utilizarse junto con otros indicadores.
Opciones
- FastEMA - período de media móvil rápida;
- SlowEMA - período de media móvil lenta;
- SignalSMA - periodo de media móvil de señal;
- ExtPeriod - periodo para calcular los niveles de sobreventa y sobrecompra.
- Line_or_Histo - mostrar el indicador como una línea (verdadero) o un histograma (falso).
Recomendaciones de negociación
- Si el histograma (línea) está cerca de 100 o -100, la probabilidad de reversión del precio es alta.
- Si el histograma (línea) cruza 50 o -50, lo más probable es que el precio continúe moviéndose en la misma dirección.
- Si el histograma (línea) supera 0 y los máximos aumentan, existe una tendencia alcista.
- Si el histograma (línea) está por debajo de 0 y los Mínimos disminuyen, existe una tendencia bajista.
- Los máximos y mínimos locales del histograma indican que el precio puede invertirse o iniciar una corrección.
- Si el histograma (línea) cruza la línea cero hacia abajo, es una señal de venta. Si cruza la línea cero hacia arriba, es una señal de compra.
- Señales de divergencia clásicas entre el indicador y el gráfico de precios: señales de confirmación adicionales.
- La dirección de la operación debe corresponder a la dirección de la tendencia en los plazos superiores.
- Cierre la operación mediante una señal opuesta o mediante los niveles SL y TP definidos.
- Cuando se utiliza SL y TP, se recomienda establecer SL más allá del extremo más cercano, TP = 1..2 SL
- Funciona bien con un filtro de comercio de canal adicional - El indicador de canal es adecuado para este propósito.
Возможны и другие варианты, в процессе торговли вы сможете выработать наиболее удобную для вас тактику.
Дополнительную информацию и более подробный обзор методов торговли смотрите здесь:
Estrategias de trading con indicador OsMA obs
¡Желаем вам стабильной и прибыльной торговли!
Gracias por utilizar nuestro software.
Si te gusta, comparte un enlace con tus amigos.
Con el fin de no perderse el lanzamiento de nuevos programas de comercio útiles, añadirSURE FOREX TRADING a la lista de amigos.