Accumulation overbought and oversold
- Indikatoren
-
Artem Kuzmin
 ALL PRODUCTS ▶️ https://www.mql5.com/ru/users/zombiezorrofx/seller
🔥 Maximum commission discounts:
💠 Binance 35% (trading bypassing sanctions) - Version: 2.0
- Aktualisiert: 30 März 2020
- Aktivierungen: 5
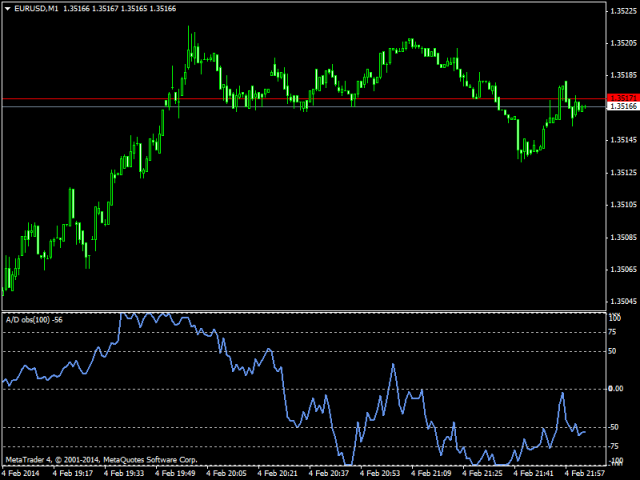
Der Akkumulationsindikator mit überkauften und überverkauften Zonen.
Zwei Anzeigeoptionen - als Linie und als Histogramm.
Eine Reihe von OBS-Indikatoren (Overbought and Oversold) - das sind Indikatoren, die um überkaufte und überverkaufte Zonen erweitert sind.
Einfache und überschaubare Einstellungen, die sich leicht an das richtige Werkzeug anpassen lassen
Im Indikator können Sie die Einstellungen vornehmen:
Anzeigetiefe des Indikators
Farbe der Indikatorstufen


Nice idea ... From the Author