Two Pairs Square Hedge Meter
- Indicadores
- Versión: 1.1
- Activaciones: 5

MEDIDOR DE SETOS CUADRADO DE DOS PARES
Pruebe este brillante indicador de 2 pares cuadrados
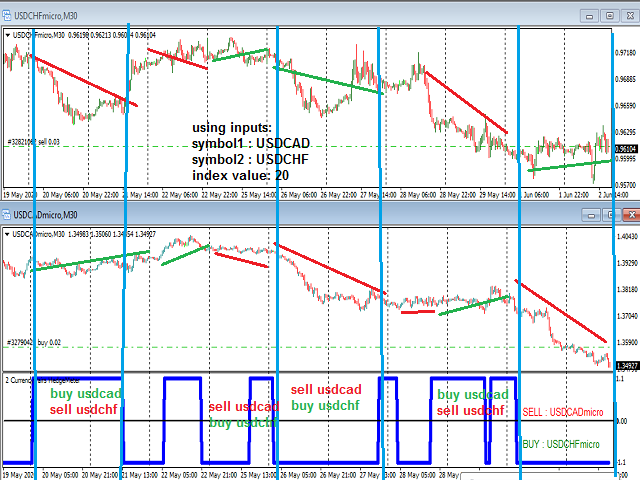
Dibuja una onda cuadrada de la relación entre sus dos símbolos de entrada
cuando la onda cuadrada indica -1 entonces es una gran oportunidad para VENDER par1 y COMPRAR par2
cuando la onda cuadrada indica +1 entonces es una gran oportunidad para COMPRAR el par1 y VENDER el par2
las entradas son : 2 pares de símbolos
entonces valor del índice : uso 20 para gráficos M30 ( puede probar otros valores : 40/50 para M15 , : 30 para M30 , : 10 para H1 , : 300 para M1 .....)
puntos de partida : número de barras para los indicadores dibujados historia : 100 ....1000
Alertas cuando el indicador cambia de -1 a 1 o de 1 a -1 (para finalizar posiciones antiguas y entrar en nuevas posiciones opuestas)