Topical levels
- Indicadores
-
Artem Kuzmin
 ALL PRODUCTS ▶️ https://www.mql5.com/ru/users/zombiezorrofx/seller
🔥 Maximum commission discounts:
💠 Binance 35% (trading bypassing sanctions) - Versión: 1.1
- Actualizado: 11 mayo 2022
- Activaciones: 5
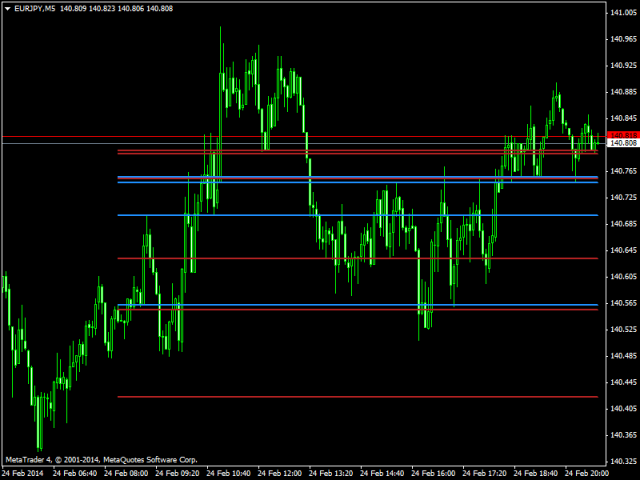
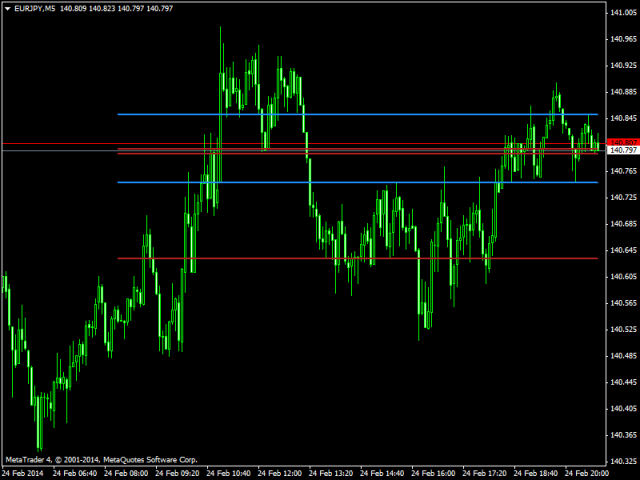
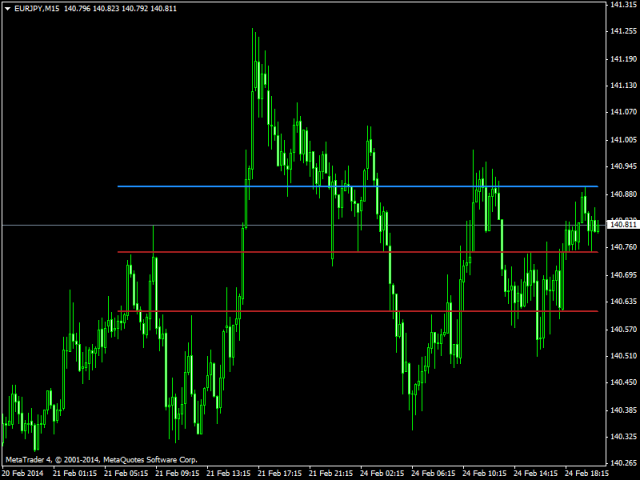
El indicador calcula los niveles críticos de precios. Si el nivel es rojo, el precio lo ha superado a la baja; si el nivel es azul, el precio lo ha superado al alza. Si el precio se acerca al nivel azul desde abajo, lo más probable es que lo supere. Si el precio se acerca al nivel azul desde arriba, lo más probable es que se produzca un retroceso. Del mismo modo, si el precio se acerca al nivel rojo desde arriba, lo más probable es que lo supere. Si el precio se acerca desde abajo, la probabilidad de retroceso es alta.
Los niveles que ya no son relevantes se eliminan del gráfico una vez que se ha dibujado un número de barras igual a CalculationBars.
El producto es adecuado tanto para seguir el mercado como para utilizar órdenes pendientes: las stop que siguen la tendencia y las limitadas basadas en correcciones. Los niveles SL y TP se colocan en los mínimos/máximos más cercanos. En ese caso, recomiendo seguir una relación SL/TP no inferior a 1/2.
Ajustes y Descripción:
- CalculationBars - número de barras para calcular los niveles;
- LineLength - longitud de las líneas en barras;
- Filtr - filtro para suavizar el ruido del precio: cuanto mayor sea el valor, menor será el número de niveles (de 1 a 100);
- UpColor - color de los niveles que el precio rompió al alza;
- DnColor - color de los niveles que el precio atravesó hacia abajo;
- LineWidth - anchura de la línea.