SFT Local Trend Signal
- Indicadores
-
Artem Kuzmin
 ALL PRODUCTS ▶️ https://www.mql5.com/ru/users/zombiezorrofx/seller
🔥 Maximum commission discounts:
💠 Binance 35% (trading bypassing sanctions) - Versión: 1.0
- Activaciones: 5
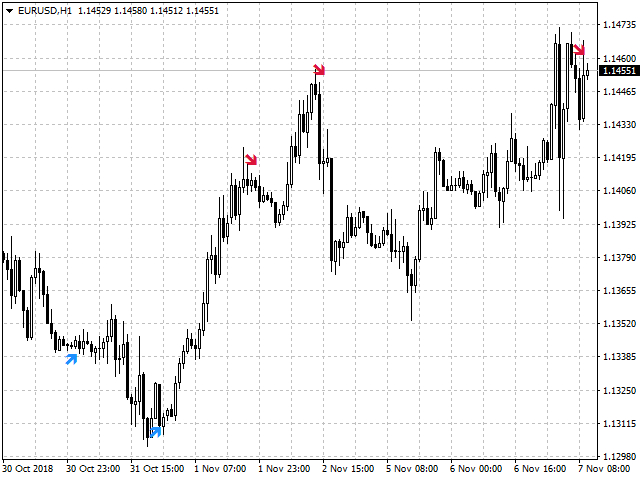
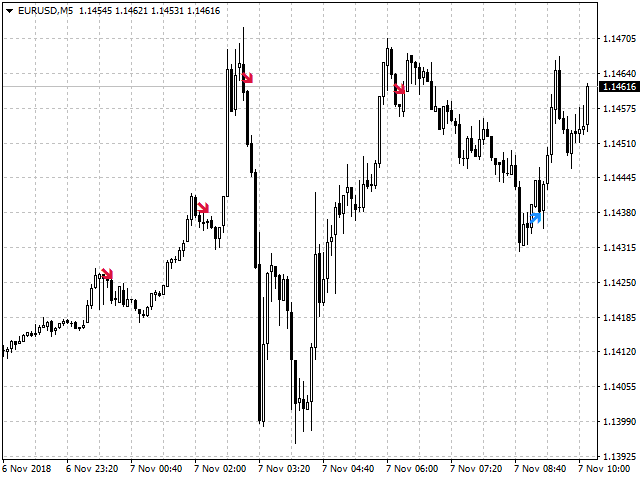
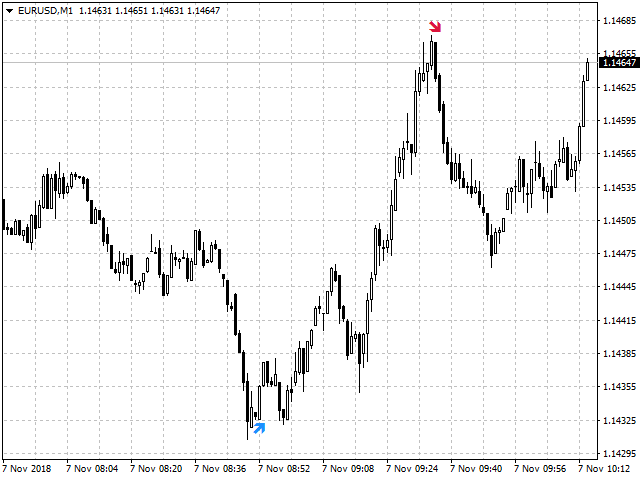
Indicador de flecha, para determinar ajustes y tendencias locales
La flecha aparece en la barra actual y después de cerrar la barra no desaparecerá.
Le permite introducir la transacción al principio del movimiento
Gracias a la configuración flexible se puede utilizar en cualquier pares de divisas, metales y cryptocurrency
Se puede utilizar cuando se trabaja con opciones binarias
Características distintivas
- No se redibuja.
- Parámetros adicionales para el ajuste fino.
- Funciona en todos los plazos y símbolos.
- Adecuado para el comercio de divisas, metales, opciones y criptomonedas (Bitcoin, Litecoin, Ethereum, etc.)
- Adecuado para el comercio manual y el desarrollo de Asesores Expertos.
Para entradas más precisas y confirmación adicional de las señales, se puede utilizar junto con otros indicadores.
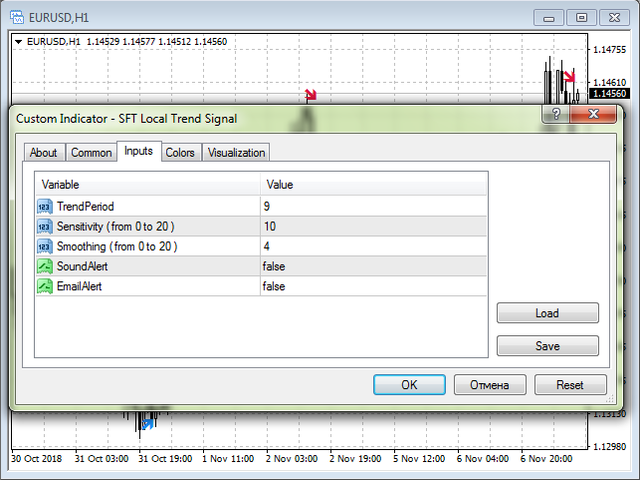
Configuración del indicador
- TrendPeriod - periodo del indicador;
- Sensibilidad - sensibilidad de 1 a 10, cuanto más alta, más señales;
- Suavizado - suavizado y filtrado de señales espurias de 1 a 10, cuanto más alto menos señales quedan;
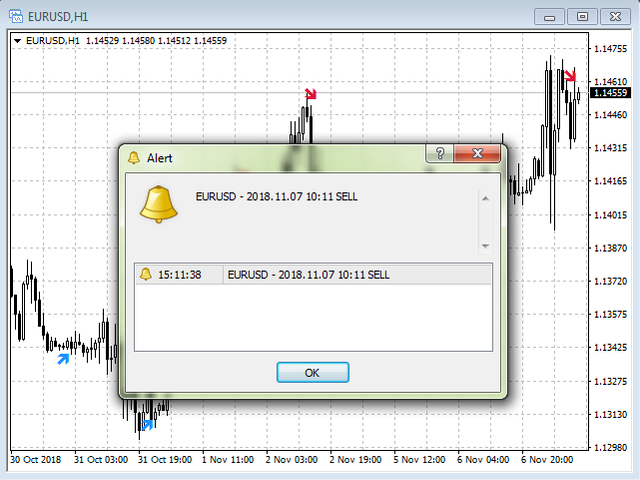
- SoundAlert - utilizar la confirmación de audio de las señales.
- EmailAlert - envía notificaciones por correo electrónico, las instrucciones de configuración están disponibles aquí.
Recomendaciones de negociación
- Cuando aparezca la flecha roja, abra Sell o Put (para opciones)
- Cuando aparezca la flecha azul, abra Buy o Call (para opciones)
- La dirección de la operación debe corresponder a la dirección de la tendencia en un marco temporal superior.
- Salga de las operaciones con una señal inversa o en los niveles SL y TP definidos.
- Cuando utilice SL y TP, fije SL más allá del extremo más cercano, TP = 1..2 SL.
- Las señales funcionan bien cerca de niveles significativos, tales niveles son bien mostrados por el indicador Topical Levels.
Otras opciones de negociación también son posibles, puede desarrollar las tácticas más convenientes para usted en el proceso de negociación.
Información adicional y una visión más detallada de los métodos de negociación se puede ver aquí:
Estrategias de negociación con el indicador SFT Local Trend Signal
Le deseamos un comercio estable y rentable.
Gracias por utilizar nuestro software.
Si le gusta, comparta el enlace con sus amigos.
Para no perderse el lanzamiento de nuevos y útiles programas de trading, añadaSURE FOREX TRADING a su lista de amigos.