OsMA Fractal channel
- Indicadores
-
Artem Kuzmin
 ALL PRODUCTS ▶️ https://www.mql5.com/ru/users/zombiezorrofx/seller
🔥 Maximum commission discounts:
💠 Binance 35% (trading bypassing sanctions) - Versión: 1.1
- Actualizado: 21 abril 2022
- Activaciones: 5
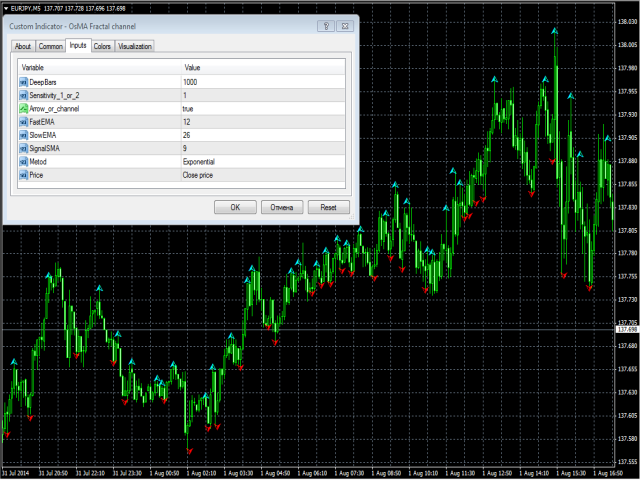
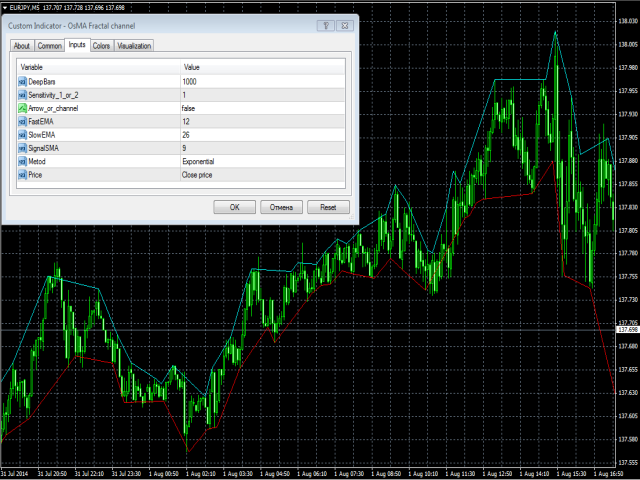
El indicador construye fractales en los extremos del indicador OsMA
Aparece en el gráfico como un fractal o un canal fractal.
Tiene una configuración flexible y, a diferencia de los fractales estándar, sólo se retrasa 1 compás.
Ajustes:
- DeepBars - profundidad de visualización del indicador;
- Sensitivity_1_or_2 - 1 - para pequeños períodos de OsMA, 2 - para grandes períodos;
- Arrow_or_channel - visualización en el gráfico de fractales o canal;
- FastMA - período de la media móvil rápida;
- SlowMA - período de la media móvil lenta;
- SignalSMA - periodo de la media móvil de señal;
- Metod - método de cálculo de FastMA y SlowMA;
- Price - para el cálculo de la FastMA y SlowMA;
¡Les deseo a todos un trading exitoso!