SFT Fractal Support and Resistance
- Indicadores
-
Artem Kuzmin
 ALL PRODUCTS ▶️ https://www.mql5.com/ru/users/zombiezorrofx/seller
🔥 Maximum commission discounts:
💠 Binance 35% (trading bypassing sanctions) - Versión: 1.0
- Activaciones: 5
Los niveles de soporte y resistencia son uno de los componentes principales de todo el análisis técnico.
Los utilizan tanto los operadores profesionales como los principiantes.
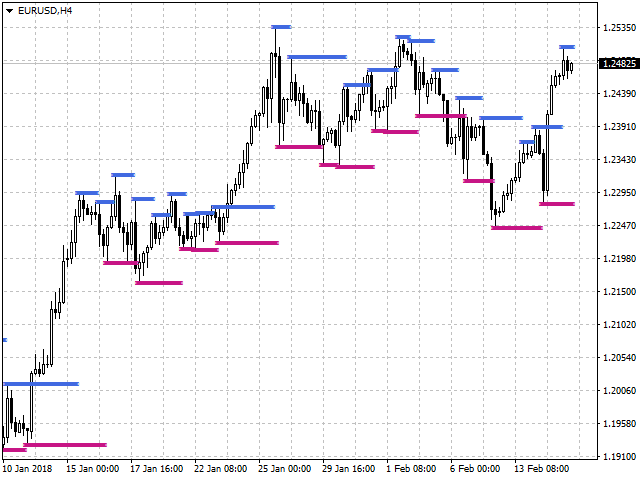
Los precios suelen moverse dentro de los canales de precios. El límite superior de dicho canal se denomina resistencia, y el inferior, soporte.
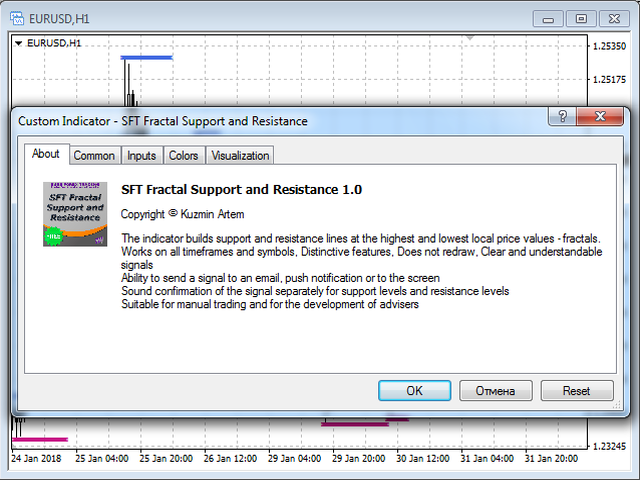
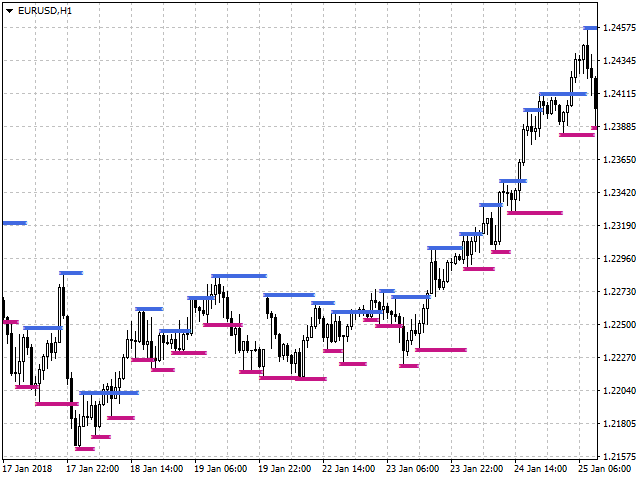
Este indicador traza líneas de soporte y resistencia fractales en los valores de precios locales más altos y más bajos (fractales).
Características distintivas
- No se redibuja.
- Señales claras y comprensibles.
- Posibilidad de enviar señales por Email, notificaciones Push o alertas en pantalla.
- Confirmación de audio de una señal por separado para niveles de soporte y niveles de resistencia.
- Funciona en todos los marcos temporales y símbolos.
- Adecuado para el trading manual y el desarrollo de Asesores Expertos.
Para entradas más precisas y confirmación adicional de señales, puede utilizarse junto con otros indicadores.
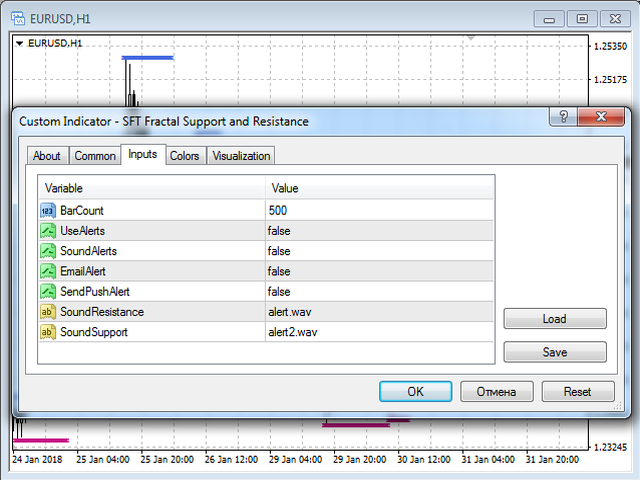
Parámetros del indicador
- BarCount - número de velas (barras) para que el indicador calcule sus valores.
- UseAlerts - activar/desactivar alertas (señales) sobre la aparición de nuevos niveles. True - las señales están habilitadas. Falso - las señales están desactivadas.
- SoundAlerts - utilizar confirmación de audio de las señales.
- EmailAlert - envía notificaciones por Email, las instrucciones de configuración están disponibles aquí.
- SendPushAlert - envía notificaciones Push sobre señales, las instrucciones de configuración están disponibles aquí.
- SoundResistance - sonido reproducido cuando aparece un nuevo nivel de resistencia.
- SoundSupport - sonido reproducido cuando aparece un nuevo nivel de soporte.
En los lugares de acumulación de niveles, las zonas de soporte / resistencia son más fuertes
En los niveles nuevos y únicos, las zonas de soporte / resistencia son más débiles
Se puede operar con dos métodos:
1. Dentro de un canal, negocie el rebote del precio desde los límites del canal entre las líneas de soporte y resistencia durante un movimiento tranquilo en un mercado plano.- En este caso, opere movimientos desde los niveles de soporte y resistencia dentro del canal.
- Coloque órdenes pendientes de venta limitada en los niveles de resistencia y de compra limitada en los niveles de soporte.
- Coloque TP en el medio del canal, SL = 1..2 TP
- En este caso, opere la ruptura del canal en las líneas de soporte y resistencia.
- Coloque órdenes pendientes Buy Stop en los niveles de resistencia y Sell Stop en los niveles de soporte.
- TP es igual a la mitad del canal, SL = 1..2 TP
Otras opciones de negociación también son posibles, puede desarrollar las tácticas más convenientes para usted en el proceso de negociación.
Información adicional y una visión más detallada de los métodos de negociación se puede ver aquí:
Estrategias de negociación con un indicador SFT Fractal Soporte y Resistencia - https://www.mql5.com/en/blogs/post/715986
Le deseamos un comercio estable y rentable. Gracias por utilizar nuestro software.
Si le gusta, comparta un enlace con sus amigos.
Para no perderte el lanzamiento de nuevos programas de trading útiles. añade SURE FOREX TRADING a la lista de amigos


El usuario no ha dejado ningún comentario para su valoración