Trend Factor
- Indicadores
-
Artem Kuzmin
 ALL PRODUCTS ▶️ https://www.mql5.com/ru/users/zombiezorrofx/seller
🔥 Maximum commission discounts:
💠 Binance 35% (trading bypassing sanctions) - Versión: 1.1
- Actualizado: 22 abril 2022
- Activaciones: 5
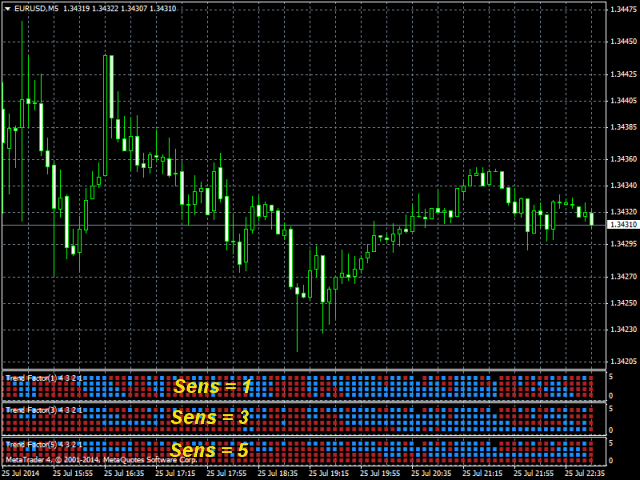
Un indicador para entrar con tendencia y salir a tiempo.
Tiene un ajuste de sensibilidad, mediante el cual se puede aplicar tanto a la especulación a largo plazo como a corto plazo.
La sensibilidad más alta = 1, con esta configuración, incluso se puede scalp en M1.
No hay retraso, no se retira después del cierre de la vela.
Una de las opciones de uso: entrar después del cierre de una vela, si la línea vertical está formada por cuadrados del mismo color; salir si cambia el color de dos o más cuadrados.
Antes de utilizarlo, asegúrese de analizar las señales de su instrumento para determinar los mejores puntos de entrada.
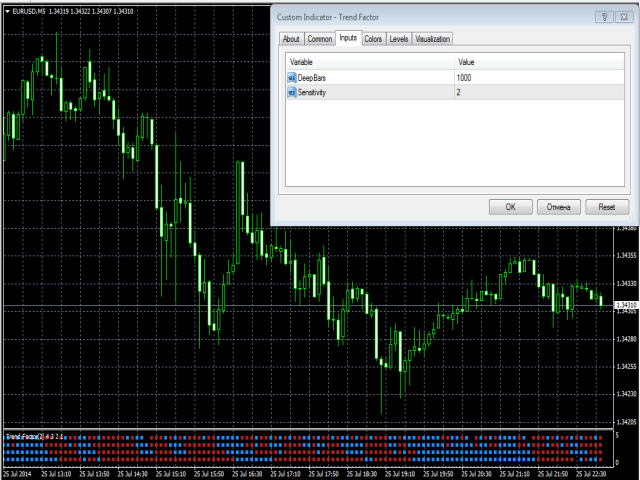
Ajustes:
- DeepBars - profundidad de visualización del indicador;
- Sensitivity - sensibilidad;