SFT Trend Chart
- Indicadores
-
Artem Kuzmin
 ALL PRODUCTS ▶️ https://www.mql5.com/ru/users/zombiezorrofx/seller
🔥 Maximum commission discounts:
💠 Binance 35% (trading bypassing sanctions) - Versión: 1.0
- Activaciones: 5
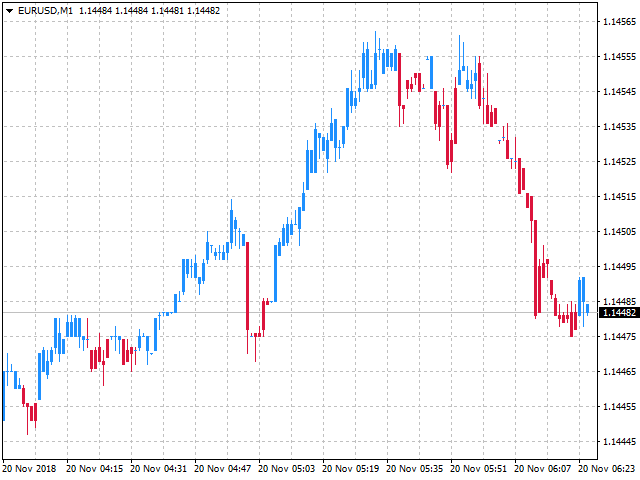
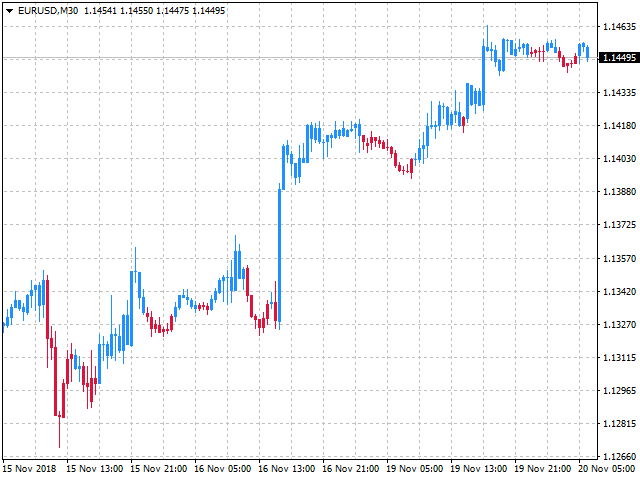
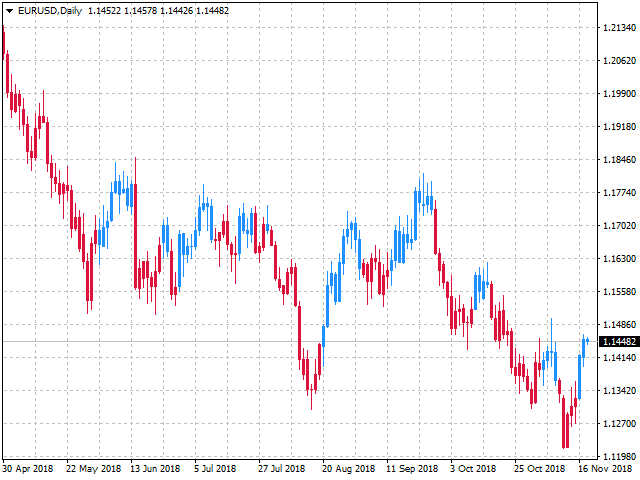
Abrir posiciones en la dirección de la tendencia es una de las tácticas de trading más comunes.
Este indicador determina la dirección del movimiento local y colorea las velas del gráfico con el color adecuado.
Le permite entrar en la operación justo al principio del movimiento.
Gracias a la configuración flexible se puede utilizar en cualquier pares de divisas, metales y cryptocurrency
Se puede utilizar cuando se trabaja con opciones binarias
Características distintivas
- No se redibuja.
- Parámetros adicionales para el ajuste fino.
- Funciona en todos los plazos y símbolos.
- Adecuado para el comercio de divisas, metales, opciones y criptomonedas (Bitcoin, Litecoin, Ethereum, etc.)
- Adecuado para el comercio manual y el desarrollo de Asesores Expertos.
Para entradas más precisas y confirmación adicional de las señales, se puede utilizar junto con otros indicadores.
Configuración del indicador
- Deep Bars - periodo del indicador;
- Sensibilidad - sensibilidad del indicador, cuanto menor sea el número más sensible;
- Precio - precios sobre los que se construye el indicador;
- Modo MA1 - método de cálculo de la primera media móvil utilizada en los cálculos;
- MA2 Mode - método de cálculo de la segunda media móvil utilizada en los cálculos;
- MA3 Mode - método de cálculo de la tercera media móvil utilizada en los cálculos;
Recomendaciones para operar
- Cuando aparezca una vela roja, abra Sell o Put (para opciones)
- Cuando aparezca una vela azul, abra Buy o Call (para opciones)
- La dirección de la operación debe corresponder a la dirección de la tendencia en un marco temporal superior.
- Salga de las operaciones con una señal inversa o en los niveles SL y TP definidos.
- Cuando utilice SL y TP, fije SL más allá del extremo más cercano, TP = 1..2 SL.
- Probado en colaboración con el indicador SFT Local Trend Signal.
Otras opciones de negociación también son posibles, puede desarrollar las tácticas más convenientes para usted en el proceso de negociación.
Información adicional y una visión más detallada de los métodos de negociación se puede ver aquí:
Estrategias de trading con el indicador SFT Trend Chart
Le deseamos un comercio estable y rentable.
Gracias por utilizar nuestro software.
Si le gusta, comparta el enlace con sus amigos.
Para no perderse el lanzamiento de nuevos y útiles programas de trading, añadaSURE FOREX TRADING a su lista de amigos.
El usuario no ha dejado ningún comentario para su valoración