BoxChart MT4
- Indicadores
-
Evgeny Shevtsov
 Indicators for volume trading :
Volume profile,
Classic profile,
Clusters chart,
Demand and supply levels,
Demand and supply diagram,
Cumulative delta.
Indicators for probabilistic analysis :
Monte Carlo predictor,
Neural predictor. - Versión: 4.4
- Actualizado: 30 abril 2026
- Activaciones: 10
El mercado es injusto aunque sólo sea porque el 10% de los participantes gestiona el 90% de los fondos. Un operador ordinario tiene pocos cambios para enfrentarse a estos "buitres". Este problema puede resolverse. Basta con estar entre ese 10%, aprender a predecir sus intenciones y moverse con ellos.
El volumen es el único factor preventivo que funciona a la perfección en cualquier marco temporal y símbolo. Primero aparece el volumen y se acumula, y sólo entonces se mueve el precio. El precio se mueve de un volumen a otro. Las zonas de acumulación de volumen forman niveles de soporte/resistencia fiables y son "probadas" regularmente por el precio, proporcionando la mejor oportunidad de entrada en el mercado. El método de operar con este indicador se reduce a operar de una zona fuerte a otra.
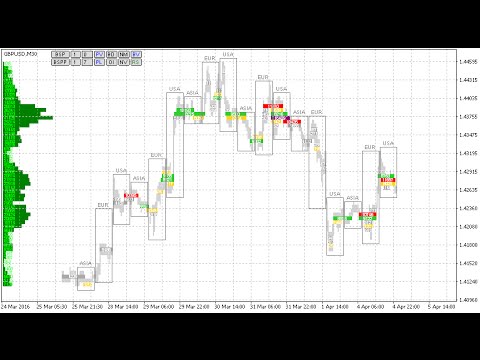
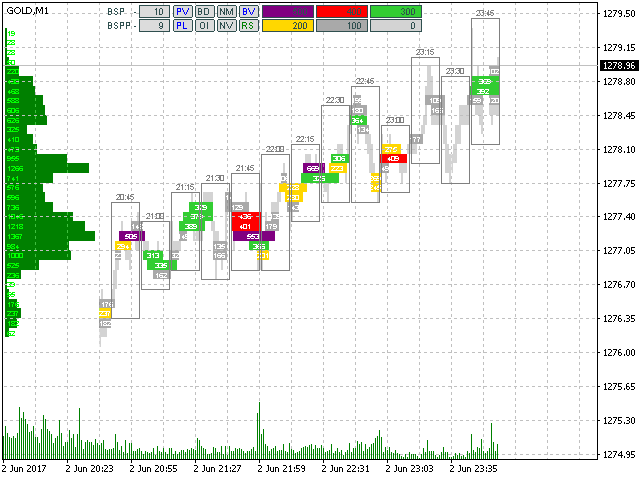
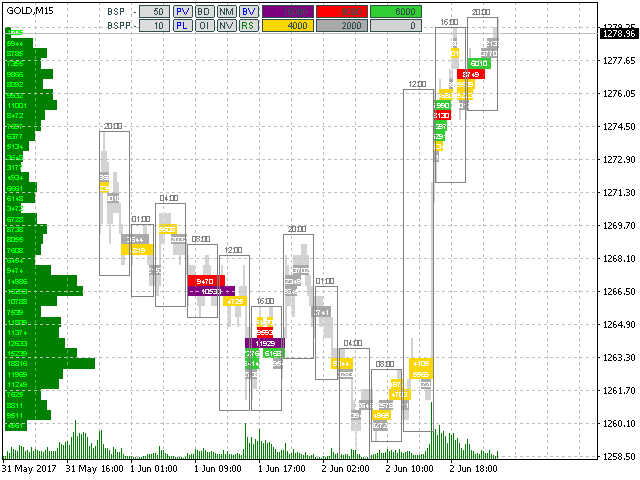
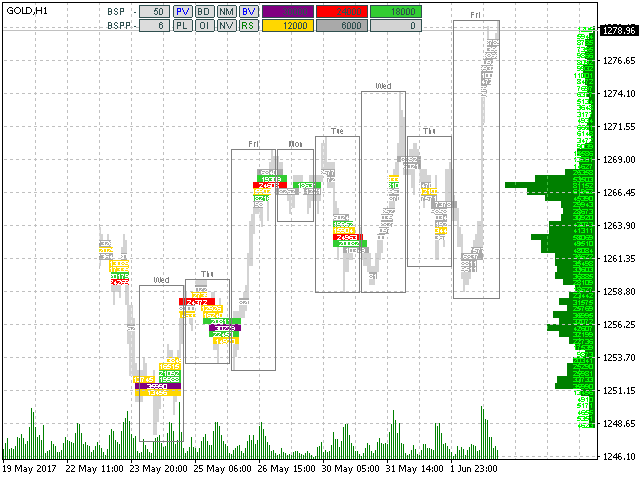
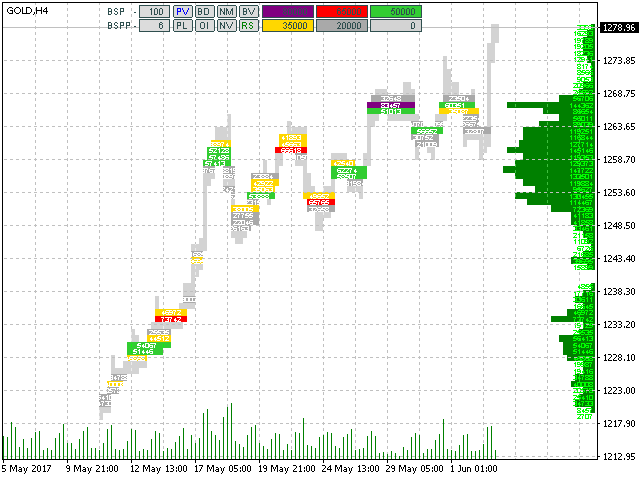
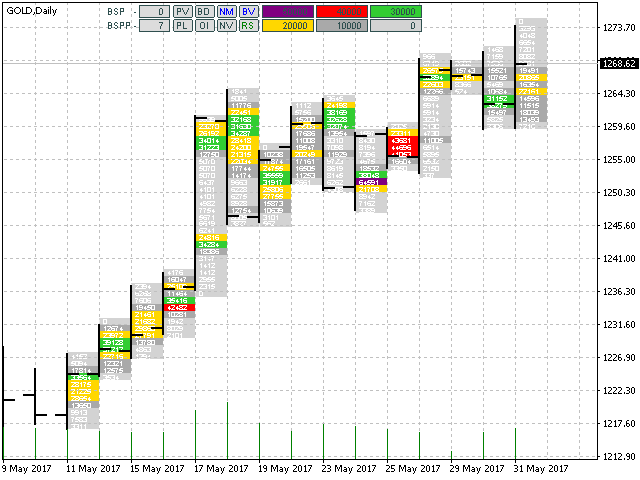
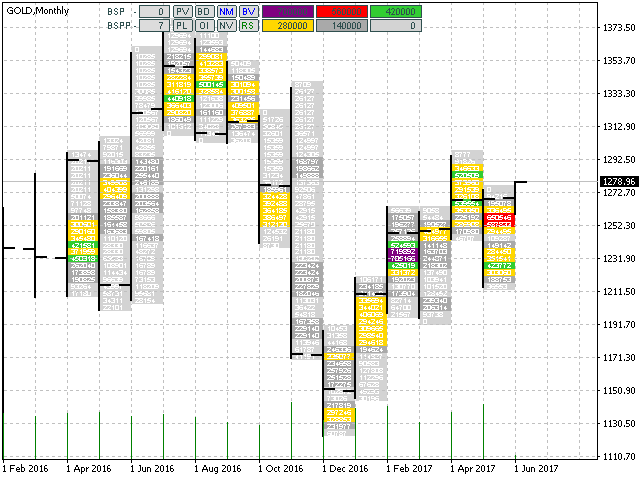
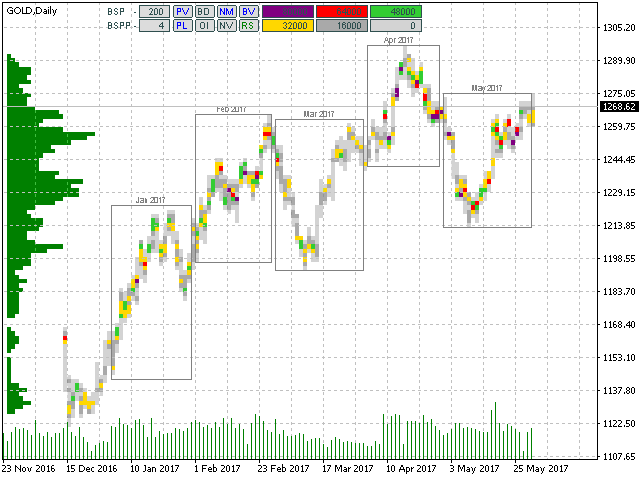
Principio de funcionamiento del indicador
El indicador BoxChart calcula las agrupaciones de volumen, las clasifica según su integridad y las marca con los colores adecuados. Además, el indicador suma todos los clusters y muestra el resultado en el eje de precios como una escala horizontal de volumen (el perfil del mercado).
El indicador funciona en todos los marcos temporales disponibles en el terminal, pero utiliza datos históricos de periodos más pequeños (en relación con el actual) M1, M5, H1, H4 y D1 para los cálculos. Antes de lanzar el indicador, descargue el historial de estos plazos desplazando el gráfico hacia la izquierda. Si no hay datos, el indicador muestra el mensaje correspondiente y realiza los dibujos sólo cuando los datos están disponibles.
El indicador realiza todos los dibujos sólo en el área de visualización del gráfico, pero puede desplazarse por el gráfico hasta el historial. Los clusters pueden "parpadear" al desplazarse por el gráfico. Se trata de un comportamiento normal, ya que se están reordenando.
Los clusters que tienen el mismo color pero diferente longitud (dentro de una misma línea de precio) son aproximadamente similares por su volumen.
Botones de los indicadores
- BSP - aumenta/disminuye un paso fijo de una rejilla de precios. Se fija en puntos "antiguos". Si es 0, el paso de cálculo se toma del parámetro establecido por el botón BSPP.
- BSPP - aumenta/disminuye un paso dinámico de una tabla de precios. Se ajusta en píxeles del monitor.
- PV - activar/desactivar el perfil de volumen.
- PL - perfil de volumen a la izquierda/derecha.
- BD - en este modo, cada cluster contiene la concentración de volumen en lugar del volumen en sí. El volumen del cluster puede ser relativamente pequeño o incluso imperceptible, pero su alta concentración por unidad de tiempo indica una alta actividad en esta vela (velas) y en el nivel de precio dado.
- OI - activar/desactivar el modo de interés abierto obtenido matemáticamente por la puesta a cero consecutiva de los volúmenes que se absorben mutuamente. Sólo los volúmenes no afectados por la operación se dejan mostrar en los clusters y en el perfil.
- NM - activar/desactivar el modo de empalme línea por línea de los clusters adyacentes.
- VT - escala de volúmenes:
- VT - volúmenes tick
- VR - volúmenes reales
- VN - sin volúmenes (los volúmenes se emulan según el principio TPO).
- BV - activar/desactivar fotogramas de periodo.
- RS - restablecer la configuración predeterminada.
Entradas
- DigitsFontSize - tamaño de letra de las etiquetas en los clusters.
- BordersFontSize - tamaño de letra de las etiquetas sobre los marcos de período.
- La clasificación automática de los clusters se realiza en incrementos de 1/6. Como resultado, tenemos seis graduaciones de color. La coincidencia de color de estas graduaciones de cluster se puede ajustar con variables de color: LowestBoxColor - hasta 1/6, LowBoxColor - hasta 2/6, MiddleBoxColor - hasta 3/6, MediumBoxColor - hasta 4/6, HighBoxColor - hasta 5/6, HighestBoxColor - hasta 6/6 de la acumulación máxima en el área visible.
- La clasificación manual de las agrupaciones la establecen los usuarios mediante las siguientes entradas: HighestBoxValue, HighBoxValue, MediumBoxValue, MiddleBoxValue, LowBoxValue y LowestBoxValue que establecen el nivel superior de volumen del cluster, por encima del cual el cluster recibe el color apropiado.
El resto de entradas se refieren a otros ajustes de color, y su propósito queda claro por su nombre.


"Зодиак" вот это музыка.
Очень Хороший индикатор.