Zig Zag 123
- Indicadores
- Versión: 1.3
- Actualizado: 30 abril 2019

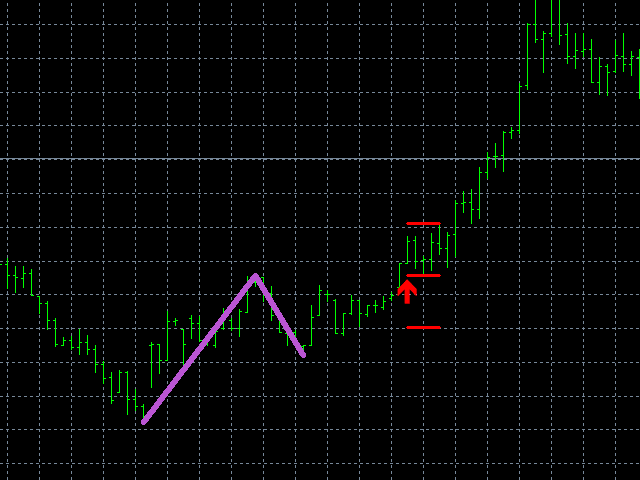
El Zig Zag 123 nos indica cuándo es más probable que se produzca una inversión o una continuación al observar el cambio en la oferta y la demanda. Cuando esto sucede, aparece un patrón característico conocido como 123 (también conocido como ABC), que a menudo rompe en dirección a un mínimo más alto o a un máximo más bajo.
Se han añadido niveles de Stop Loss y Take Profit. Hay un panel que muestra el rendimiento global de sus operaciones para si usted fuera a utilizar estos niveles de stop loss y take profit.
Recibimos alertas si aparece un patrón 123 y también si el precio alcanza nuestros niveles de stop loss o take profit establecidos por el usuario.
Características :
- Una manera eficaz de reconocer cuando un movimiento está a punto de suceder
- Elija su color de señal favorito
- Envíe alertas a su PC, correo electrónico o dispositivo móvil
- Funciona en cualquier marco temporal
- Sin repintado ni otras afirmaciones exageradas
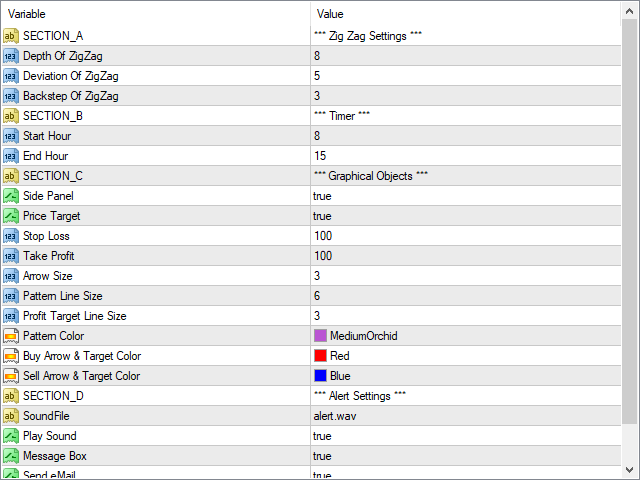
Ajustes :
Ajustes de ZigZag
- Profundidad de ZigZag - Profundidad de ZigZag
- Desviación - Desviación del ZigZag
- Paso atrás - Paso atrás de ZigZag
Hora inicial Hora final
- Hora deinicio - Sólo permitimos señal después de esta hora de inicio
- Hora final - Sólo se permite la señal antes de esta hora final
Configuración del Objeto Gráfico
- Panel lateral - Para saber si queremos el panel lateral activado o desactivado
- Precio Objetivo - Si queremos que aparezcan o no las líneas de stop loss y take profit
- Stop Loss - Establece la línea de stop loss en puntos no en pips
- Toma deGanancias - Establece la línea de toma de ganancias en puntos, no en pips.
- Tamaño de la flecha - El tamaño de la flecha 1 es el más pequeño
- Tamañodel Patrón - Tamaño de las líneas dibujadas que delinean el patrón
- Profit Size - Tamaño de las líneas dibujadas que hacen nuestros niveles de stop loss o take profit
- Color delpatrón - Color de las líneas
- Flechade compra y color del objetivo - Color de las flechas de compra
- Flecha deventa y color del objetivo - Color de las flechas de venta