SFT Go Trend
- Indicadores
-
Artem Kuzmin
 ALL PRODUCTS ▶️ https://www.mql5.com/ru/users/zombiezorrofx/seller
🔥 Maximum commission discounts:
💠 Binance 35% (trading bypassing sanctions) - Versión: 1.0
- Activaciones: 5
Abrir posiciones en la dirección de la tendencia es una de las tácticas de negociación más comunes.
La idea principal es que la probabilidad de continuación de la tendencia es mayor que la de su cambio.
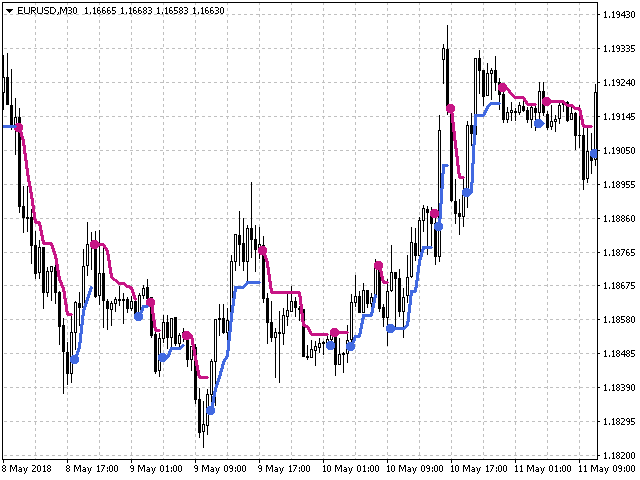
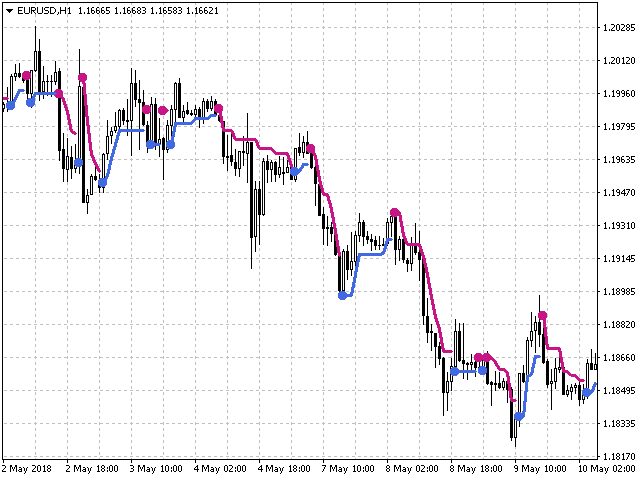
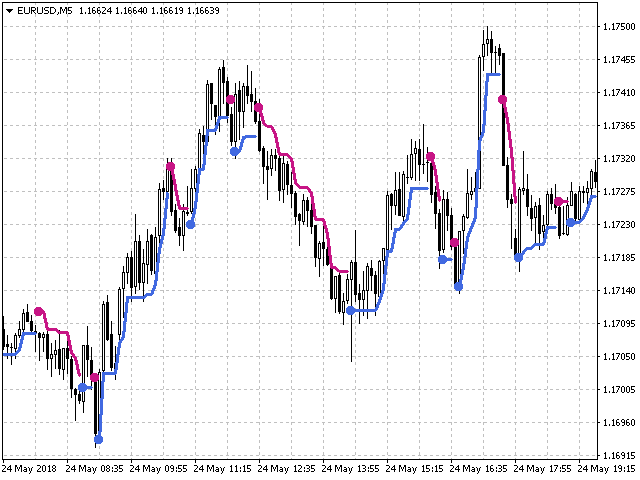
Este indicador determina la dirección de un movimiento local, marcando el inicio de una tendencia con un punto grande y su continuación con una línea del color correspondiente.
Características distintivas
- Sin repintado.
- Ajustes sencillos y precisos.
- Señales claras y comprensibles.
- Funciona en todos los marcos temporales y símbolos.
- Adecuado para el trading manual y el desarrollo de Asesores Expertos.
Para entradas más precisas y confirmación adicional de las señales, se puede utilizar junto con otros indicadores.
Configuración del indicador
- Sensibilidad - sensibilidad de la identificación de la tendencia;
- DeepBars - el número de velas (barras) para que el indicador calcule sus valores.
Recomendaciones para operar
- Abrir operaciones cuando aparezca el punto de señal después del cierre de una vela.
- La dirección de la operación debe corresponder a la dirección de la tendencia en los plazos superiores.
- Cierre la operación con una señal opuesta o con los niveles SL y TP definidos.
- Cuando utilice SL y TP, fije SL más allá del extremo más cercano, TP = 1..2 SL
Otras opciones de negociación también son posibles, puede desarrollar las tácticas más convenientes para usted en el proceso de negociación.
Información adicional y una visión más detallada de los métodos de negociación se puede ver aquí:
Le deseamos un comercio estable y rentable.
Gracias por utilizar nuestro software.
Si le gusta, comparta el enlace con sus amigos.
Con el fin de no perderse el lanzamiento de nuevos programas de comercio útil. añadir SURE FOREX TRADING a la lista de amigos