Advanced Bollinger Bands Scanner MT5
- Indicadores
- Versión: 3.0
- Actualizado: 8 octubre 2023
- Activaciones: 15

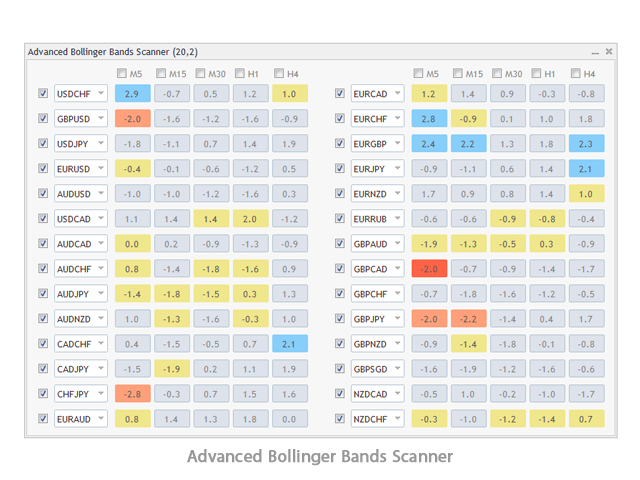
Advanced Bollinger Bands Scanner es un panel de control de las bandas de Bollinger con múltiples símbolos y marcos temporales que supervisa y analiza el indicador de las bandas de Bollinger desde un gráfico.
Este panel escanea el indicador de las Bandas de Bollinger en hasta 28 instrumentos configurables y 9 marcos temporales en busca de sobrecompra/sobreventa de precios, consolidación de precios (compresión de las Bandas de Bollinger), y ruptura de consolidación (ruptura de compresión) con una función de escaneo profundo para escanear todos los símbolos de vigilancia del mercado (¡hasta 1000 instrumentos!).
After the purchase, don't forget to message me to receive una copia de la versión completa MT4 para 1 cuenta de trading como bono.
Características avanzadas del Escáner de Bandas de Bollinger:
- Monitoreo en tiempo real de 28 instrumentos personalizables y 9 marcos de tiempo al mismo tiempo.
- Escaneo de precios alcanzando bandas inferiores y superiores, compresión de BB, y ruptura de precios fuera de la compresión.
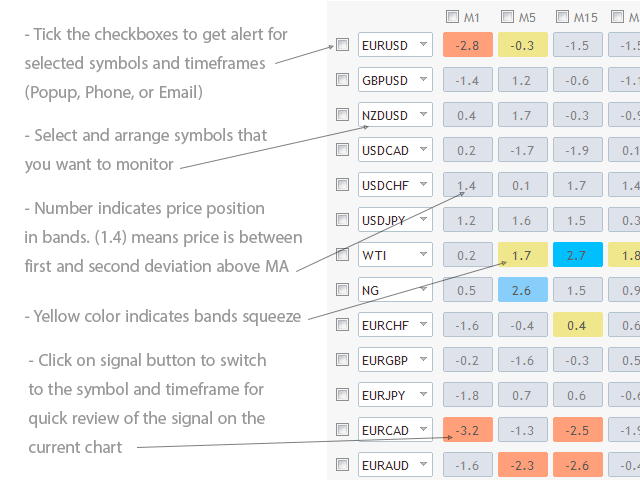
- Muestra la posición del precio en relación a las bandas en los botones del panel.
- Modo de escaneo profundo para escanear todos los símbolos de vigilancia del mercado en un marco de tiempo elegido.
- Soporta los 21 marcos temporales de la plataforma Metatrader 5.
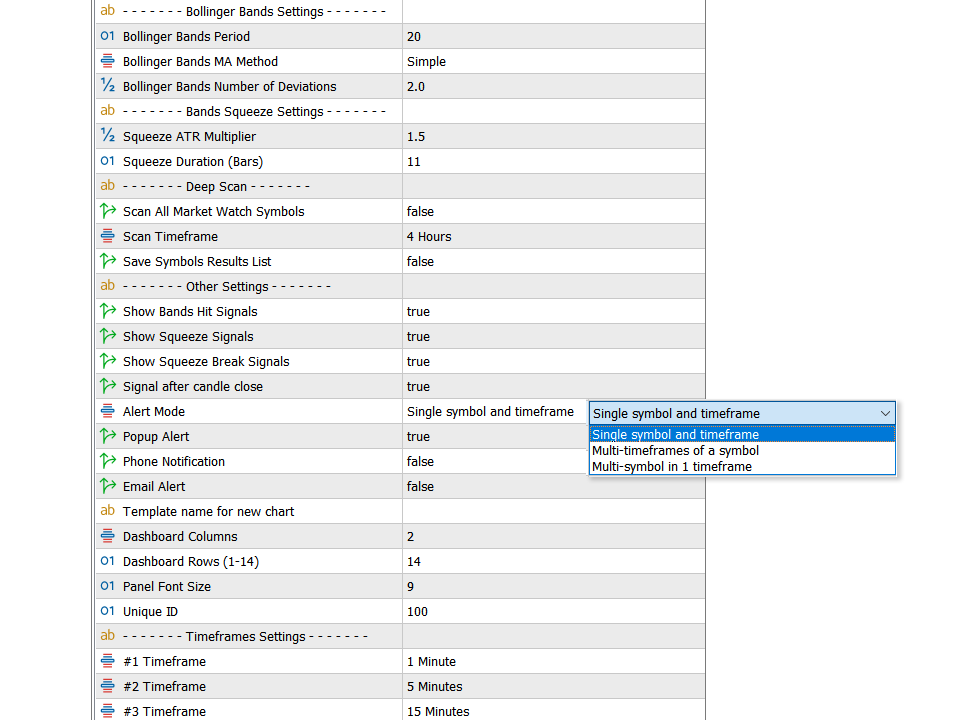
- Puede elegir entre 3 modos de alerta:
- Un solo símbolo y marco temporal
- Múltiples marcos temporales de un símbolo
- Múltiples símbolos para un marco temporal
- Revisión rápida de las señales en el mismo gráfico haciendo clic en los botones de señal.
- Fácil configuración y disposición de símbolos en cualquier orden con cualquier instrumento que le proporcione su broker.
- Alertas emergentes, por correo electrónico y por teléfono para los símbolos y plazos seleccionados.
Algunas Notas:
- El panel de las bandas de Bolinger muestra cinco señales con cinco colores. Azul claro y rojo claro para el precio que alcanza las bandas superior e inferior de las bandas de Bollinger, el color amarillo indica bandas comprimidas, azul profundo y rojo profundo son para las bandas de Bolinger que rompen inmediatamente después de que las bandas se compriman.
- Si desea supervisar más de 28 instrumentos, puede cargar el indicador en otro gráfico con un "ID único" diferente en la configuración y establecer diferentes símbolos para él.
- Los símbolos que desea agregar al tablero de instrumentos deben ser visibles en la ventana de vigilancia del mercado MetaTrader. La primera vez que ejecute el indicador o cargar un nuevo símbolo en el tablero de instrumentos BB puede tardar unos segundos para actualizar sus datos y mostrar señales.
Si usted es bueno en el comercio de bandas de Bollinger squeeze o cualquier tipo de rupturas de consolidación, es posible que desee probar la herramienta Multiplicador de Recompensa.