Visual Book on Chart
- Indicadores
-
Samuel Manoel De Souza
 Developer of trading algorithms with expertise in the platforms Metatrader 4, Metatrader 5, Trading View, Ninja Trader 8 and Quantower.
 - Versión: 2.41
- Actualizado: 8 diciembre 2022
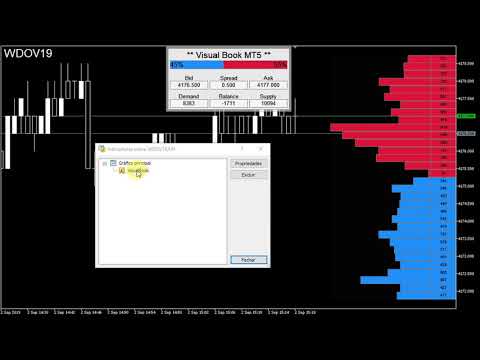
Visual Book on Chart es un indicador diseñado especialmente para los mercados de acciones y futuros. Para comprobar si puedes utilizar la herramienta con tu bróker, abre la Profundidad de Mercado (Depth of Market) en tu terminal MT5 y verifica si hay datos de precios y volúmenes disponibles. Aprende más sobre la Profundidad de Mercado de MT5 en la página oficial.
El indicador muestra los datos de profundidad de mercado en la ventana del gráfico y utiliza un degradado basado en esos datos para colorear las barras del histograma.
El indicador está formado por dos componentes:
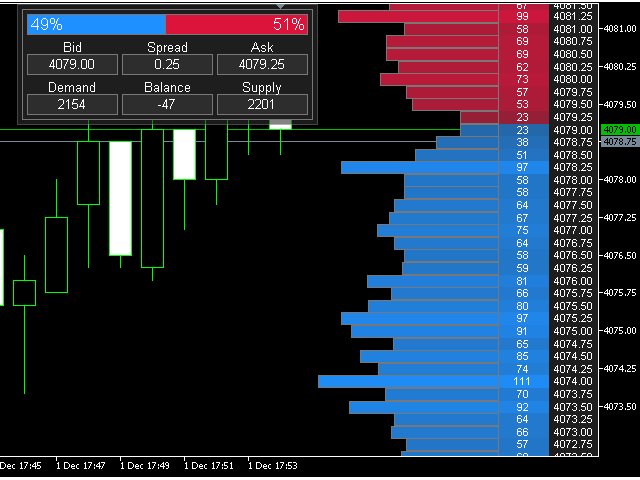
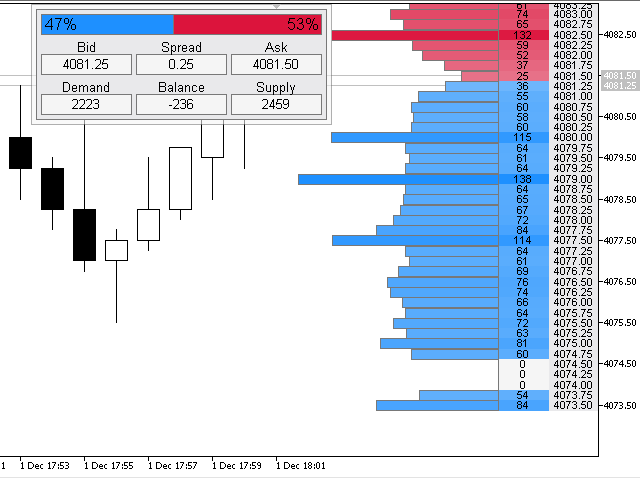
- El panel, que muestra la oferta, la demanda y su equilibrio, además de alguna información del mercado;
- El histograma, que muestra los datos del libro de órdenes de manera personalizada;
Opciones del indicador:
- Cambiar los colores del histograma;
- Seleccionar el símbolo, pudiendo visualizar los datos de otro instrumento;
- Mostrar el volumen como texto dentro del histograma;
- Alinear a la izquierda o a la derecha;
- Mostrar/Ocultar el panel;
- Mostrar/Ocultar el histograma;
- Mostrar/Ocultar las columnas del histograma;


aqui nao funciona, uso a corretota tickmil. Pode me orientar?