Ultimate Fibonacci Trader

Whether you're an analyst looking for a Fibonacci charting platform for Fibonacci Ratio analysis, or a trader looking for an advanced Fibonacci trading tool, Ultimate Fibonacci has what you need.

Ultimate Fibonacci  has the most advanced and full-featured Fibonacci charting and trading software on the market.

GIVE ME A GOOD RATING!

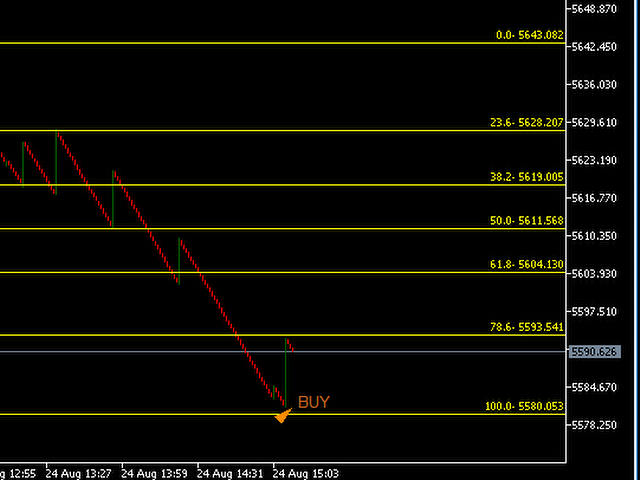
Ultimate Fibonacci measures and calculates Fibonacci projections and Retracement levels for you, as well as Price projections (like Wave 2 vs. 1 or Wave 4 vs. 2) when using Fib ratios with Elliott Wave. You can also customize the Fibonacci ratios and levels.


Ultimate Fibonacci  Software Features:

  • Fast, beautiful charts that are user-friendly, extremely flexible and customizable
  • Fibonacci Retracement, Extension, Expansion (in all of our editions)
  • Fibonacci Box, Fibonacci Grid, Fibonacci Bars
  • Ratio, Price Range, Ratio Timeline, Number Timeline
  • Custom Ratios and Formatting
  • Combine Fibonacci Ratio Analysis with Elliott Wave Analysis to pinpoint entry and exit points
  • Built for multiple monitors
  • Highly customizable chart and trading preferences in an easy-to-use, intuitive interface.
  • Plus all of the trading functionality you'd expect in an advanced professional charting and trading tool.


Recommended products
PIVOT eXtreme
Syamsurizal Dimjati
Pivot eXtreme Pivot adalah level referensi penting yang digunakan trader untuk memetakan potensi support & resistance intraday maupun jangka lebih panjang. Dalam sistem ini, level pivot dikembangkan menjadi P (Pivot Point utama) , R1–R13 (Resistance) , serta S1–S13 (Support) . Pivot Point (P) Titik pusat utama, dihitung dari rata-rata harga (High + Low + Close) / 3 . Berfungsi sebagai acuan keseimbangan harga : Jika harga di atas P → tren cenderung bullish. Jika harga di bawah P → tren cenderung
FREE
Fair Value Gap Scanner
Usiola Oluwadamilol Olagundoye
The Fair Value Gap Detector is a MetaTrader 5 indicator designed to identify and draw rectangles on the chart wherever fair value gaps (FVGs) are detected. Fair value gaps occur when there is a significant disparity between the current price and the fair value of an asset. These gaps can provide valuable insights into potential trading opportunities, as they often indicate overbought or oversold conditions in the market. Key Features: FVG Detection: The indicator utilizes a proprietary algorith
FREE
React Fibonacci Chart
Kim Yonghwa
4.75 (12)
Features Indicator for Fibonacci Retracement Trading A Fibonacci chart is drawn based on the previous bar selected among 1H, 4H, 1D, and 1W. When the market price touches the Fibonacci level, the color changes and the touch time is displayed. The Fibonacci graph is drawn at -23.6, 0, 23.6, 38.2, 50, 61.8, 76.4, 100, and 123.6 levels and the chart refreshes when the bar is updated. Variables Timeframe : A Fibonacci chart is drawn with the selected time frame among 1H, 4H, 1D, and 1W. FiboWid
FREE
Dynamic SR and Trendline Indicator
Adebowale Adeniyi Adeleke
5 (1)
The MTF Support/Resistance & Trendline Analyzer is a powerful multi-timeframe indicator that automatically detects key support and resistance levels , draws dynamic trendlines , and provides a real-time market structure dashboard — all in one clean, lightweight display. It combines fractal logic and price action detection across three timeframes to give you a unified view of market direction and structure. Whether you trade reversals, breakouts, or trends, this tool highlights the zones that mat
FREE
Pivot Point Multi-Method with Dashboard This indicator is a technical analysis tool designed to calculate and display horizontal support and resistance levels based on various Pivot Point methodologies. It is built using the MQL5 Canvas library, ensuring efficient performance and a clean visual presentation on the chart. The tool calculates levels using the data from the previous completed candle of a user-defined reference timeframe. This ensures that the levels remain fixed for the duration of
FREE
Vertical Volume
Kim Yonghwa
4.8 (5)
Features Indicator for check volume for price. Mainly works for EURUSD, other currency fair can be no work or calculation takes long time. For smooth use, Turn on "Shift end of the chart border from right border" as shown in the screenshot When apear new bar Data reset Variables COlOR : Setting of indicator color WIDTH :  Setting of indicator width PERIOD :  Determine the time of period for calculating data
FREE
Smart Sweep Detector
Juan Manuel Scandizzo
Liquidity Sweep Detector MT5 — FREE Automatically detects liquidity sweeps on swing highs and swing lows. When price breaks beyond a key level and closes back inside the range, the indicator marks it with a clear arrow on your chart — the exact moment smart money grabs liquidity and reverses. What it does: This indicator identifies swing highs and swing lows, draws them on your chart, and monitors when price sweeps beyond these levels. A sweep occurs when price breaks a swing point by a minimum
FREE
Introduction to Fractal Moving Average Fractal Moving Average indicator was designed as part of Fractal Pattern Scanner. Inside Fractal Pattern Scanner, Fractal Moving Average Indicator was implemented as multiple of chart objects. With over thousands of chart object, we find that it was not the best and efficient ways to operate the indicator. It was computationally too heavy for the indicator. Hence, we decide to implement the indicator version of Fractal Moving Average indicator to benefit ou
FREE
This indicator is a **Pivot-Confluence Zone Identifier** that focuses exclusively on identifying key support and resistance levels where price clusters align with classic pivot points. Here's what it does: ## Core Functionality **Pivot Confluence Detection**:  - Only displays price zones that align with classic pivot point levels (R1, R2, R3, S1, S2, S3) - **Excludes the main pivot point** - focuses only on support and resistance levels - Uses a configurable pip range to detect confluence nea
FREE
Bneu GLA Indicator
Marvinson Salavia Caballero
Bneu GLA Trend Indicator — Grover Llorens Activator Struggling to identify trend direction? Classic moving averages lag behind. You enter late, exit late, and lose momentum. The GLA Indicator shows trend direction instantly. A color-coded activation line that adapts to volatility. Green = bullish, Red = bearish. Signal arrows on every crossover. One glance tells you the trend. WHAT IT DOES Plots a dynamic activation line on your chart: Green line when price is above (bullish)
FREE
Phoenix Measured Box
Nigel Nii Darku Narnor Darko
PHOENIX MEASURED BOX DASHBOARD, engineered specifically for Phoenix Au Trading to provide "No dreams, just the tools" for high-precision institutional-style trading. 1. THE INDICATOR DEFINITION The Phoenix Measured Box is a multi-dimensional analysis tool designed for SMC (Smart Money Concepts) and ICT-style traders. It combines time-segmented price action with real-time volume metrics and automated target projections. Key Components: 15m Range Boxes: Automatically identifies and boxes every 15
FREE
TickChart Indicator plots tick line on the main window of MetaTrader. In the Lite version, the number of ticks is limited to 20 and the alert function described below is omitted.  The tick-line shows the most detailed, fastest and real-time activities of the market, which are usually hidden in bars or candles longer than 1 minute. Usually, several new tick-line segments appear while a bar of M1 time frame is completed. After the release of an important economic indicator, the number of ticks per
FREE
StrikeZone ATR is a professional-grade ATR-based volatility indicator designed for precision intraday trading. It visualizes volatility strength using a dynamic histogram and smoothed deviation line, helping traders instantly identify expansion, contraction, trend strength, and reversal zones. Key Features TradingView-style ATR histogram (Up/Down bars with multi-color levels) Smoothed deviation line for clearer volatility trend Instant detection of volatility spikes and quiet zones Color-coded b
FREE
Analysis Professor
Israr Hussain Shah
FiboPivot Dashboard - Professional Pivot Point Indicator What It Does FiboPivot Dashboard is a powerful technical analysis tool that automatically calculates and displays Fibonacci-based pivot points on your chart. It identifies key support and resistance levels based on the previous day's price action, helping traders anticipate potential price reversal points and breakout levels.   How to Use 1. **Install & Apply**: Simply attach the indicator to any chart (time frames below D1) 2. **
FREE
Drawing Parabolic Channels
BeeXXI Corporation
5 (6)
Convenient drawing of parabolic channels by four points (two lower and two upper extremums). Additional control keys: N (New) - Start drawing a new channel. C (Clear) - Deletes the current channel. By default, the current channel is the last channel. But you can click on the line of any channel to make it current. Click on the gear in the upper right corner to set some parameters for all channels or the current channel. All work is visible from the animated Gif. Do not forget to express your w
FREE
SMC Structure Markup
Seyed Mohammad Hosseini Hejazi
4.67 (15)
Overview The Smart Money Structure Markup Indicator for MetaTrader 5 is a powerful tool designed to help traders identify key market structures based on popular Smart Money Concepts (SMC) strategies. This indicator detects micro-market structures, providing insights into price movements and potential trend changes. It highlights important elements such as valid Break of Structure (BOS), Change of Character (CHoCH), and Inducement (IDM), helping traders to make informed decisions. Key Features Ma
FREE
VWAP for Scalpers MT5
Hispraise Chinedum Abraham
5 (2)
VWAP for Scalpers Session-aware VWAP lines for fast, precise scalps. ️ Inputs (MT4/MT5) Enable_Hourly_VWAP: Toggle hourly VWAP. Enable_Asia_VWAP: Toggle Asia session VWAP. Enable_Europe_VWAP: Toggle Europe session VWAP. Enable_NA_VWAP: Toggle North America session VWAP. Enable_Extended_VWAP: Toggle extended session VWAP. Enable_Daily_VWAP: Toggle daily VWAP. Asia Session (GMT) Session_Asia_Start_Hour: Asia session start time. Session_Asia_End_Hour: Asia session end time. Europe Session (GMT) S
FREE
NEXA Breakout Velocity NEXA Breakout Velocity is an automated trading system based on channel breakout logic combined with momentum (ROC), volume filtering, and ATR-based risk management. The system is designed to detect volatility expansion phases where price breaks beyond recent ranges with increasing speed and participation. All signals are calculated on closed bars only. Only one position per symbol is maintained at a time. Strategy Overview The system combines the following components: Chan
FREE
Overview The Period Breakout Indicator is a versatile tool designed for traders seeking to identify breakout opportunities based on customizable time periods. This indicator automatically determines the highest and lowest prices within a user-defined period, allowing you to tailor it precisely to your trading strategy. Key Features Customizable Time Periods:   Define the start and end times based on your preferred trading hours or any specific period. The indicator will then calculate the highes
FREE
NakaTrend
Ricardo De Andrade Nakano
2 (1)
"Introducing NakaTrend: Your Ultimate Trend Detector for MetaTrader 5! Ready to revolutionize your trading experience? Meet NakaTrend, your go-to indicator for identifying trend changes with precision and ease. With NakaTrend, you'll never miss another opportunity to capitalize on market shifts. When a bullish trend emerges, NakaTrend signals it with a green dollar sign, prompting you to enter a buy order. And when the tide turns bearish, a red dollar sign appears, signaling the perfect momen
FREE
The utility draws pivot levels for the selected timefram in classic method. Pivot = (high + close + low) / 3 R1 = ( 2 * Pivot) - low S1 = ( 2 * Pivot) - high R2 = Pivot + ( high - low ) R3 = high + ( 2 * (Pivot - low)) S2 = Pivot - (high - low) S3 = low - ( 2 * (high - Pivot)) you can change the timeframe, colors and fontsize. also you can change the text for the levels. Have fun and give feedback...
FREE
Dynamic Multi-Period S/R Indicator The Dynamic Multi-Period S/R is an advanced MetaTrader 5 indicator designed to automatically identify and display key Support and Resistance (S/R) levels across multiple timeframes directly on your chart. Unlike static indicators, this tool dynamically adjusts, providing you with relevant and up-to-date S/R zones from Hourly (H1), Daily (D1), and Weekly (W1) charts. This indicator goes beyond simple high/low analysis by incorporating Fractal patterns to refine
FREE
Rejection Zones
Paulo Henrique Faquineli Garcia
Este poderoso indicador analisa o gráfico e mostra zonas de Rejeição de Preços! Isto é, locais onde o preço foi, mas não foi aceito pelo mercado! A visualização desta zona de Rejeição, facilita o entendimento do trader na tomada de decisões de onde operar e como operar! O indicador é composto por 4 linhas, sendo classificadas em 2 grupos: Linhas Vermelha e Amarela: Denotam os extremos onde o preço conseguiu chegar, mas não foi aceito! Linhas Laranja e Azul: A partir delas, denotam o Início da z
FREE
Time Box Indicator MT5
Young Ho Seo
4.67 (3)
Introduction To Time Box Indicator Time Box Indicator is a must have indicator for any trader. It will display daily, weekly and Monthly box according to your preferences. Yet, you can extend any important price levels in your chart automatically. You can use them as the significant support and resistance levels. It is very simple but effective tool for your trading. Graphic Setting Use White Chart Line Style for Current Open price Daily Setting Update Timeframe for daily box Number of days to
FREE
Big Figure Indicator MT5
Vonjinirina Alfred Randrianiaina
4.33 (3)
"BIG FIGURE INDICATOR" automatically identifies and draws horizontal lines on price charts at specific levels, such as whole numbers or half-numbers (e.g., 1.0000 or 1.5000 in currency trading). These levels are considered psychologically significant because they represent round numbers that big traders and investors may focus on, leading to potential support or resistance levels. The big figure indicator can help traders identify important price levels and make trading decisions based on these
FREE
The Central Bank Dealers Range (CBDR) is a key ICT concept, used to project potential highs and lows for the day based on market conditions during a specific time window. The CBDR is utilized to forecast price movements in both bullish and bearish market conditions. By identifying this range, traders can better anticipate the price levels that may form as the day progresses. CBDR and Standard Deviation A key feature of the CBDR is its application of standard deviation , a statistical measure u
FREE
Crystal FVG Touch Detector – Advanced Smart Money Concept Tool The Crystal FVG Touch Detector is a professional-grade indicator designed for traders who follow Smart Money Concepts (SMC) and ICT methodology. It automatically detects Fair Value Gaps (FVGs) on any symbol or timeframe and visually marks them on your chart with precise color coding and touch detection. Built with non-repainting logic and optimized performance, it helps traders identify institutional imbalance zones in real time. Key
FREE
Trendy Stocks
Innovicient Limited
5 (2)
Trendy Stock is a price following indicator that uses Stochastic to show when the price is out of the oversold or overbought areas.  The algorithm allows you to stay longer in a trend where the bulls or bears are in control. The indicator changes color immediately the price exits oversold/overbought state. In short, the downtrend [red] bars start to paint when the buying pressure decreases while the uptrend [green] bars form as the buy pressure kicks in.    For MT4 version, follow :: https://www
FREE
Buyers of this product also purchase
SuperScalp Pro
Van Minh Nguyen
5 (14)
SuperScalp Pro – Advanced Multi-Filter Scalping Indicator System SuperScalp Pro is an advanced scalping indicator system that combines the classic Supertrend with multiple intelligent confirmation filters. The indicator performs efficiently across all timeframes from M1 to H4 and is especially suitable for XAUUSD, BTCUSD and major Forex pairs. It can be used as a standalone system or flexibly integrated into existing trading strategies. The indicator integrates more than 11 filters, including fa
Azimuth Pro
Ottaviano De Cicco
5 (6)
LAUNCH PROMO Azimuth Pro price is initially set at 299$ for the first 100 buyers. Final price will be 499$ . THE DIFFERENCE BETWEEN RETAIL AND INSTITUTIONAL ENTRIES ISN'T THE INDICATOR — IT'S THE LOCATION. Most traders enter at arbitrary price levels, chasing momentum or reacting to lagging signals. Institutions wait for price to reach structured levels where supply and demand actually shift. Azimuth Pro maps these levels automatically: swing-anchored VWAP, multi-timeframe structure lines, an
Divergence Bomber
Ihor Otkydach
4.89 (85)
Each buyer of this indicator also receives the following for free: The custom utility "Bomber Utility", which automatically manages every trade, sets Stop Loss and Take Profit levels, and closes trades according to the rules of this strategy Set files for configuring the indicator for various assets Set files for configuring Bomber Utility in the following modes: "Minimum Risk", "Balanced Risk", and "Wait-and-See Strategy" A step-by-step video manual to help you quickly install, configure, and s
ARICoins
Temirlan Kdyrkhan
ARICoin is a powerful trading companion designed to generate high-probability entry signals with dynamic TP/SL/DP levels based on volatility. Built-in performance tracking shows win/loss stats, PP1/PP2 hits, and success rates all updated live. Key Features: Buy/Sell signals with adaptive volatility bands Real-time TP/SL/DP levels based on ATR Built-in MA Filter with optional ATR/StdDev volatility Performance stats panel (Success, Profit/Loss, PP1/PP2) Alerts via popup, sound, push, or email Cust
Entry In The Zone and SMC Multi Timeframe is a real-time market analysis tool developed based on Smart Money Concepts (SMC). It is designed to analyze market structure, price direction, reversal points, and key zones across multiple timeframes in a systematic way. The system displays Points of Interest (POI) and real-time No Repaint signals, with instant alerts when price reaches key zones or when signals occur within those zones. It functions as both an Indicator and a Signal System (2-in-1), c
CGE Trading Suite
Carl Gustav Johan Ekstrom
5 (1)
CGE Trading Suite delivers the analytical edge typically reserved for professional trading desks. The platform integrates a full suite of analytical tools into one seamless workflow: dynamic grid mapping, liquidity behavior analysis, ECM, trend lines, MIDAS, trade cycles, and directional channel projections. Together, these provide a unified view of market structure and momentum. Directional clarity is further enhanced by the capital flow index, which measures currency basket strength to identif
New Update of   Smart Trend Trading System MT5 For  2026 Market: If You Buy this Indicator you will Get my Professional Trade Manager + EA  for FREE . First of all Its worth emphasizing here that this Trading System is Non-Repainting   , Non Redrawing and Non Lagging Indicator Which makes it ideal from both manual and robot trading .  [Online course] , [manual] and [download presets] . The Smart Trend Trading System MT5 is a comprehensive trading solution tailored for new and experienced traders
Gold Entry Sniper
Tahir Mehmood
5 (6)
Gold Entry Sniper – Professional Multi-Timeframe ATR Dashboard for Gold Scalping & Swing Trading Gold Entry Sniper is a cutting-edge MetaTrader 5 indicator designed to give traders precise buy/sell signals for XAUUSD and other symbols, powered by ATR Trailing Stop logic and a multi-timeframe analysis dashboard . Built for both scalpers and swing traders, it combines real-time market direction , dynamic stop levels , and professional visual dashboards to help you identify high-probability gold en
Meridian Pro
Ottaviano De Cicco
5 (1)
Meridian Pro: Professional Multi-Timeframe Trend Matrix for MT5 Overview Meridian Pro is a multi-timeframe trend matrix by Merkava Labs that compresses directional state, strength, momentum condition and matrix agreement into one compact panel. One adaptive engine, applied consistently from M1 to W1. No per-symbol tuning. No indicator stacking. One structured readout across every asset and every timeframe. Launch Offer — Get Meridian Pro for USD 99 (introductory). Regular price: USD 149. 1. Why
RelicusRoad Pro: Quantitative Market Operating System 70% OFF LIFETIME ACCESS (LIMITED TIME) - JOIN 2,000+ TRADERS Why do most traders fail even with "perfect" indicators? Because they trade Single Concepts in a vacuum. A signal without context is a gamble. To win consistently, you need CONFLUENCE . RelicusRoad Pro is not a simple arrow indicator. It is a complete Quantitative Market Ecosystem . It maps the "Fair Value Road" price travels on, distinguishing between random noise and true structur
FX Trend MT5 NG
Daniel Stein
5 (4)
FX Trend NG: The Next Generation Multi-Market Trend Intelligence Overview FX Trend NG is a professional multi-timeframe trend and market monitoring tool designed to give you a complete structural overview of the market in seconds. Instead of switching between dozens of charts, you instantly see which symbols are trending, where momentum is fading, and where strong alignment exists across timeframes. Launch Offer – Get FX Trend NG for $30 (6 Months) or $80 Lifetime . Already part of the Stein I
Power Candles MT5
Daniel Stein
5 (6)
Power Candles – Strength-Based Entry Signals for Any Market Power Candles brings Stein Investments’ proven strength analysis directly onto your price chart. Instead of reacting to price alone, each candle is colored based on real market strength, allowing you to instantly identify momentum build-ups, strength acceleration, and clean trend transitions. One Logic for All Markets Power Candles works automatically on all trading symbols . The indicator detects whether the current symbol is a Forex p
AriX
Temirlan Kdyrkhan
1 (4)
AriX Indicator for MT5 A powerful trend-following and signal-evaluation tool AriX is a custom MT5 indicator that combines Moving Averages and ATR-based risk/reward logic to generate clear buy/sell signals. It visualizes dynamic SL/TP levels, evaluates past trade outcomes, and displays win/loss statistics in a clean on-chart panel. Key features include: Buy/Sell signals based on MA crossovers ATR-based SL/TP1/TP2/TP3 levels with visual lines and labels Signal outcome tracking with real-time stat
Quantum TrendPulse
Bogdan Ion Puscasu
5 (22)
Introducing Quantum TrendPulse , the ultimate trading tool that combines the power of SuperTrend , RSI , and Stochastic into one comprehensive indicator to maximize your trading potential. Designed for traders who seek precision and efficiency, this indicator helps you identify market trends, momentum shifts, and optimal entry and exit points with confidence. Key Features: SuperTrend Integration: Easily follow the prevailing market trend and ride the wave of profitability. RSI Precision: Detect
Trend Screener Pro MT5
STE S.S.COMPANY
4.84 (103)
Trend Screener Indicator --Professional Trend Trading & Market Scanning System for MetaTrader Unlock the true power of trend trading with Trend Screener Indicator — a complete multi-currency, multi-timeframe trend analysis solution powered by Fuzzy Logic,Trend Pulse Technology  and advanced market structure algorithms.   Trend Screener transforms your MetaTrader platform into a professional-grade Trend Analyzer and Market Scanner, helping you identify high-probability trend opportunities, early
[ My Products ] , [ My Channel ]  , [ LIVE SIGNAL ] HFT Spike Detector HFT Spike Detector is a professional tick monitoring tool designed to analyze and measure high-frequency price movements (sudden spikes caused by HFT) in real time. Its purpose is to enable you to detect abnormal slippage, liquidity gaps, and millisecond-level price spikes caused by the broker using numerical data. Because it analyzes real-time tick flow and execution conditions, it cannot be accurately evaluated in backt
Atomic Analyst MT5
Issam Kassas
3.94 (31)
New Update of   Atomic Analyst MT5 For  2026 Market: If You Buy this Indicator you will Get my Professional   Trade Manager + EA  for   FREE . First of all Its worth emphasizing here that this Trading Indicator is   Non-Repainting   , Non Redrawing and Non Lagging Indicator   Indicator, Which makes it ideal from both manual and robot trading.  User manual: settings, inputs and strategy . The Atomic Analyst  is a PA Price Action Indicator that uses Strength and Momentum of the price to find a bet
Market makers' tool. Meravith will: Analyze all timeframes and display the current trend in force. Highlight liquidity zones (volume equilibrium) where bullish and bearish volumes are equal. Display all liquidity levels across different timeframes directly on your chart. Generate and present text-based market analysis for your reference. Calculate targets, support levels, and stop-loss points based on the current trend. Compute the risk/reward ratio for your trades. Determine position size accor
OmniSync Projection
Antonio-alin Teculescu
5 (1)
Chronos Fractal Engine is an innovative price projection indicator for MetaTrader 5, designed to transform your technical analysis by intelligently identifying and projecting historical price patterns. Built upon an advanced correlation algorithm and the fractal principles of the market, this powerful tool visualizes potential future price movements, giving you a unique edge in your trading decisions. What is Chronos Fractal Engine? At its core, the Chronos Fractal Engine employs a sophisticat
Bill Williams Advanced
Siarhei Vashchylka
5 (11)
Bill Williams Advanced is designed for automatic chart analysis using Bill Williams' "Profitunity" system. The indicator analyzes four timeframes at once. Manual (Be sure to read before purchasing) Advantages 1. Analyzes the chart using Bill Williams' "Profitunity" system. Signals are displayed in a table in the corner of the screen and on the price chart. 2. Finds all known AO and AC signals, as well as zone signals. Equipped with a trend filter based on the Alligator. 3. Finds "Divergence Bar
Currency Strength Dashboard Pro Professional real-time currency strength analysis dashboard for MetaTrader 5 . The indicator calculates and displays the strength of 8 major currencies (EUR, USD, GBP, JPY, CHF, AUD, CAD, NZD) across 28 currency pairs simultaneously on multiple timeframes. The dashboard gives traders a complete market overview at a glance — without unnecessary calculations or switching between charts. Calculation Method The indicator is based on an advanced mathematical currency s
Grabber System MT5
Ihor Otkydach
4.83 (23)
Let me introduce you to an excellent technical indicator – Grabber, which works as a ready-to-use "All-Inclusive" trading strategy. Within a single code, it integrates powerful tools for technical market analysis, trading signals (arrows), alert functions, and push notifications. Every buyer of this indicator also receives the following for free: Grabber Utility for automatic management of open orders Step-by-step video guide: how to install, configure, and trade with the indicator Custom set fi
Introducing   Quantum Breakout PRO , the groundbreaking MQL5 Indicator that's transforming the way you trade Breakout Zones! Developed by a team of experienced traders with trading experience of over 13 years,   Quantum Breakout PRO   is designed to propel your trading journey to new heights with its innovative and dynamic breakout zone strategy. Quantum Breakout Indicator will give you signal arrows on breakout zones with 5 profit target zones and stop loss suggestion based on the breakout b
FX Power MT5 NG
Daniel Stein
5 (31)
FX Power: Analyze Currency Strength for Smarter Trading Decisions Overview FX Power is your go-to tool for understanding the real strength of currencies and Gold in any market condition. By identifying strong currencies to buy and weak ones to sell, FX Power simplifies trading decisions and uncovers high-probability opportunities. Whether you’re looking to follow trends or anticipate reversals using extreme delta values, this tool adapts seamlessly to your trading style. Don’t just trade—trade
Advanced Supply Demand MT5
Bernhard Schweigert
4.53 (15)
Best Solution for any Newbie or Expert Trader! This indicator is a unique, high quality and affordable trading tool because we have incorporated a number of proprietary features and a new formula. With this update, you will be able to show double timeframe zones. You will not only be able to show a higher TF but to show both, the chart TF, PLUS the higher TF: SHOWING NESTED ZONES. All Supply Demand traders will love it. :) Important Information Revealed Maximize the potential of Advanced Supply
RFI levels PRO MT5
Roman Podpora
3.67 (3)
The indicator accurately shows the reversal points and price return zones where the   Major players . You see where new trends are forming and make decisions with maximum precision, maintaining control over every trade. VERSION MT4     -    Reveals its maximum potential when combined with the   TREND LINES PRO   indicator What the indicator shows: Reversal structures and reversal levels with activation at the beginning of a new trend. Display of   TAKE PROFIT   and   STOP LOSS   levels with min
Market Structure Order Block Dashboard MT5 is an MT5 indicator focused on Market Structure and ICT / Smart Money Concepts: HH/HL/LH/LL , BOS , ChoCH , plus Order Blocks , Fair Value Gaps (FVG) , Liquidity (EQH/EQL, sweeps), Sessions / Kill Zones , and an integrated Volume Profile with a compact confluence dashboard. Important: This is an analysis tool . It does not execute trades (not an EA). Buyer Bonus After purchase, you can receive 2 bonus indicators (your choice) from my store. How to clai
Trend Forecaster
Alexey Minkov
5 (7)
The Trend Forecaster indicator utilizes a unique proprietary algorithm to determine entry points for a breakout trading strategy. The indicator identifies price clusters, analyzes price movement near levels, and provides a signal when the price breaks through a level. The Trend Forecaster indicator is suitable for all financial assets, including currencies (Forex), metals, stocks, indices, and cryptocurrencies. You can also adjust the indicator to work on any time frames, although it is recommen
Crystal Heikin Ashi Signals
Muhammad Jawad Shabir
5 (1)
Crystal Heikin Ashi Signals - Professional Trend & Signal Detection Indicator Advanced Heikin Ashi Visualization with Intelligent Signal System for Manual & Automated Trading Final Price: $149 ---------> Price goes up $10 after every 10 sales . Limited slots available — act fast . Overview Crystal Heikin Ashi Signals is a professional-grade MetaTrader 5 indicator that combines pure Heikin Ashi candle visualization with an advanced momentum-shift detection system. Designed for both manual traders
See which strategy actually works on your symbol - before you risk real money. Power Bar detects extreme price bars on any symbol and any timeframe, then instantly backtests 3 different trading strategies so you can compare win rates, profit factors, and P&L side by side. All in a single interactive panel. No guessing. No curve-fitting. Just data. What makes Power Bar unique? Most indicators give you a signal and leave you guessing whether it works. Power Bar goes further: it tests every signal
Filter:
No reviews
Reply to review