Volume Profile Session Visible and Fixed Range
- Indicators
-
Kazuma Uezono
 MQL5 / MQL4 / Pine Script v6 developer and active trader.
Seller on the MQL5 Market (indicators for MT4/MT5).
Services:
- TradingView Pine Script to MT5/MT4 conversion (bar-by-bar matching, with tester report)
- MT4 to MT5 migration - Version: 1.2
- Activations: 5
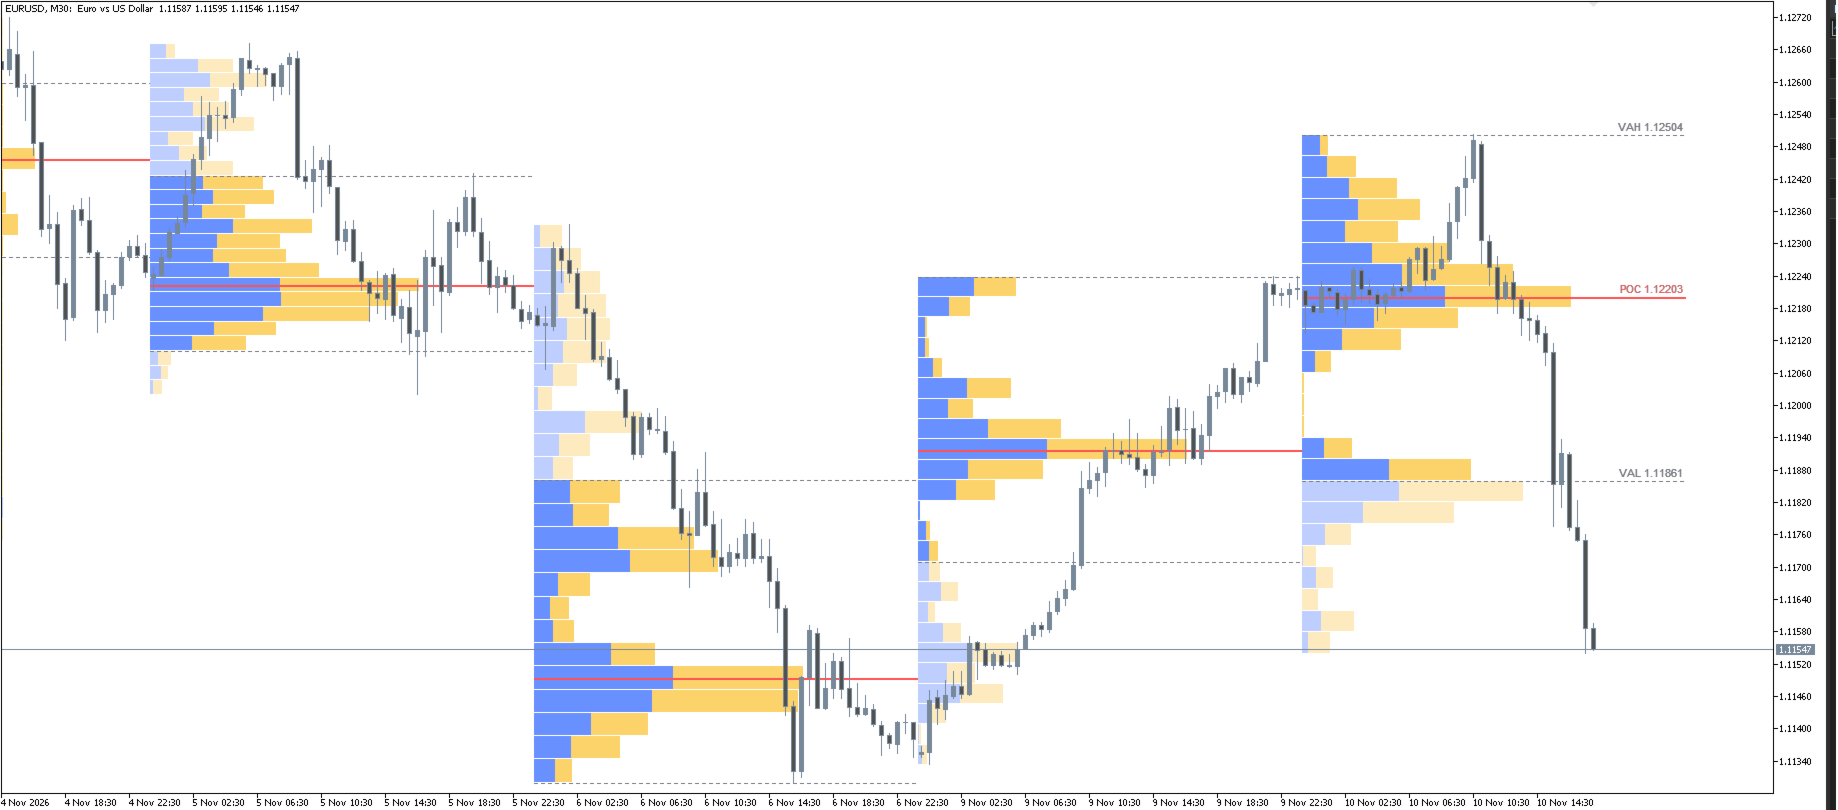
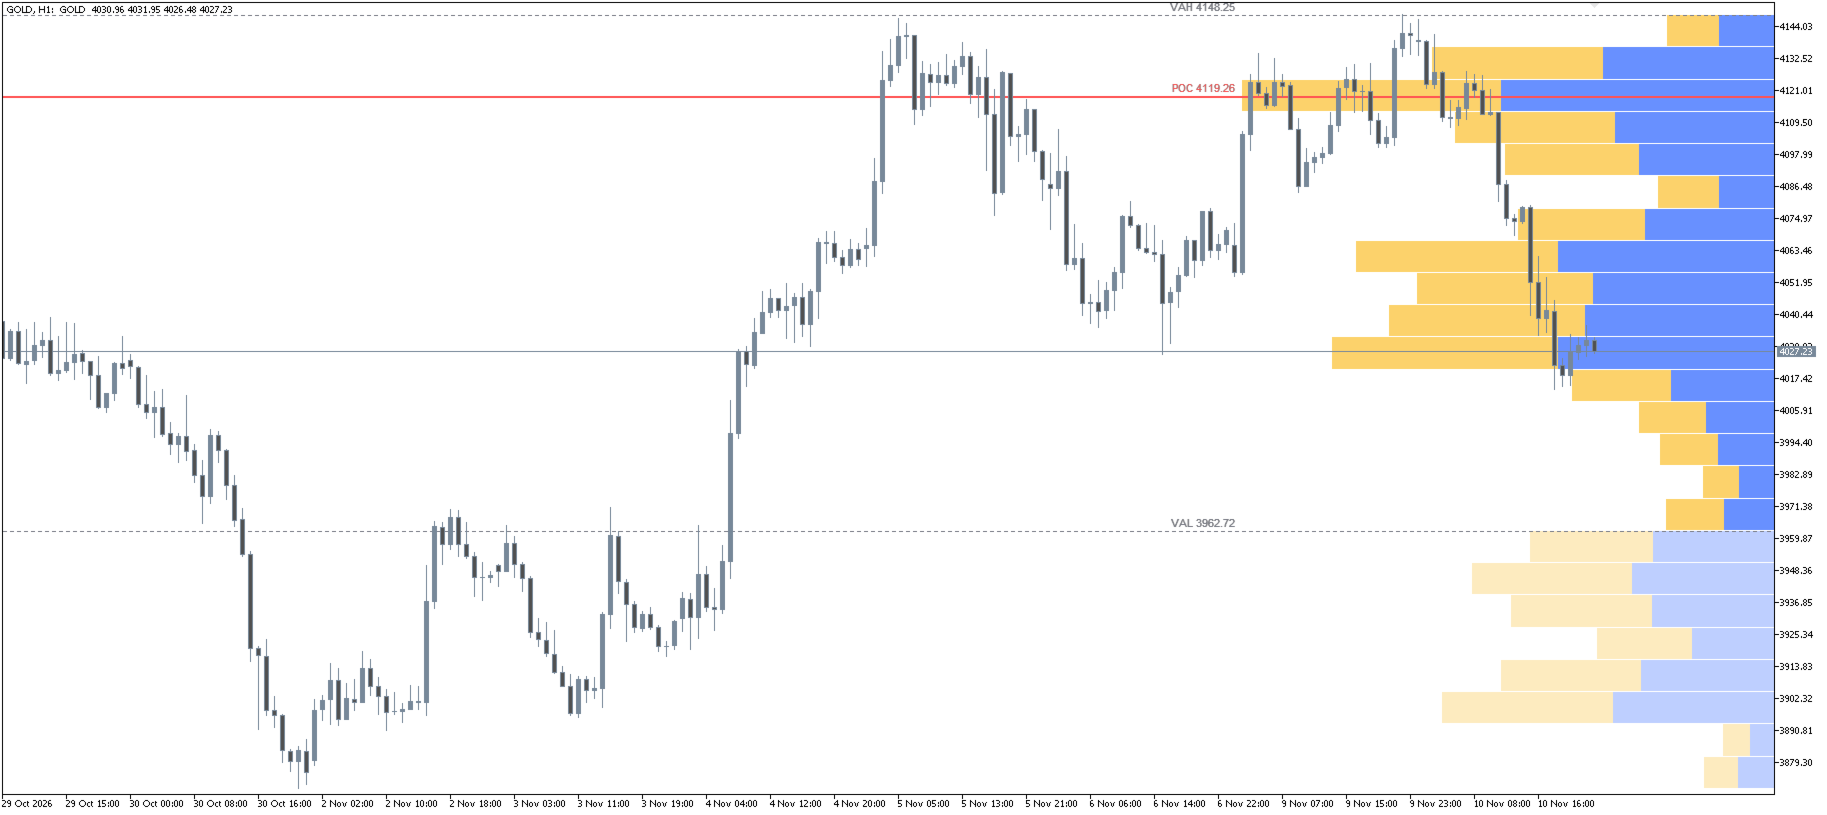
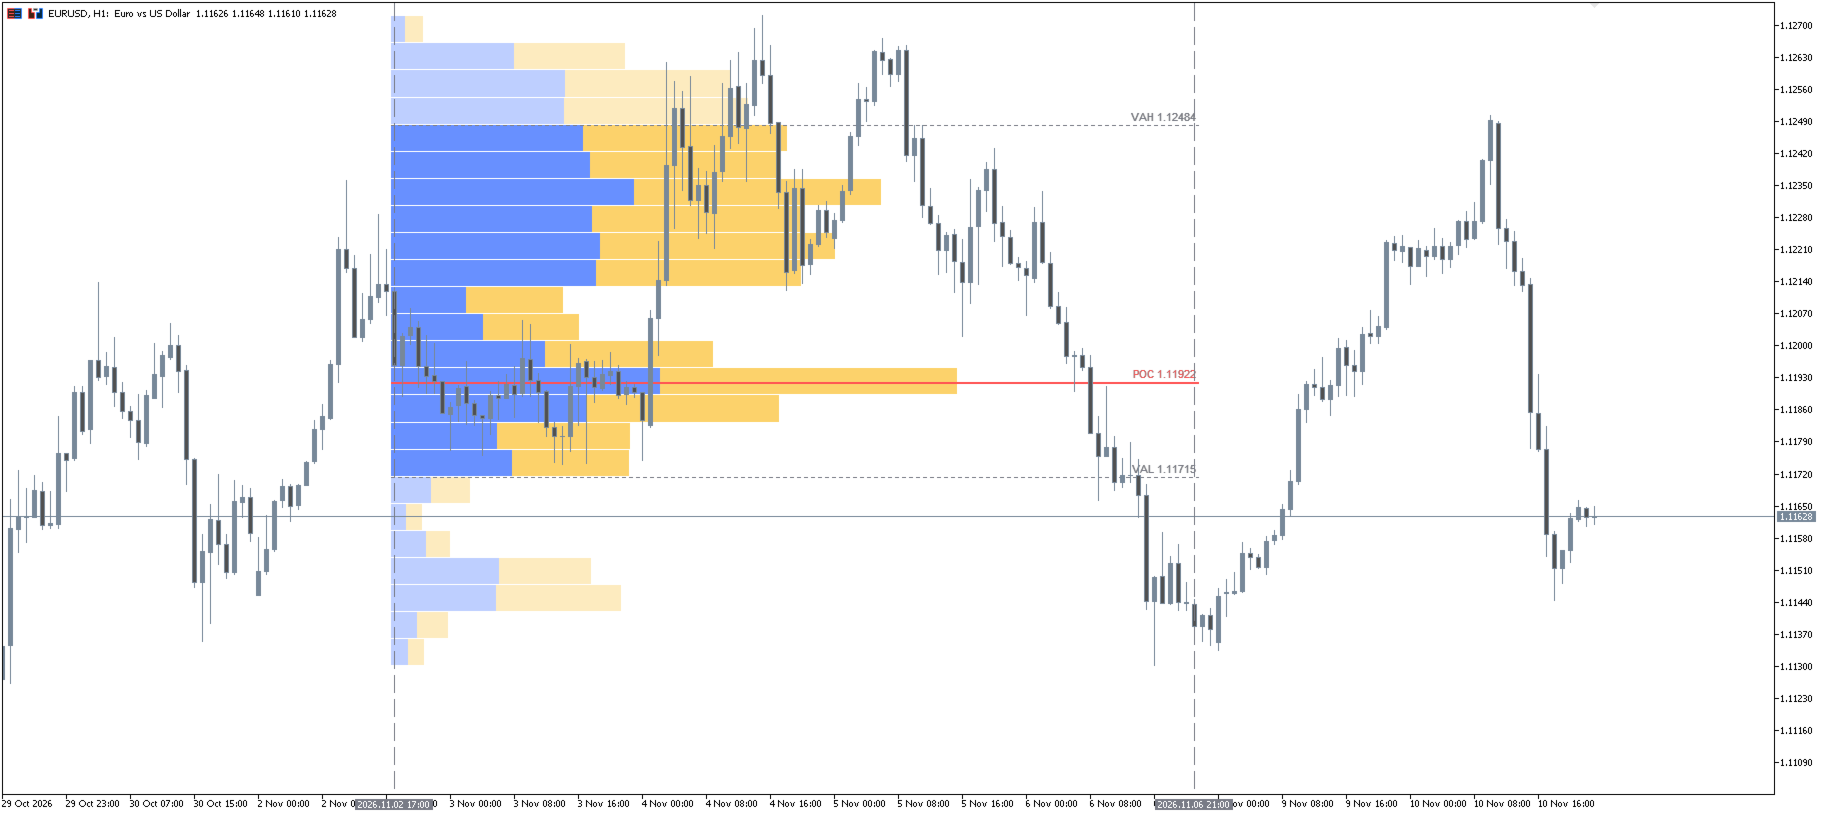
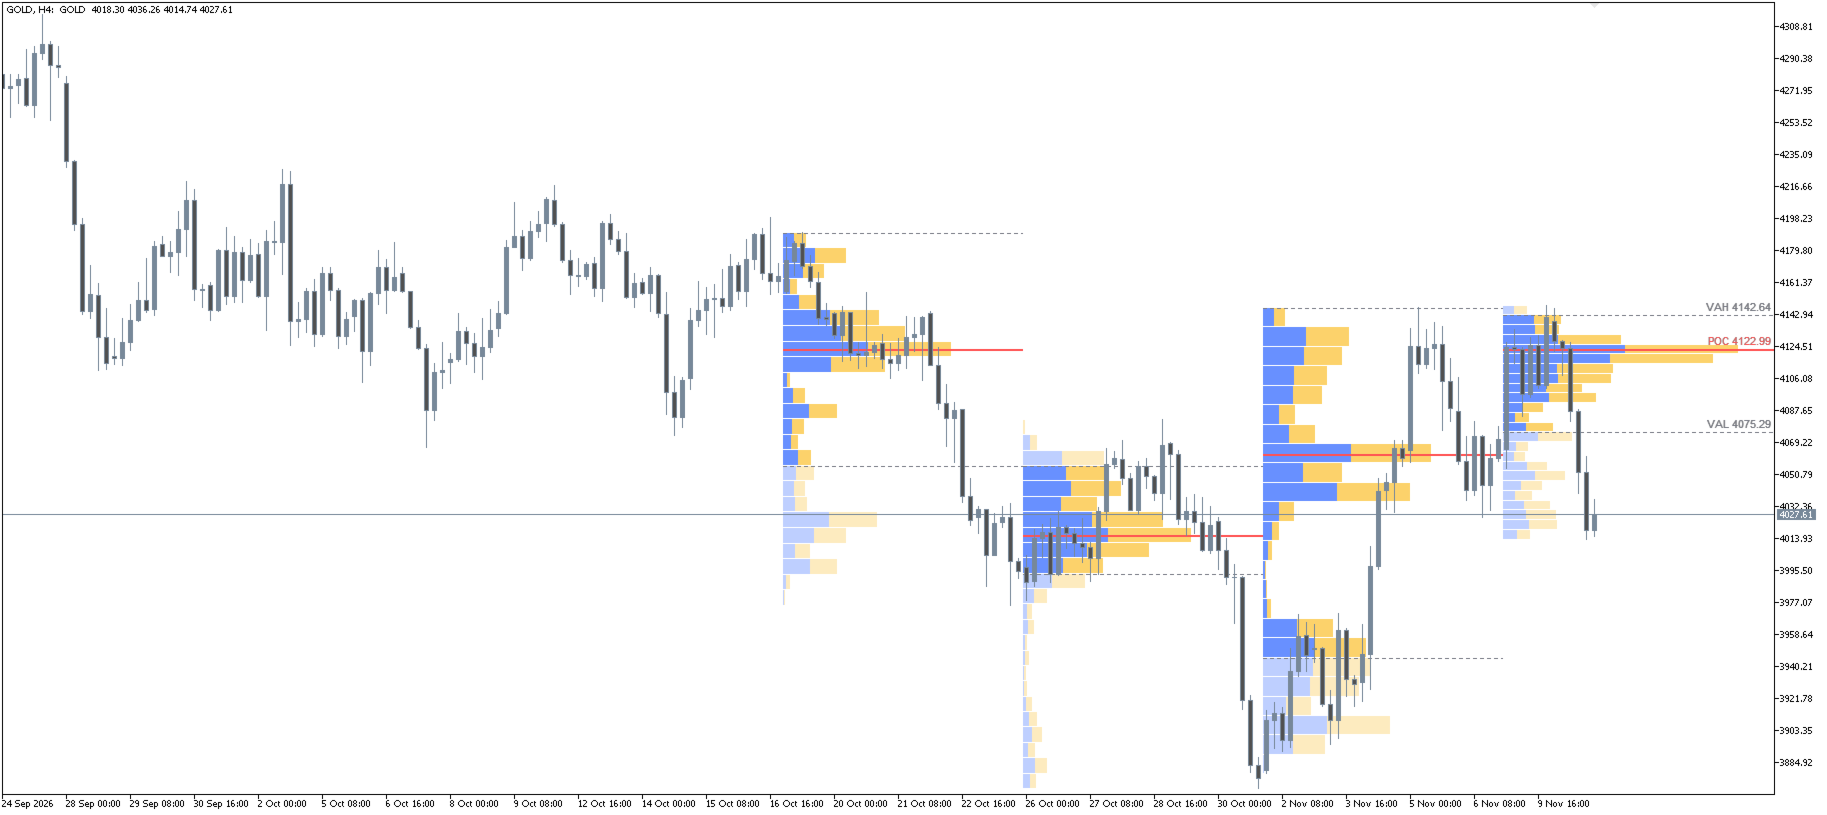
Volume Profile Session Visible and Fixed Range draws a horizontal volume-by-price histogram on your MetaTrader 5 chart, with the POC (the price row with the most volume) and the value area with its upper and lower edges (VAH and VAL). Three profile types are in one indicator: sessions (day or week), the visible range of the chart, and a fixed range that you set by dragging two vertical lines.
It is a display tool. It does not trade, gives no buy or sell signals and does not predict prices. POC, VAH and VAL show where volume was recorded in the past; they are not guaranteed to act as support or resistance.
FEATURES
- Session profiles: one profile per day or per week (weeks start on Monday). Sessions are cut at your broker's server midnight; the start can be moved by -23 to +23 hours. 1 to 200 sessions (5 by default).
- Visible range: one profile of the bars you see on the chart, rebuilt shortly after you scroll or zoom. Placed at the right or left edge, width in % of the chart.
- Fixed range: one profile between two dashed vertical lines. Drag the lines and the profile follows. A deleted line is drawn again. Start and end times can also be set in the inputs.
- POC line, VAH and VAL lines (dashed), price labels on the latest profile, optional extension of the lines to the right edge of the chart.
- Value area 70% by default (1 to 100%). Rows inside the value area are drawn more opaque than rows outside it.
- Optional up/down split of each row in two colors (an estimate, see below).
- Row size: a number of rows (24 by default, 2 to 1000) or a fixed number of points per row (if that would make more than 2,000 rows, the row size is doubled automatically).
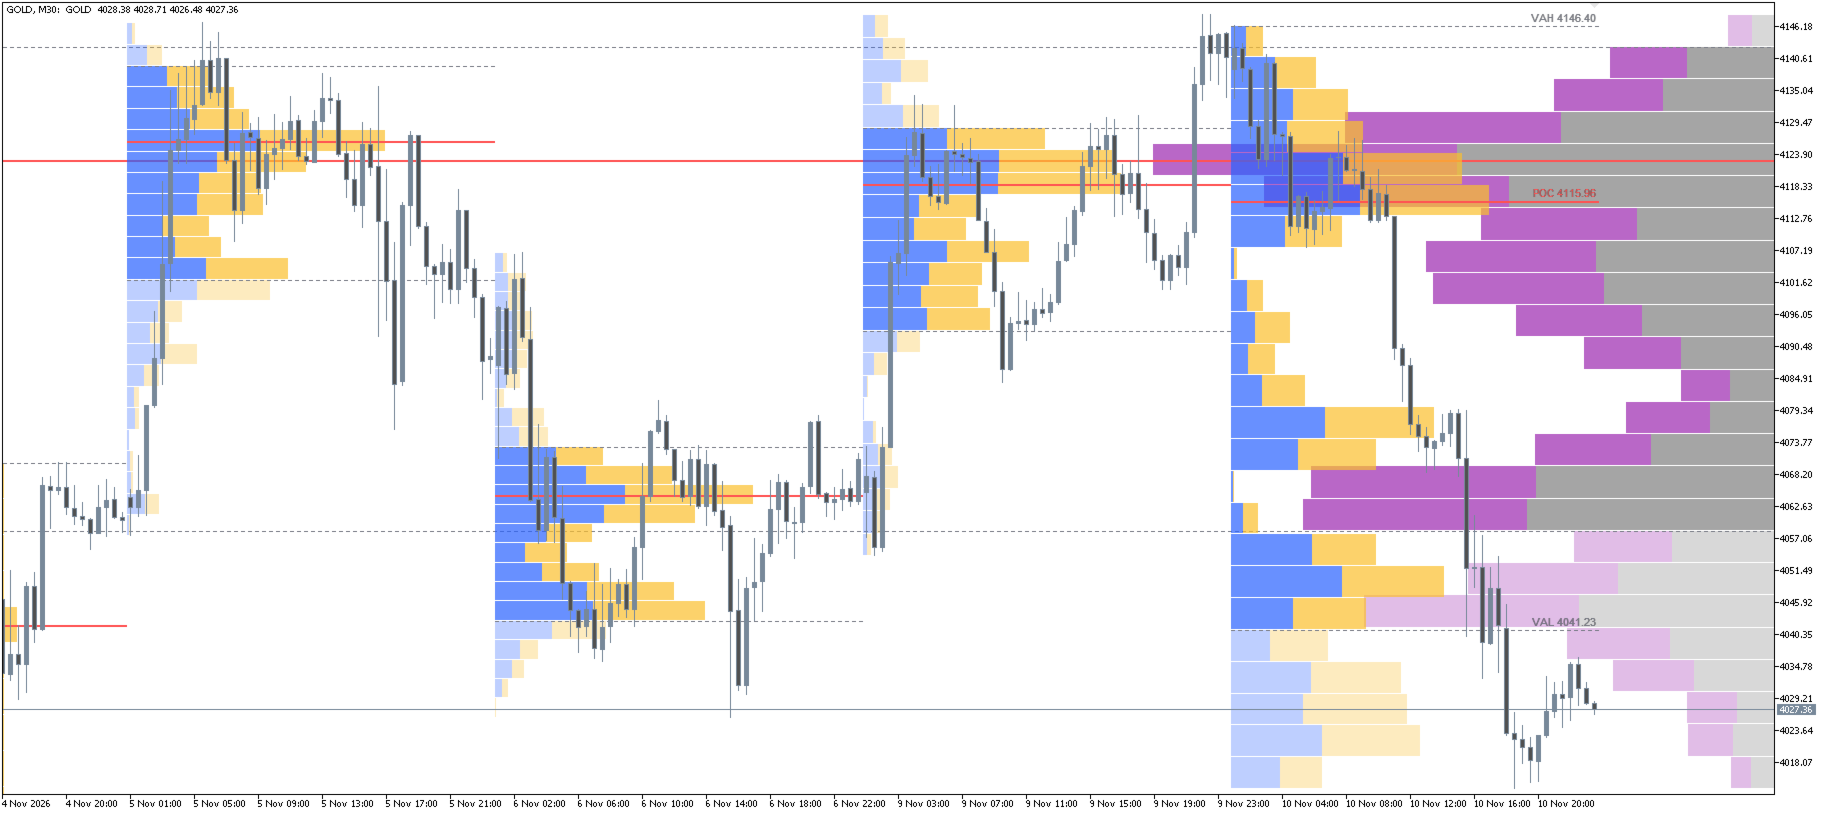
- Drawn as a semi-transparent picture behind the price bars. Two Volume Profiles on one chart, for example a session profile and a visible range profile, overlap without the colors cancelling each other out.
- Status text while profiles are being built (for example "building... 3/5").
- English or Japanese, chosen automatically from the terminal language.
HOW IT IS CALCULATED
- Volume source: tick volume, or real (exchange) volume where your broker provides it. Auto (default) uses real volume when the symbol's bars contain it. Most Forex and CFD symbols have tick volume only; it counts price updates, not traded lots.
- Build from M1 bars (default, fast): the volume of each M1 bar is spread evenly over the price range from its low to its high. The real movement inside each minute is not known, so the result can differ from a profile built from ticks.
- Build from ticks (more accurate, heavier): every tick is placed at its own price and counts as 1 (tick volume) or with its traded volume (real volume). Ranges longer than the tick limit (14 days by default, adjustable up to 60) are built from bars. Ticks are downloaded from your broker, so the first build can take some time.
- When a range built from bars would need more than about 200,000 M1 bars (adjustable), M5, M15, M30, H1, H4 or D1 bars are used. Coarser bars give a coarser profile.
- Up/down split (estimate): from bars, a bar that closes above its open counts as up volume and one that closes below its open as down volume (an unchanged bar is compared with the previous close, otherwise split half and half). From ticks, a tick above the previous price counts as up and below it as down. This is not real buy and sell volume; MetaTrader does not report which side started a trade.
- POC = the row with the most volume. If several rows have the same volume, the row nearest the middle of the profile is used. The POC price is the middle of that row.
- Value area: starting from the POC, the next row above and the next row below are compared, and the larger one is added (both when they are equal), one row at a time, until the chosen percentage of the total volume is reached. VAH is the top of the highest row in the value area and VAL is the bottom of the lowest row.
HOW WE CHECKED IT
- In 8 test cases (sessions, visible range, fixed range, bars and ticks), POC, VAH, VAL and the volume of every row matched our own independent calculation with no difference.
- For one EURUSD day we compared the session profile with TradingView's volume profile (OANDA data): POC, VAH and VAL differed by about 1 pip and the shapes were similar (correlation 0.906). Different data sources have different prices and tick counts, so the profiles are not identical.
ALERTS (OFF BY DEFAULT)
- Alert when the price crosses the POC, VAH or VAL (each can be switched on or off). Pop-up, sound and push notification.
- At most one alert per level per bar.
- In session mode you choose the levels of the previous (completed) session or of the current (developing) session. The levels of the current session move while the session is forming, so this choice gives more alerts. In visible range mode the levels change when you scroll; in fixed range mode, when you move the lines.
- The first price after loading or after a new session only sets the starting point and never alerts.
- An alert only reports that the price reached a level. It is not a signal to buy or sell.
- No alerts in the Strategy Tester or when the indicator is loaded through iCustom.
FOR EA AND iCUSTOM USERS
- 3 buffers (not drawn): 0 = POC, 1 = VAH, 2 = VAL. Each bar holds the levels of the profile that contains that bar; EMPTY_VALUE where there is no profile. The values of a profile that is still forming (the current session, the visible range, a fixed range that reaches the latest bar) change as new data arrives. A completed session no longer changes.
- iCustom parameters: the 40 inputs in the order of the input dialog, with an empty string "" for each of the 5 group headers (45 parameters). You can also pass no parameters to use the defaults.
- When it is loaded through iCustom (from an EA, a script or another indicator) it draws nothing and raises no alerts; it only calculates the buffers.
- Without a chart (iCustom, Strategy Tester without visual mode) the visible range is the latest 100 bars (input "bars back"), and the fixed range uses the start and end time inputs (0 = the latest 100 bars).
NOTES AND LIMITS
- Session boundaries use your broker's server time, so brokers in different time zones give different daily profiles. TradingView uses its own session times, so its days can start some hours earlier or later; you can use the session start shift to line them up.
- Week sessions start on Monday. Sunday bars (for example crypto symbols that trade every day) belong to the week before.
- On a W1 chart with week sessions, and on a D1 chart with day sessions, each bar is one profile (W1: Sunday 00:00 to the next Sunday; D1: server time 00:00 to 24:00). In this case the session start shift is not used.
- If the chart timeframe is longer than the session (for example day sessions on a W1 chart), no profile is drawn and a message is shown.
- You can use two or more Volume Profiles in fixed range mode on one chart. Each keeps its own pair of lines; the lines are not swapped when you load a template or change the timeframe.
- If you delete a fixed range line, it is drawn again. In rare cases it is drawn again at a default position (40 bars back); then drag it to where you want it.
- The profile is a picture, not chart objects, so single rows cannot be selected. The terminal's "Save as picture" command can place the picture at a wrong position; use a normal screen capture instead.
- Many sessions built from ticks need a lot of tick data and memory. Start with a few sessions.
- No DLLs, no external files, no internet connection.
- A charting aid only. It does not trade and does not guarantee any trading result.
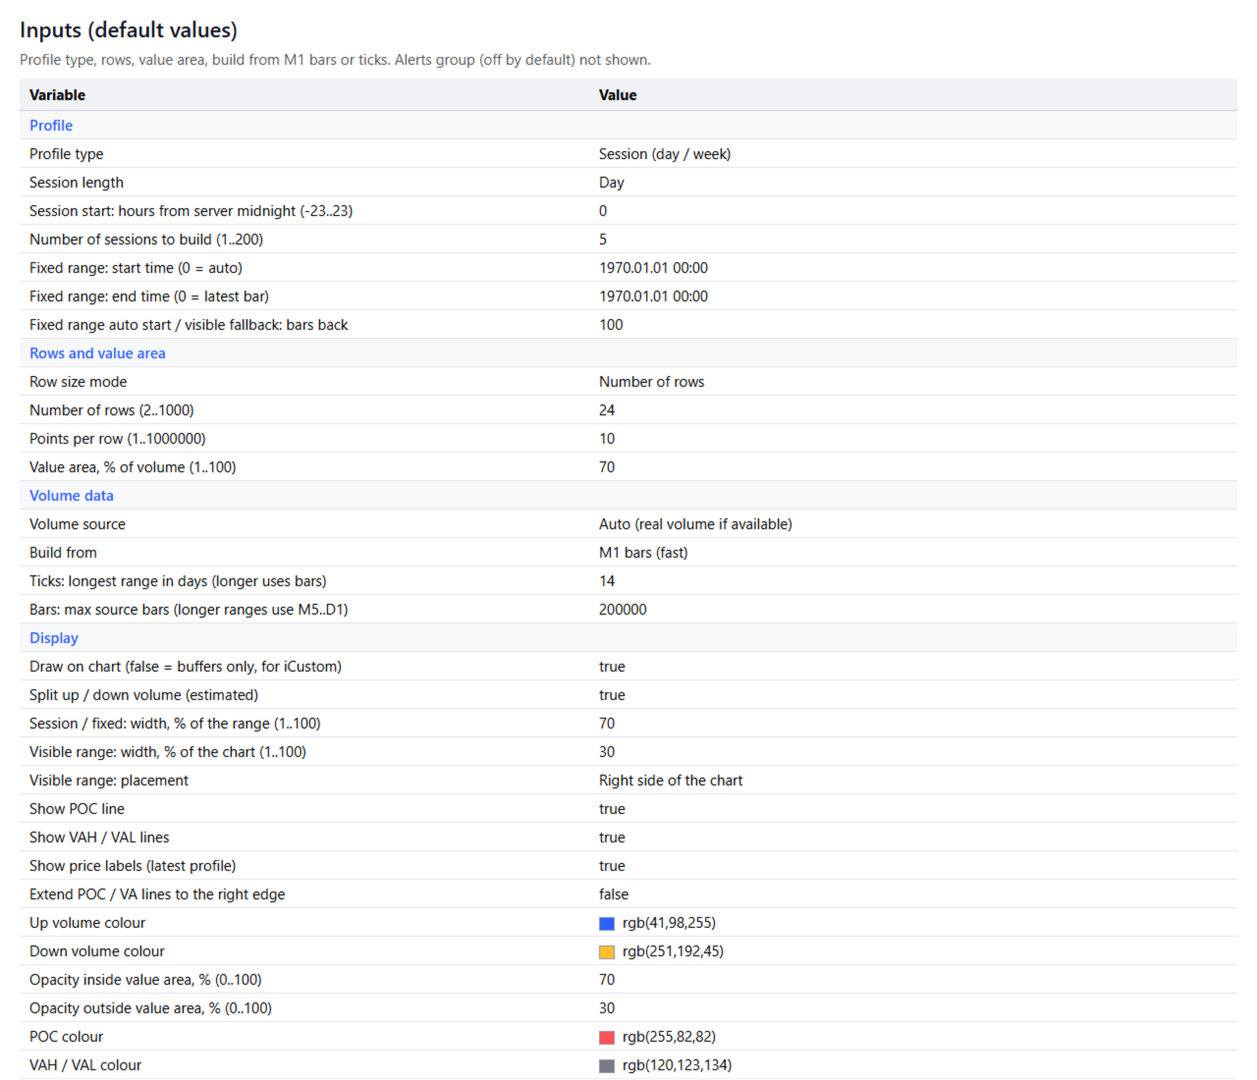
MAIN INPUTS
Profile: Profile type (Session), Session length (Day / Week), Session start shift in hours (0, -23 to 23), Number of sessions (5, 1-200), Fixed range start and end time (0 = automatic), Bars back for the automatic fixed range and for the visible range without a chart (100)
Rows and value area: Row size mode (Number of rows), Number of rows (24), Points per row (10), Value area % (70)
Volume data: Volume source (Auto), Build from (M1 bars / Ticks), Ticks: longest range in days (14, 1-60), Bars: maximum source bars (200,000)
Display: Draw on chart, Up/down split, profile width, visible range width and placement, POC and VA lines, price labels, extend lines, colors, opacity inside and outside the value area, line width, label size
Alerts: Alerts (off), Session mode: levels of (previous session), POC / VAH / VAL, Pop-up, Sound, Push notification
If an input is out of range, the indicator does not load and writes a message to the Experts log.
COMPATIBILITY AND SUPPORT
- MetaTrader 5, any symbol. Session profiles need a chart timeframe that is not longer than the session.
- Support through MQL5 messages: installation, settings and bug reports. Questions about market direction or individual trades are outside the support scope.
- Other tools by the same author are listed on my seller profile.
TradingView is a trademark of TradingView, Inc. This product is not affiliated with, sponsored by or endorsed by TradingView, Inc.