Multi Timeframe Fair Value Gap Indicator
- Indicators
- Version: 1.50
- Activations: 5

Adjustable Fair Value Gap – Multi-Timeframe FVG Indicator for MetaTrader 5
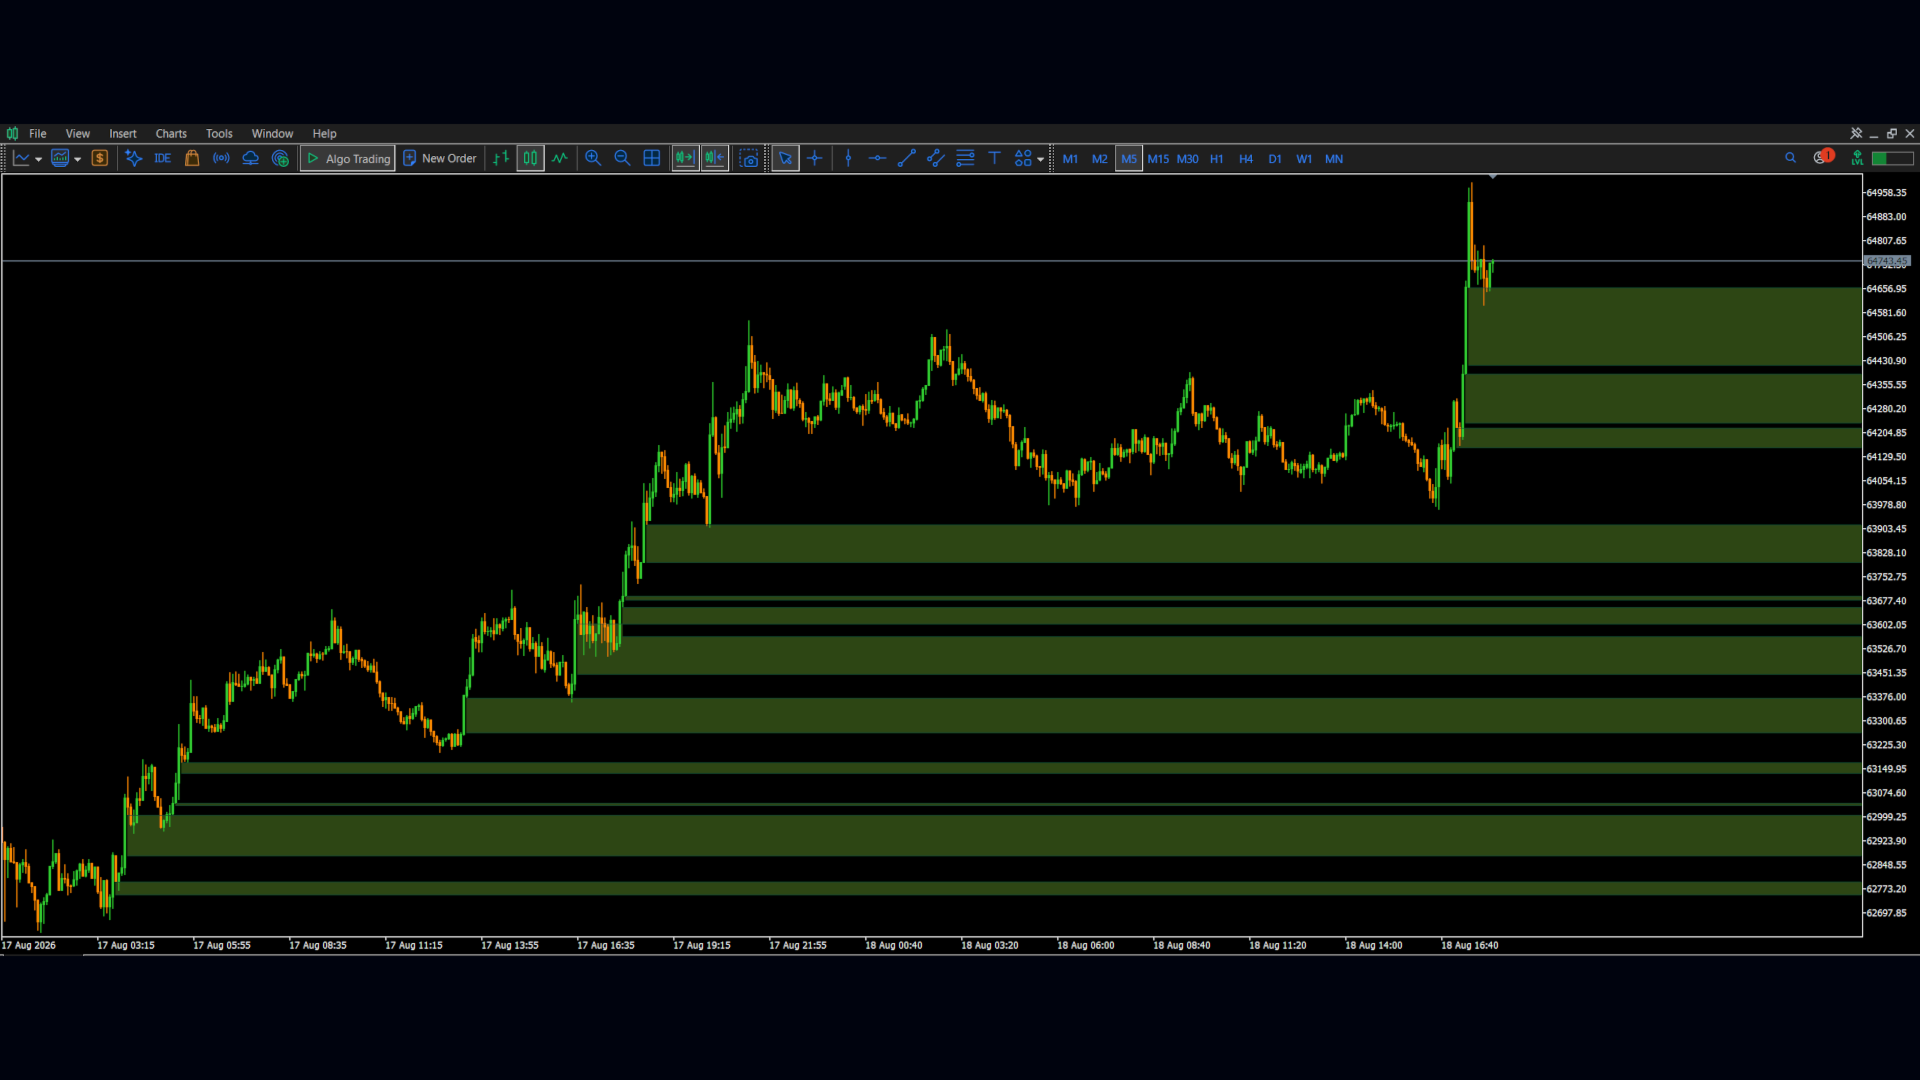
The Adjustable Fair Value Gap indicator automatically detects and displays open Fair Value Gaps on any MetaTrader 5 chart.
The indicator uses the classic three-candle FVG structure and allows the analysis timeframe to be selected independently from the current chart timeframe. For example, you can display H1 Fair Value Gaps on an M5, M15, H1, or H4 chart without changing the chart itself.
Only currently open Fair Value Gaps remain visible. Once price completely fills a gap, its boundary lines and shaded area are automatically removed from the chart.
Key Features
• Automatic bullish and bearish Fair Value Gap detection
• Adjustable FVG calculation timeframe
• Works on any chart timeframe
• Multi-timeframe functionality
• Uses completed candles to confirm new FVGs
• Displays upper and lower FVG boundaries
• Extends FVG levels to the right of the current candle
• Optional shaded area between the boundaries
• Automatically removes completely filled FVGs
• Separate colors for bullish and bearish gaps
• Adjustable line style and width
• Adjustable zone transparency
• Optional background drawing
• Adjustable historical scanning range
• No external indicators or libraries required
Fair Value Gap Detection
The indicator uses a three-candle formation.
Bullish Fair Value Gap
A bullish FVG is detected when the low of the third candle is above the high of the first candle.
The gap boundaries are:
• Upper boundary: Low of the third candle
• Lower boundary: High of the first candle
A bullish FVG remains visible until a later candle reaches or falls below the lower boundary. The candle wick is sufficient to count as a complete fill.
Bearish Fair Value Gap
A bearish FVG is detected when the high of the third candle is below the low of the first candle.
The gap boundaries are:
• Upper boundary: Low of the first candle
• Lower boundary: High of the third candle
A bearish FVG remains visible until a later candle reaches or rises above the upper boundary. The candle wick is sufficient to count as a complete fill.
Multi-Timeframe Operation
The FVG calculation timeframe is independent of the timeframe of the chart.
Examples:
• Display H1 FVGs on an M5 chart
• Display H4 FVGs on an M15 chart
• Display M15 FVGs on an H1 chart
• Display Daily FVGs on an intraday chart
The selected timeframe determines:
• Which candles are used for FVG detection
• The upper and lower gap boundaries
• Whether an existing FVG has been completely filled
Changing the chart timeframe does not change the selected FVG calculation timeframe.
Indicator Inputs
FVGTimeframe
Selects the timeframe used to calculate Fair Value Gaps. The default setting is H1.
MaxBarsToScan
Defines how many historical candles from the selected FVG timeframe are analyzed. A larger value can identify older open gaps but may require more processing.
ShowBullishFVGs
Enables or disables bullish Fair Value Gaps.
ShowBearishFVGs
Enables or disables bearish Fair Value Gaps.
BullishFVGColor
Defines the color used for bullish FVG boundary lines and filled zones. The default is dark green.
BearishFVGColor
Defines the color used for bearish FVG boundary lines and filled zones. The default is dark red.
LineStyle
Selects the style of the upper and lower boundary lines.
LineWidth
Controls the width of the FVG boundary lines.
FillFVGZones
Enables or disables the shaded area between the upper and lower FVG boundaries.
FillTransparency
Controls the transparency of the shaded FVG zones.
• 0 = fully opaque
• 100 = completely transparent
DrawZonesInBackground
When enabled, the filled FVG zones are drawn behind the price candles.
How the Indicator Handles Open FVGs
New Fair Value Gaps are confirmed using completed candles. This prevents an unfinished third candle from creating a temporary FVG signal.
After confirmation, the indicator continuously monitors newer candles, including the currently forming candle, to determine whether the gap has been completely filled.
A partial entry into the gap does not remove it. The FVG remains visible until price reaches the opposite boundary.
When an FVG is completely filled:
• The upper boundary line is removed
• The lower boundary line is removed
• The shaded zone is removed
This keeps the chart focused on currently relevant and unfilled Fair Value Gaps.
Installation
-
Copy the indicator file into the MetaTrader 5 MQL5/Indicators folder.
-
Open MetaEditor.
-
Compile the indicator.
-
Return to MetaTrader 5.
-
Refresh the Navigator window if necessary.
-
Attach the indicator to any chart.
-
Select the desired FVG timeframe in the input settings.
Suggested Uses
The indicator can be used to identify potential:
• Price imbalance zones
• Retracement areas
• Support and resistance regions
• Continuation setups
• Reversal areas
• Trade-entry zones
• Stop-loss reference areas
• Take-profit targets
• Higher-timeframe points of interest
Important Information
Fair Value Gaps do not guarantee that price will return to the zone or react when it reaches the zone. They should be combined with appropriate market structure, trend analysis, liquidity concepts, risk management, and additional confirmation.
The indicator does not open, manage, or close trades. It is a visual analysis tool and does not provide financial advice.