Charts247 Market Structure Sessions

Charts247 Market Structure Sessions

The full Charts247 market structure: swings, CHoCH and BOS, intraday highs and lows by session, structure trend, session read, zigzag counter, break count, alerts and a control panel. Closed candles only.

Charts247 Market Structure Sessions shows market structure the way the Waves of Success method reads it, and places each intraday high and low in the session where it printed. Everything is calculated on closed candles; nothing on history is redrawn.
What it shows
• Swing highs and lows confirmed a set number of candles after they print (4 by default), labelled HH, HL, LH or LL against the previous one. They never move afterwards.
• CHoCH and BOS on the close through the last swing, with a dotted line from the swing to the breaking candle.
• Intraday highs and lows (1-2-3). After a CHoCH, the first BOS the same way confirms the extreme before the CHoCH as an intraday high or low. Each line runs right until a candle closes through it, then stays as a dotted line. Up to 20 recent lines are kept (an input).
• Sessions. Each intraday line is coloured and named by its session, for example iHH LONDON or iLL ASIA. Session hours are entered in London time and converted from your broker's clock.
• Session read. At the start of a session the panel shows how the previous session closed (up or down). After that, a close above the previous or current session's latest intraday high reads BUY favoured; a close below its intraday low reads SELL favoured. The latest break decides.
• Structure trend. UP after two intraday higher highs and one higher low in a row, DOWN after two lower lows and one lower high, held until the other side is confirmed, PULLBACK while the latest run points the other way. Optional background shading from the candle where the trend was confirmed.
• Zigzag and counter. A zigzag through the swings, with higher highs numbered HH1, HH2 and so on and lower lows LL1, LL2. The HH count restarts at LL2 and the LL count at HH2.
• Break count. When a wick takes out a swing high or low, that candle is numbered 1 and each new high (or low) after it 2, 3 and onwards, so you can see how far a move has run since the level was taken.
Control panel
A compact panel shows the structure trend, the session read and the last break with how many candles ago it happened. Seven buttons switch the layers on and off: swings, CHoCH and BOS, 1-2-3, session colours and names, zigzag, break count and trend shading. Settings are kept per symbol, and the panel can be minimised.
Alerts
Pop-up, phone notification or both, set separately for CHoCH, BOS, a change of structure trend and a change of session read. Alerts fire once, on the close of the candle; none fire for history when the indicator loads.
Inputs
• Structure: swing strength, candles analysed, candles drawn, copy number.
• Swing labels, CHoCH and BOS, intraday lines: on or off, colours, font, sizes, gaps, line width, label position, number of lines kept.
• Structure trend: the higher-high and higher-low counts, colours.
• Sessions: colour lines by session, session names on the lines (full or short), broker clock (New York close GMT+2/+3, or a fixed offset), the three session start hours in London time, session colours.
• Zigzag and counter, break count, trend shading: on or off, colours, sizes, candles shown.
• Alerts: one setting per alert type.
• Control panel: corner, position, width.
Notes
• Works on any symbol and timeframe; sessions matter most on intraday charts (M5 to H1).
• Set the broker clock once. Most brokers use the New York close clock (server midnight = 22:00 London in winter); if your broker's clock differs, choose a fixed offset.
• No DLLs and no files written.
• Charts247 Market Structure Essentials, at no charge, shows the swings, CHoCH and BOS, the live intraday pair and the trend.
Recommended products
Introduction to Fractal Pattern Scanner Fractal Indicator refers to the technical indicator that makes use of the fractal geometry found in the financial market. Fractal Pattern Scanner is the advanced Fractal Indicator that brings the latest trading technology after the extensive research and development work in the fractal geometry in the financial market. The most important feature in Fractal Pattern Scanner is the ability to measure the turning point probability as well as the trend probabi
Introduction to Harmonic Volatility Indicator Harmonic Volatility Indicator is the first technical analysis applying the Fibonacci analysis to the financial volatility. Harmonic volatility indicator is another level of price action trading tool, which combines robust Fibonacci ratios (0.618, 0.382, etc.) with volatility. Originally, Harmonic Volatility Indicator was developed to overcome the limitation and the weakness of Gann’s Angle, also known as Gann’s Fan. We have demonstrated that Harmonic
Currency Strength Oscillator MT4
Narayanan Mohanan Mohanan Krishnan
Currency Strength Oscillator for MetaTrader 4 A relative currency strength indicator that plots the history of the eight majors. This currency strength oscillator plots the relative strength of the eight major currencies as a history, decomposed from the 28 major pairs. While a standard currency strength meter tells you where things stand right now, this shows how they got there — which currency has been strengthening, which has rolled over, and where the ranking changed hands. All eight series
Download user manual from : https://ontrd.com/our-books/ MT5 Version : https://www.mql5.com/en/market/product/30284 Gann Squares Indicator: Analyzing Markets with Geometric Patterns The Gann Squares indicator is a powerful tool for market analysis that draws upon the mathematical concepts introduced by W.D. Gann in his article on "Mathematical Formula for Market Predictions." This indicator incorporates Gann's techniques involving square numbers such as 144, 90, and 52, as well as the Square of
Introduction This indicator detects volume spread patterns for buy and sell opportunity. The patterns include demand and supply patterns. You might use each pattern for trading. However, these patterns are best used to detect the demand zone (=accumulation area) and supply zone (=distribution area). Demand pattern indicates generally potential buying opportunity. Supply pattern indicates generally potential selling opportunity. These are the underlying patterns rather than direct price action. T
RSI bands indicator is a mt4 indicator that shows various levels to enter trades based on market conditions. It consists of the below buffers; Yellow buffer Blue buffer White buffer When the yellow buffer is above blue buffer the market is trending up good place to open buy order. When the blue buffer is above yellow buffer the market is trending downwards good time to place sell order. Also another alternative scenario is when yellow buffer is above upper white band buffer indicates strong uptr
This indicator is an indicator for automatic wave analysis that is perfect for practical trading! Case... Note:   I am not used to the Western name for wave classification. Influenced by the naming habit of Chaos Theory (Chanzhongshuochan), I named the basic wave as   pen   , the secondary wave band as   segment   , and the segment with trend direction   as main trend segment   (this naming method will be used in future notes, let me tell you in advance), but the algorithm is not closely relate
Introduction to Chart Pattern MT Chart Pattern MT is a chart pattern scanner to detect the triangle pattern, falling wedge pattern, rising wedge pattern, channel pattern and so on. Chart Pattern MT uses highly sophisticated chart pattern detection algorithm. However, we have designed it in the easy to use with intuitive user interface. Chart Pattern MT will show all the patterns in your chart in the most efficient format for your trading. You do not have to do tedious manual pattern detection an
My indicator is 1000%, it never repaints, it works in every time period, there is only 1 variable, it sends notifications to your phone even if you are on vacation instead of at work, in a meeting, and there is also a robot version of this indicator With a single indicator you can get rid of indicator garbage It is especially suitable for scalping in the m1 and m5 time frames on the gold chart, and you can see long trends in the h1 time frame.
The indicator shows the Buy/Sell direction. The calculations use the opening prices and their rate of change for the billing period - "Calculation period" MTF indicator - "Calculation timeframe", no repaint - NRP. Two display types: "Chart default" или "Chart color" For "Chart color" color customization available : "Bar color" Two types stop levels: "Simple stop level" or "Dynamic stop level " Color settings: "Stop level color" Alerts available: "Chart message", "Push message", "Email message" F
Market Profile
Artem Titarenko
5 (1)
The "Market Profile" indicator displays the profiles and volumes of periods – weekly, daily, session (8-hour), 4-hour, hour, summary. The VAH/VAL price area is automatically highlighted by a dotted line for each profile (except for the summary). The indicator includes chroma Delta, which colors the profile areas. The areas of prevailing Buys is colored in green, that of Sells - in red. The intensity histogram features blue/red respectively. In the filter mode, the indicator displays the volume a
Blogs : https://www.mql5.com/en/blogs/post/768816 MT4 Version https://www.mql5.com/en/market/product/139061 MT5 Version https://www.mql5.com/en/market/product/139062 Problem Monitoring multiple symbols and timeframes at the same time is slow, repetitive, and mentally exhausting. Most traders waste time switching charts one by one, only to realize the move has already happened. By the time a clear trend change is visible, the opportunity is often late or missed. Solution Scanner HalfTrend [ta
The indicator calculates support and resistance levels. There is a hint in the upper left corner. This hint can be removed. Hint in two languages (English and Russian). The width of support and resistance levels is shown. The number of levels touched is displayed. Works on all timeframes. Can be used as an independent trading system, and as an addition to another system. Download the demo version of the indicator right now and try it in the strategy tester!
Smart Pivot Points for MetaTrader 4 — Clear Levels for Smart Trading Smart Pivot Points is a professional indicator for MetaTrader 4 that automatically calculates and displays a full set of key trading levels on the chart. It transforms the chaos of price action into a clear structured map, highlighting support, resistance, price balance, and potential target zones. Designed for traders who value clarity, the tool works in any market: Forex, cryptocurrencies (Bitcoin, Ethereum), stock indices,
ArchIntel Pivot Point
Raphael Adetunji Olaiyapo
This tool draws all the pivot point lines on chart. It is important to remind/tell you that there are 5 pivot method according to BabyPips website. All these methods have their unique mathematical formula. 1. Floor Method. 2. Woodie Method. 3. Camarilla Method. 4. DeMark Method. 5. Fibonacci Method. What makes this pivot tool unique is that you can click the "Fibonacci" button to select the pivot method you want. You can click the "Monthly" button to select the Period you want to use for the piv
ABCD Harmonic Patterns
Mehmet Ozhan Hastaoglu
Thanks to this indicator, you can easily see the new ABCD harmonic patterns in the chart. If the two price action lengths are equal, the system will give you a signal when it reaches the specified level. You can set the limits as you wish. For example, You can get the signal of the price, which occurs in the Fibonaci 38.2 and 88.6 retracements, and then moves for the same length, at the level you specify. For example, it will alarm you when the price reaches 80% as a percentage. In vertical
MetaForecast M4
Vahidreza Heidar Gholami
5 (2)
MetaForecast predicts and visualizes the future of any market based on the harmonics in price data. While the market is not always predictable, if there is a pattern in the price, MetaForecast can predict the future as accurately as possible. Compared to other similar products, Metaforecast can generate more accurate results by analyzing market trends. Input Parameters Past size Specifies the number of bars that MetaForecast uses to create a model for generating future predictions. The model is
BeST_Gann Swing Oscillator is an MT4 indicator that is based on the corresponding work of Robert Krausz who introduced it in the book “ A.W.D Gann Treasure Discovered ” . The Gann Swing Oscillator is a range-bounding technical indicator that oscillates between +1 and -1 and thus it describes the market swings. Generally when the market is in an upswing, the Gann Swing Oscillator describes it as 2 higher highs with the value of +1 while after an upswing, the downswing is expected. Also the downs
ENTRY AND EXIT ARROWS Indicator – Description The Entry and Exit Arrows indicator is a simple yet effective momentum-based tool designed to highlight potential buy and sell opportunities directly on the chart using visual arrows. It works by comparing two internal momentum measurements with different sensitivities. When both measurements align in the same direction, the indicator confirms a stronger directional bias and plots a signal. How It Works Buy Signal (Lime Arrow Below Candle): Appea
Cupid Signal Fx
Damrongwit Kongtong
The principle of this indicator is very simple: detecting the return point with Stochastic Oscillator, then monitoring the trend by using the Moving Average and finally predicting BUY and SELL signal with arrows, alerts and notifications. The parameters are fixed and automatically calculated on each timeframe. Example: If you install indicator on EURUSD, the indicator will detect the return point when the Stochastic Oscillator show "cross up" of the main line/signal line at the below position of
Snake NW
Sergei Shishaev
5 (1)
Канальный индикатор "Snake" . Отлично показывает точки входа и выхода. Не перерисовывает! Хорошо подойдет для стратегий с сетками (усреднения), стратегий с пирамидами (стратегий добора), обычной торговли по тренду, торговли на коррекции. Для любых типов инструментов:   валюты, нефть, металлы, криптовалюты. Для любых таймфреймов:   от M1 до D1 . Для любых стилей торговли:   скальпинг, интрадэй, свинг, долгосрок . Используйте в сочетании с трендовым индикатором, чтобы исключить риски входа про
- Real price is 80$ - 50% Discount (It is 39$ now)   Contact me for instruction, add group and any questions! - New Update: 2026/10 - Non-repaint - I just sell my products in Elif Kaya profile, any other websites are stolen old versions, So no any new updates or support. - Lifetime update free Related product:   Bitcoin Expert Introduction The breakout and retest strategy is traded support and resistance levels. it involves price breaking through a previous level.  The break and retest strateg
Introduction to Sideways Market Analyzer Notable period of Low volatility and non-trending movements in the financial market is considered as Sideways Market. Sooner or later, the low volatility will increase and the price will pick up a trend after Sideways Market. In terms of trading point of view, Sideways Market can serve as the very good entry timing for traders. Sideways Market is also quite often the representation of accumulation of large orders from big investors. Therefore, knowing the
Range bound is a mt4 indicator that shows various levels to enter the market. It uses MACD as the primary reference indicator. When MACD oscillator is showing buy or sell signals these are displayed on your trading dashboard but as levels to buy or sell on the main chart. The indicator shows blue signals and red signals That are support and resistance levels. In short this indicator shows ranges where your trades should be safe from market changes against your order.
Daily Trend Confluence Scanner Pro
Anthony Chukwujekwu Okparaeke
Daily Trend Confluence Scanner Daily Trend Confluence Scanner is a systematic multi-indicator trend-following tool designed to spot high-probability trade setups while filtering out market noise.   By evaluating market conditions strictly on completed daily candle closes (shift = 1), this indicator provides reliable, non-repainting signals based on four layers of technical confirmation.   Key Features 100% Non-Repainting: All calculations freeze upon daily candle close (shift = 1), eliminating
YY Multi Waves
Yuryi Yatsenko
4 (3)
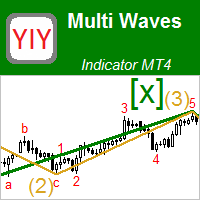
This indicator displays the wave structure of the market in the form several wave levels nested in each other. For each of these levels an automatic preliminary (draft) marking of waves in Elliott's style (123..., ABC... etc.) is created. This markup is completely automatic and absolutely univocal. The indicator is especially useful for beginner wave analysts, because among all the possible versions for wave marking, it allows you to immediately take the most adequate version as a ba
RelicusRoad Dynamic Circles is a swing high and swing low indicator for MetaTrader 4 and MetaTrader 5 that marks turning points with circles at three lookback lengths at once: 9, 60 and 156 bars. Small turns and large turns sit on the same chart but look different. A short range dot shows a minor swing, while the larger medium and long range rings only appear where price made the extreme of a much longer window. Each circle can carry a short text label such as HH(60) or LL(156). How it works For
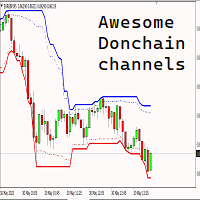
Introducing the Donchian Channels indicator for MQL4, a powerful technical analysis tool designed to boost your trading success. This indicator consists of four lines that represent the upper and lower boundaries of price movement over a specified period. With the Donchian Channels indicator, you can easily identify potential breakouts and reversals in the market. The upper line shows the highest high of the specified period, while the lower line represents the lowest low. The space between thes
Ezy Option Signal
Nirundorn Promphao
The principle of this indicator is very simple: detecting the trend with Moving Average, then monitoring the return point of graph by using the crossing of Stochastic Oscillator and finally predicting BUY and SELL signal with arrows, alerts and notifications. The parameters are fixed and automatically calculated on each time frame. Example: If you install indicator on EURUSD, timeframe M5: the indicator will detect the main trend with the Moving Average on this timeframe (for example the Moving
PZ Harmonacci Patterns
PZ TRADING SLU
3.17 (6)
Trade smarter, not harder: Empower your trading with Harmonacci Patterns This is arguably the most complete harmonic price formation auto-recognition indicator you can find for the MetaTrader Platform. It detects 19 different patterns, takes fibonacci projections as seriously as you do, displays the Potential Reversal Zone (PRZ) and finds suitable stop-loss and take-profit levels. [ Installation Guide | Update Guide | Troubleshooting | FAQ | All Products  ] It detects 19 different harmonic pric
Buyers of this product also purchase
Trend SniperX MT4
Sarvarbek Abduvoxobov
5 (5)
Trend Sniper X is a multi-timeframe trend-following indicator for MetaTrader 5 that helps traders identify trend direction and potential reversal points with clarity and precision. For MT5: https://www.mql5.com/en/market/product/181101 Price Information: The current price is promotional and is subject to change as upcoming updates and new features are released. Code2Profit Channel Master the Market with Multi-Timeframe Analysis! How to Maximize Your Win Rate with Trend Sniper X: Key Rules & Sess
M1 Sniper
Oleg Rodin
4.97 (30)
M1 SNIPER  is an easy to use trading indicator system. It is an arrow indicator which is designed for M1 time frame. The indicator can be used as a standalone system for scalping on M1 time frame and it can be used as a part of your existing trading system. Though this trading system was designed specifically for short-term trading, it still can be helpful for all traders. This trading system can be used with any forex pair and time frame, though lower time frames are recommended from M1 up to M
PRO Renko System
Oleg Rodin
5 (31)
PRO Renko System is a highly accurate trading system specially designed for trading RENKO charts. The ARROWS and Trend Indicators DO NOT REPAINT! The system effectively neutralizes so called market noise giving you access to accurate reversal signals. The indicator is very easy to use and has only one parameter responsible for signal generation. You can easily adapt the tool to any trading instrument of your choice and the size of the renko bar. I am always ready to provide extra support to help
Currency Strength Wizard is a very powerful indicator that provides you with all-in-one solution for successful trading. The indicator calculates the power of this or that forex pair using the data of all currencies on multiple time frames. This data is represented in a form of easy to use currency index and currency power lines which you can use to see the power of this or that currency. All you need is attach the indicator to the chart you want to trade and the indicator will show you real str
Atomic Analyst
Issam Kassas
5 (14)
Atomic Analyst — MetaTrader 4 For product questions, setup guidance, or technical support, message me directly here on MQL5. The indicator turns complex market calculations into simple visual signals, color-coded candles, trend readings, stop-loss levels, and multiple take-profit zones that traders can understand quickly and use in real market conditions. Main Trading Uses: Scalping and intraday trading: Designed for fast decision-making, clear arrows, alerts, candle colors, and structured entry
Smart Trend Trading System is a chart indicator for MetaTrader 4 that brings trend information, entry and exit signals, and price levels into one workspace. It combines 10+ trading tools into one system, including trend detection, reversal zones, smart cloud, trailing stop logic, support and resistance, candle coloring, alerts, and multi-timeframe analysis. The system is designed to help you trade different market conditions: Trending markets: Identify the main trend, detect pullbacks, follow mo
Scalper Vault
Oleg Rodin
5 (40)
Scalper Vault is a powerful, fully-equipped trading system designed for traders who want to achieve consistency in intraday trading . This high-precision indicator serves as a complete, standalone trading system that delivers institutional-grade analysis for both Forex and Binary Options traders. PLEASE CONTACT ME AFTER PURCHASE TO GET MY TRADING TIPS PLUS A GREAT BONUS! By eliminating the guesswork and complex manual analysis, Scalper Vault allows you to focus purely on execution using easy t
Neuro Poseidon MT4
Daria Rezueva
4.74 (46)
Neuro Poseidon is a new indicator by Daria Rezueva. It combines precise trading signals with adaptive TP/SL levels - creating best possible trades as a result! Message me and get  Neuro Poseidon Assistant  as a gift to automize your trading process! What makes it stand out? 1. Proven profitability on all assets and timeframes 2. Only confirmed BUY and SELL signals present on the chart 3. Adaptive TP & SL levels generated by the software for each trade 4. Easy to understand - suitable for all
Gann Made Easy
Oleg Rodin
4.84 (173)
Gann Made Easy is a professional and easy to use Forex trading system which is based on the best principles of trading using the theory of W.D. Gann. The indicator provides accurate BUY and SELL signals including Stop Loss and Take Profit levels. You can trade even on the go using PUSH notifications. PLEASE CONTACT ME AFTER PURCHASE TO GET TRADING  INSTRUCTIONS   AND GREAT EXTRA INDICATORS  FOR FREE! Probably you already heard about the Gann trading methods before. Usually the Gann theory is a
Liquidity Scalper System: a liquidity-based trading system in indicator form. Most indicators only show an arrow, and the trader then has to decide where the stop goes, where the target is and whether the signal can be trusted at all. Liquidity Scalper System covers the full trade cycle: it finds liquidity pools, gives a signal when they are broken, immediately calculates Entry, Stop Loss and three targets, and shows statistics and out-of-sample test results on the panel. The system picks its o
SR Liquidity
Oleg Rodin
5 (2)
SR Liquidity is a trading indicator designed to reveal the hidden zones where market liquidity concentrates and price reacts most strongly. These special liquidity areas act as powerful support and resistance levels, giving you a clear map of where the market is most likely to reverse. Instead of drawing ordinary Support/Resistance lines, SR Liquidity analyzes real price behavior to detect the zones where buying and selling pressure accumulate. These are actually the pools of liquidity that driv
AW Prime Oscillator
AW Trading Software Limited
5 (1)
A combination of two oscillators. The first one displays the entry points, the second shows the current trend . The indicator can display oscillator signals by arrows in two modes, all fast oscillator signals or signals only in the direction of the current trend. It has a multi-timeframe panel and three types of signal notifications. Benefits: Suitable for day and scalping trading Trend filtering Simple and sensitive setup Multi-timeframe panel Suitable for integration into an advisor. Works on
Top Bottom Tracker is an indicator based on sophisticated algorithms that analyse the market trend and can detect the highs and lows of the trend / MT5 version . The price will progressively increase until it reaches 500$. Next price --> $99 Features No repainting This indicator does not change its values when new data arrives Trading pairs All forex pairs Timeframe     All timeframes Parameters ==== Indicator configuration ==== Configuration parameter // 40 (The higher the value, the
Cycles Predictor Indicator This indicator uses past market cycles to predict future price movements. The indicator scans through past data and considers  combinations  of cycles. When cycles  coincide  at the same future date/time then it is considered a valid future prediction. The predictions are drawn as vertical lines on the right side of the chart in the future. A prediction will often result in type of candle (ex. bull or bear) and/or a reversal point (ex. bottom or top) forming at this ex
Break and Retest Hunter MT4 is a powerful MetaTrader 5 indicator designed to automatically identify support and resistance levels, breakout structures, and potential retest opportunities in real time. Bonus Indicator: After purchasing Break and Retest Hunter , contact me to receive Trade Indicator Assistant EA completely free as a bonus utility. $65 for the next 10 copies . Next price is $120.  Combining adaptive market analysis, clear BUY/SELL signals, Fibonacci-based profit targets, and a pre
GoldRush Trend Arrow Signal V1.6 The GoldRush Trend Arrow Signal indicator V1.6 continues to provide precise, real-time trend analysis tailored for high-speed, short-term scalpers in XAU/USD , but it now has additional features and improved efficiency and reliability. Built specifically for the 1-minute time frame, this tool displays directional arrows for clear entry points, allowing scalpers to navigate volatile market conditions with confidence. The indicator consists of PRIMARY and SECONDARY
ForexTrendMT4
Andriy Sydoruk
5 (1)
ForexTrendMT4 Indicator: A Reliable Tool for Market Tracking The ForexTrendMT4 indicator offers reliable market trend tracking, filtering out sudden fluctuations and market noise. This tool helps identify trends and signals favorable entry points into the market using arrows. It is suitable for both scalping on shorter timeframes and long-term trading strategies. Based on the principles of technical analysis, ForexTrendMT4 takes into account the cyclical nature of the market. Key Features and A
CRT Multi-Timeframe Market Structure & Liquidity Sweep Indicator Non-Repainting | Multi-Asset | MT5 Version Available MT5 Version:   https://www.mql5.com/en/market/product/162075 Full User Guide — explains what each feature does and why:   https://www.mql5.com/en/blogs/post/767525 Quick Start User Guide  — explains how to configure and in what order:  https://www.mql5.com/en/blogs/post/767540 Indicator Overview CRT Ghost Candle HTF Fractal is a complete institutional-grade market structure too
Super Signal – Skyblade Edition Professional No-Repaint / No-Lag Trend Signal System with Exceptional Win Rate | For MT4 / MT5 It works best on lower timeframes, such as 1-minute, 5-minute, and 15-minute charts. Core Features: Super Signal – Skyblade Edition is a smart signal system designed specifically for trend trading. It applies a multi-layered confirmation mechanism to detect only strong, directional moves supported by real momentum. This system does not attempt to predict tops or bottoms
Trading Special –40% OFF Best Solution for any Newbie or Expert Trader! This Indicator is a unique, high quality and affordable trading tool because we have incorporated a number of proprietary features and a new formula. With only ONE chart you can read Currency Strength for 28 Forex pairs! Imagine how your trading will improve because you are able to pinpoint the exact trigger point of a new trend or scalping opportunity? User manual: click here Looking for the MT5 version? Click here: https:/
Volume Orderflow Profile
Suvashish Halder
5 (2)
Introducing Volume Orderflow Profile , a versatile tool designed to help traders visualize and understand the dynamics of buying and selling pressure within a specified lookback period. Perfect for those looking to gain deeper insights into volume-based market behavior! MT5 Version -  https://www.mql5.com/en/market/product/122657 The indicator gathers data on high and low prices, along with buy and sell volumes, over a user-defined period. It calculates the maximum and minimum prices during this
True Direction Oscillator
Muhammad Elbermawi
4.85 (364)
Or (TDO)  which is an index that measures the price rate of change using the principle of " Pure Momentum ". When a security price advances from 10 to 15 then the price rate of change is 150% but when it declines back from 15 to 10 then the price rate of change is 33.3% only. That is why technical analysis indicators like "Price Rate of Change" (ROC) or "Momentum" give higher readings for ascending price movements than those given to descending ones. TDO fixes this problem to help traders at rea
Trend Lines PRO
Roman Podpora
5 (2)
TREND LINES PRO    helps understand where the market is truly changing direction. The indicator shows real trend reversals and points where major players re-enter. You see   BOS lines   Trend changes and key levels on higher timeframes — without complex settings or unnecessary noise. Signals don't repaint and remain on the chart after the bar closes. VERSION MT 5     -     Reveals its maximum potential when paired with the   RFI LEVELS PRO  indicator What the indicator shows: Real shifts   tren
Trading Special – 30% OFF Best Solution for any Newbie or Expert Trader! This dashboard software is working on 28 currency pairs plus one. It is based on 2 of our main indicators (Advanced Currency Strength 28 and Advanced Currency Impulse). It gives a great overview of the entire Forex market plus Gold or 1 indices. It shows Advanced Currency Strength values, currency speed of movement and signals for 28 Forex pairs in all (9) timeframes. Imagine how your trading will improve when you can watch
Advanced Supply Demand
Bernhard Schweigert
4.91 (302)
Trading Special – 30% OFF Best Solution for any Newbie or Expert Trader! This indicator is a unique, high quality and affordable trading tool because we have incorporated a number of proprietary features and a new formula. With this update, you will be able to show double timeframe zones. You will not only be able to show a higher TF but to show both, the chart TF, PLUS the higher TF: SHOWING NESTED ZONES. All Supply Demand traders will love it. :) Important Information Revealed Maximize the pot
KT Parabolic RSI MT4
KEENBASE SOFTWARE SOLUTIONS
KT Parabolic RSI overlays Parabolic SAR directly on the RSI line to highlight likely market turning points. Classic RSI overbought and oversold readings already hint at reversals, and the added PSAR filter removes much of the noise and sharpens those signals, giving you clearer trade setups. Big Square Signals: A Parabolic SAR flip on an RSI that sits in overbought or oversold territory. These mark high-probability market turns. Small Square Signals: A SAR flip inside the neutral RSI band. Treat
SmartSignal
Pavel Krysanov
For any trader, the result of market analysis is the correct identification of the market entry and exit points. The more correctly they are selected, the more profitable the trading. The SmartArrows indicator does not display any excessive information that may distract or confuse the trader, but only the mot important things. The indicator is very simple to use. When a down arrow appears, open a SELL trade, with an up arrow open BUY. Despite its seeming simplicity, the SmartArrows indicator con
This is a professional chart indicator designed for traders focused on stability and clear price action. It helps filter market noise and provides clear visual entry and exit zones for your trading decisions. Core Features: Strictly Non-Repainting: The system is built with strict non-repaint logic. What you see on the chart is the true historical performance. Confirmed Signals: Signals are triggered and confirmed only after the candle closes . Once a trading arrow appears on a closed candle, it
DayTrader PRO MT4
Davit Beridze
4.6 (10)
DayTrader PRO (Buy DayTrader PRO and Get another Paid Self Optimizing indicator for Free as Bonus) MT5:  https://www.mql5.com/en/market/product/186222 DayTrader PRO   is an advanced trading indicator that combines John Ehlers' Laguerre Filter with a powerful Auto-Optimization Engine. Instead of using fixed parameters, the indicator automatically searches for the best settings based on recent market conditions, helping you adapt to changing volatility without constant manual adjustments. The in
Indicator plots price cycle blocks and sends signals with smart volume confirmation. Price cycles and fractals are combined to determine the demand/supply blocks. The indicator can be used alone or combined with other Cycle Indicators Inputs: Period: Recommended value is between 35 and 55( Which are Set 1 and Set 2 periods of cycle sniper ) Engulfing: If true, you will be able to see the engulfing bar confirmation. Volume Filter: True (The  arrow comes with volume confirmation ) Videos with dif
More from author
Charts247 Market Structure Essentials MT5 Swing highs and lows, HH / HL / LH / LL labels, CHoCH and BOS on the close, the live intraday high and low, and the structure trend. Closed candles only; confirmed swings never move. Charts247 Market Structure Essentials reads price structure the way the Waves of Success method does: from closed candles only, with every swing confirmed before it is drawn. Nothing on history is redrawn. What it shows • Swing highs and lows. A swing high is a candle whose
FREE
Charts247 Market Structure Essentials Swing highs and lows, HH / HL / LH / LL labels, CHoCH and BOS on the close, the live intraday high and low, and the structure trend. Closed candles only; confirmed swings never move. Charts247 Market Structure Essentials reads price structure the way the Waves of Success method does: from closed candles only, with every swing confirmed before it is drawn. Nothing on history is redrawn. What it shows • Swing highs and lows. A swing high is a candle whose hig
FREE
Charts247 Wave Master MTF A complete 0-5 wave count with a built-in rules panel: it reads both directions on your chart and on a higher timeframe, grades every wave, maps the major structure and marks where price spent the most time. Closed candles only. Most wave tools leave you with numbers on a chart and the hard part still to do: is this wave worth trading, which side has the trend, and does the bigger timeframe agree? Wave Master MTF answers all three on one screen. It runs the Waves of S
Charts247 Break and Count Spots the moment a rising support (or falling resistance) gives way, marks the entry candle and its stop, then maps the reversal level and counts the lows (highs) beyond it: buy low, no trade, buy low, continuation. Closed candles only. A support line that has held three times is one of the most watched structures on any chart. When it breaks, two trades follow: the break itself, and later the reversal from the exhaustion lows. Break and Count marks both, on fixed ru
Charts247 Daily Currency Matrix Every currency and every pair starts the day at zero and moves in pips, on one screen: see which currency is driving the market today, which pairs carry the move, and whether the H4 candles agree. Strongest to weakest, updated every second. A pair is only ever two currencies pulling against each other. When EURUSD rises, is the euro strong or the dollar weak? The Daily Currency Matrix answers that before you open a single pair chart: it resets every currency and

Charts247 Liquidity Engine Where the liquidity rests, when it is taken, and the entry that follows: the Waves of Success Alt count, liquidity rays and sweep count, Free State entries with entry and stop, a location gate, internal 2X setups and a higher-degree Free State structure. Closed candles only. Price moves from one pool of liquidity to the next. The highs and lows where stops collect get taken, and the move that follows a sweep is where the opportunity sits. Charts247 Liquidity Engine fo
Charts247 Price Value Bands Is price cheap, fair or stretched right now? Fair value with value bands measured from how far price really travels, the share of closes beyond each band, return arrows, a two-close T3 line, confirmed peaks and the M5 Fibonacci. Nothing repaints. Every market swings around a fair value. Most of the time it stays close; now and then it stretches far away, and from there it usually comes back. Charts247 Price Value Bands shows how far is far for the symbol and timefra
Charts247 Market Structure Sessions The full Charts247 market structure: swings, CHoCH and BOS, intraday highs and lows by session, structure trend, session read, zigzag counter, break count, alerts and a control panel. Closed candles only. Charts247 Market Structure Sessions shows market structure the way the Waves of Success method reads it, and places each intraday high and low in the session where it printed. Everything is calculated on closed candles; nothing on history is redrawn. What

Charts247 Wave Master MTF MT5 A complete 0-5 wave count with a built-in rules panel: it reads both directions on your chart and on a higher timeframe, grades every wave, maps the major structure and marks where price spent the most time. Closed candles only. Most wave tools leave you with numbers on a chart and the hard part still to do: is this wave worth trading, which side has the trend, and does the bigger timeframe agree? Wave Master MTF answers all three on one screen. It runs the Waves
Charts247 Break and Count MT5 Spots the moment a rising support (or falling resistance) gives way, marks the entry candle and its stop, then maps the reversal level and counts the lows (highs) beyond it: buy low, no trade, buy low, continuation. Closed candles only. A support line that has held three times is one of the most watched structures on any chart. When it breaks, two trades follow: the break itself, and later the reversal from the exhaustion lows. Break and Count marks both, on fixe
Charts247 Daily Currency Matrix MT5 Every currency and every pair starts the day at zero and moves in pips, on one screen: see which currency is driving the market today, which pairs carry the move, and whether the H4 candles agree. Strongest to weakest, updated every second. A pair is only ever two currencies pulling against each other. When EURUSD rises, is the euro strong or the dollar weak? The Daily Currency Matrix answers that before you open a single pair chart: it resets every currency
Charts247 Liquidity Engine MT5 Where the liquidity rests, when it is taken, and the entry that follows: the Waves of Success Alt count, liquidity rays and sweep count, Free State entries with entry and stop, a location gate, internal 2X setups and a higher-degree Free State structure. Closed candles only. Price moves from one pool of liquidity to the next. The highs and lows where stops collect get taken, and the move that follows a sweep is where the opportunity sits. Charts247 Liquidity Engin
Charts247 Price Value Bands MT5 Is price cheap, fair or stretched right now? Fair value with value bands measured from how far price really travels, the share of closes beyond each band, return arrows, a two-close T3 line, confirmed peaks and the M5 Fibonacci. Nothing repaints. Every market swings around a fair value. Most of the time it stays close; now and then it stretches far away, and from there it usually comes back. Charts247 Price Value Bands shows how far is far for the symbol and time
Filter:
No reviews
Reply to review