Charts247 Market Structure Sessions

Charts247 Market Structure Sessions

The full Charts247 market structure: swings, CHoCH and BOS, intraday highs and lows by session, structure trend, session read, zigzag counter, break count, alerts and a control panel. Closed candles only.

Charts247 Market Structure Sessions shows market structure the way the Waves of Success method reads it, and places each intraday high and low in the session where it printed. Everything is calculated on closed candles; nothing on history is redrawn.
What it shows
• Swing highs and lows confirmed a set number of candles after they print (4 by default), labelled HH, HL, LH or LL against the previous one. They never move afterwards.
• CHoCH and BOS on the close through the last swing, with a dotted line from the swing to the breaking candle.
• Intraday highs and lows (1-2-3). After a CHoCH, the first BOS the same way confirms the extreme before the CHoCH as an intraday high or low. Each line runs right until a candle closes through it, then stays as a dotted line. Up to 20 recent lines are kept (an input).
• Sessions. Each intraday line is coloured and named by its session, for example iHH LONDON or iLL ASIA. Session hours are entered in London time and converted from your broker's clock.
• Session read. At the start of a session the panel shows how the previous session closed (up or down). After that, a close above the previous or current session's latest intraday high reads BUY favoured; a close below its intraday low reads SELL favoured. The latest break decides.
• Structure trend. UP after two intraday higher highs and one higher low in a row, DOWN after two lower lows and one lower high, held until the other side is confirmed, PULLBACK while the latest run points the other way. Optional background shading from the candle where the trend was confirmed.
• Zigzag and counter. A zigzag through the swings, with higher highs numbered HH1, HH2 and so on and lower lows LL1, LL2. The HH count restarts at LL2 and the LL count at HH2.
• Break count. When a wick takes out a swing high or low, that candle is numbered 1 and each new high (or low) after it 2, 3 and onwards, so you can see how far a move has run since the level was taken.
Control panel
A compact panel shows the structure trend, the session read and the last break with how many candles ago it happened. Seven buttons switch the layers on and off: swings, CHoCH and BOS, 1-2-3, session colours and names, zigzag, break count and trend shading. Settings are kept per symbol, and the panel can be minimised.
Alerts
Pop-up, phone notification or both, set separately for CHoCH, BOS, a change of structure trend and a change of session read. Alerts fire once, on the close of the candle; none fire for history when the indicator loads.
Inputs
• Structure: swing strength, candles analysed, candles drawn, copy number.
• Swing labels, CHoCH and BOS, intraday lines: on or off, colours, font, sizes, gaps, line width, label position, number of lines kept.
• Structure trend: the higher-high and higher-low counts, colours.
• Sessions: colour lines by session, session names on the lines (full or short), broker clock (New York close GMT+2/+3, or a fixed offset), the three session start hours in London time, session colours.
• Zigzag and counter, break count, trend shading: on or off, colours, sizes, candles shown.
• Alerts: one setting per alert type.
• Control panel: corner, position, width.
Notes
• Works on any symbol and timeframe; sessions matter most on intraday charts (M5 to H1).
• Set the broker clock once. Most brokers use the New York close clock (server midnight = 22:00 London in winter); if your broker's clock differs, choose a fixed offset.
• No DLLs and no files written.
• Charts247 Market Structure Essentials, at no charge, shows the swings, CHoCH and BOS, the live intraday pair and the trend.
Produits recommandés
Introduction to Fractal Pattern Scanner Fractal Indicator refers to the technical indicator that makes use of the fractal geometry found in the financial market. Fractal Pattern Scanner is the advanced Fractal Indicator that brings the latest trading technology after the extensive research and development work in the fractal geometry in the financial market. The most important feature in Fractal Pattern Scanner is the ability to measure the turning point probability as well as the trend probabi
Introduction to Harmonic Volatility Indicator Harmonic Volatility Indicator is the first technical analysis applying the Fibonacci analysis to the financial volatility. Harmonic volatility indicator is another level of price action trading tool, which combines robust Fibonacci ratios (0.618, 0.382, etc.) with volatility. Originally, Harmonic Volatility Indicator was developed to overcome the limitation and the weakness of Gann’s Angle, also known as Gann’s Fan. We have demonstrated that Harmonic
Currency Strength Oscillator MT4
Narayanan Mohanan Mohanan Krishnan
Oscillateur de force monétaire pour MetaTrader 4 Un indicateur de force relative de la monnaie qui retrace l’histoire des huit majors. Cet oscillateur de force monétaire trace la force relative des huit principales devises sous forme d'histoire, décomposée à partir du 28 paires majeures. Alors qu'un indicateur standard de la force monétaire vous indique où en sont les choses à l'heure actuelle, il montre comment elles y sont arrivées : quelle devise s'est renforcée, laquelle s'est inversée et où
L'indicateur de Carré Gann est un puissant outil d'analyse du marché basé sur l'article "Formule Mathématique pour les Prédictions de Marché" écrit par W.D. Gann. Cet outil utilise des concepts mathématiques et des théories de Gann pour réaliser une analyse précise du marché. Il utilise les carrés de 144, 90, 52 et aussi le carré de 9. De plus, il intègre la méthode du  pour le carré de 9 et sa relation avec les canaux et le modèle en étoile de ce carré. Manuel d'Utilisateur et Application : Ava
Introduction This indicator detects volume spread patterns for buy and sell opportunity. The patterns include demand and supply patterns. You might use each pattern for trading. However, these patterns are best used to detect the demand zone (=accumulation area) and supply zone (=distribution area). Demand pattern indicates generally potential buying opportunity. Supply pattern indicates generally potential selling opportunity. These are the underlying patterns rather than direct price action. T
RSI bands indicator is a mt4 indicator that shows various levels to enter trades based on market conditions. It consists of the below buffers; Yellow buffer Blue buffer White buffer When the yellow buffer is above blue buffer the market is trending up good place to open buy order. When the blue buffer is above yellow buffer the market is trending downwards good time to place sell order. Also another alternative scenario is when yellow buffer is above upper white band buffer indicates strong uptr
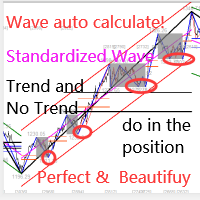
Cet indicateur est un indicateur d'analyse automatique des vagues, parfait pour le trading pratique ! Cas... Remarque :   je n'ai pas l'habitude d'utiliser des noms occidentaux pour l'évaluation des vagues. En raison de l'influence de la convention de dénomination de Tang Lun (Tang Zhong Shuo Zen), j'ai nommé la vague de base comme   un stylo   et la bande d'onde secondaire comme   un segment   . en même temps, le segment a la direction de la tendance.Le   segment de tendance principal   est no
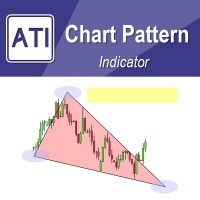
Introduction to Chart Pattern MT Chart Pattern MT is a chart pattern scanner to detect the triangle pattern, falling wedge pattern, rising wedge pattern, channel pattern and so on. Chart Pattern MT uses highly sophisticated chart pattern detection algorithm. However, we have designed it in the easy to use with intuitive user interface. Chart Pattern MT will show all the patterns in your chart in the most efficient format for your trading. You do not have to do tedious manual pattern detection an
My indicator is 1000%, it never repaints, it works in every time period, there is only 1 variable, it sends notifications to your phone even if you are on vacation instead of at work, in a meeting, and there is also a robot version of this indicator With a single indicator you can get rid of indicator garbage It is especially suitable for scalping in the m1 and m5 time frames on the gold chart, and you can see long trends in the h1 time frame.
The indicator shows the Buy/Sell direction. The calculations use the opening prices and their rate of change for the billing period - "Calculation period" MTF indicator - "Calculation timeframe", no repaint - NRP. Two display types: "Chart default" или "Chart color" For "Chart color" color customization available : "Bar color" Two types stop levels: "Simple stop level" or "Dynamic stop level " Color settings: "Stop level color" Alerts available: "Chart message", "Push message", "Email message" F
Market Profile
Artem Titarenko
5 (1)
The "Market Profile" indicator displays the profiles and volumes of periods – weekly, daily, session (8-hour), 4-hour, hour, summary. The VAH/VAL price area is automatically highlighted by a dotted line for each profile (except for the summary). The indicator includes chroma Delta, which colors the profile areas. The areas of prevailing Buys is colored in green, that of Sells - in red. The intensity histogram features blue/red respectively. In the filter mode, the indicator displays the volume a
Blogs : https://www.mql5.com/en/blogs/post/768816 Version MT4 : https://www.mql5.com/en/market/product/139061 Version MT5 : https://www.mql5.com/en/market/product/139062 Problème Surveiller simultanément plusieurs symboles et unités de temps est lent, répétitif et mentalement épuisant. La plupart des traders perdent du temps à changer de graphique un par un, pour finalement se rendre compte que le mouvement a déjà eu lieu. Lorsqu'un changement de tendance clair est visible, l'opportunité e
The indicator calculates support and resistance levels. There is a hint in the upper left corner. This hint can be removed. Hint in two languages (English and Russian). The width of support and resistance levels is shown. The number of levels touched is displayed. Works on all timeframes. Can be used as an independent trading system, and as an addition to another system. Download the demo version of the indicator right now and try it in the strategy tester!
Points Pivot Intelligents pour MetaTrader 4 — Des Niveaux Clairs pour un Trading Intelligent Points Pivot Intelligents est un indicateur professionnel pour MetaTrader 4 qui calcule et affiche automatiquement un ensemble complet de niveaux de trading clés sur le graphique. Il transforme le chaos des mouvements de prix en une carte structurée et claire, mettant en évidence le support, la résistance, l'équilibre des prix et les zones cibles potentielles. Conçu pour les traders qui privilégient la
ArchIntel Pivot Point
Raphael Adetunji Olaiyapo
This tool draws all the pivot point lines on chart. It is important to remind/tell you that there are 5 pivot method according to BabyPips website. All these methods have their unique mathematical formula. 1. Floor Method. 2. Woodie Method. 3. Camarilla Method. 4. DeMark Method. 5. Fibonacci Method. What makes this pivot tool unique is that you can click the "Fibonacci" button to select the pivot method you want. You can click the "Monthly" button to select the Period you want to use for the piv
ABCD Harmonic Patterns
Mehmet Ozhan Hastaoglu
Thanks to this indicator, you can easily see the new ABCD harmonic patterns in the chart. If the two price action lengths are equal, the system will give you a signal when it reaches the specified level. You can set the limits as you wish. For example, You can get the signal of the price, which occurs in the Fibonaci 38.2 and 88.6 retracements, and then moves for the same length, at the level you specify. For example, it will alarm you when the price reaches 80% as a percentage. In vertical
MetaForecast M4
Vahidreza Heidar Gholami
5 (2)
MetaForecast prédit et visualise l'avenir de n'importe quel marché en se basant sur les harmoniques des données de prix. Bien que le marché ne soit pas toujours prévisible, s'il y a un motif dans les prix, MetaForecast peut prédire l'avenir aussi précisément que possible. Comparé à d'autres produits similaires, MetaForecast peut générer des résultats plus précis en analysant les tendances du marché. Paramètres d'entrée Past size (Taille passée) Spécifie le nombre de barres que MetaForecast util
BeST_Gann Swing Oscillator is an MT4 indicator that is based on the corresponding work of Robert Krausz who introduced it in the book “ A.W.D Gann Treasure Discovered ” . The Gann Swing Oscillator is a range-bounding technical indicator that oscillates between +1 and -1 and thus it describes the market swings. Generally when the market is in an upswing, the Gann Swing Oscillator describes it as 2 higher highs with the value of +1 while after an upswing, the downswing is expected. Also the downs
ENTRY AND EXIT ARROWS Indicator – Description The Entry and Exit Arrows indicator is a simple yet effective momentum-based tool designed to highlight potential buy and sell opportunities directly on the chart using visual arrows. It works by comparing two internal momentum measurements with different sensitivities. When both measurements align in the same direction, the indicator confirms a stronger directional bias and plots a signal. How It Works Buy Signal (Lime Arrow Below Candle): Appea
Cupid Signal Fx
Damrongwit Kongtong
The principle of this indicator is very simple: detecting the return point with Stochastic Oscillator, then monitoring the trend by using the Moving Average and finally predicting BUY and SELL signal with arrows, alerts and notifications. The parameters are fixed and automatically calculated on each timeframe. Example: If you install indicator on EURUSD, the indicator will detect the return point when the Stochastic Oscillator show "cross up" of the main line/signal line at the below position of
Snake NW
Sergei Shishaev
5 (1)
Канальный индикатор "Snake" . Отлично показывает точки входа и выхода. Не перерисовывает! Хорошо подойдет для стратегий с сетками (усреднения), стратегий с пирамидами (стратегий добора), обычной торговли по тренду, торговли на коррекции. Для любых типов инструментов:   валюты, нефть, металлы, криптовалюты. Для любых таймфреймов:   от M1 до D1 . Для любых стилей торговли:   скальпинг, интрадэй, свинг, долгосрок . Используйте в сочетании с трендовым индикатором, чтобы исключить риски входа про
- Real price is 80$ - 50% Discount (It is 39$ now)   Contact me for instruction, add group and any questions! - New Update: 2026/10 - Non-repaint - I just sell my products in Elif Kaya profile, any other websites are stolen old versions, So no any new updates or support. - Lifetime update free Related product:   Bitcoin Expert Introduction The breakout and retest strategy is traded support and resistance levels. it involves price breaking through a previous level.  The break and retest strateg
Introduction to Sideways Market Analyzer Notable period of Low volatility and non-trending movements in the financial market is considered as Sideways Market. Sooner or later, the low volatility will increase and the price will pick up a trend after Sideways Market. In terms of trading point of view, Sideways Market can serve as the very good entry timing for traders. Sideways Market is also quite often the representation of accumulation of large orders from big investors. Therefore, knowing the
Range bound is a mt4 indicator that shows various levels to enter the market. It uses MACD as the primary reference indicator. When MACD oscillator is showing buy or sell signals these are displayed on your trading dashboard but as levels to buy or sell on the main chart. The indicator shows blue signals and red signals That are support and resistance levels. In short this indicator shows ranges where your trades should be safe from market changes against your order.
Daily Trend Confluence Scanner Daily Trend Confluence Scanner is a systematic multi-indicator trend-following tool designed to spot high-probability trade setups while filtering out market noise.   By evaluating market conditions strictly on completed daily candle closes (shift = 1), this indicator provides reliable, non-repainting signals based on four layers of technical confirmation.   Key Features 100% Non-Repainting: All calculations freeze upon daily candle close (shift = 1), eliminating
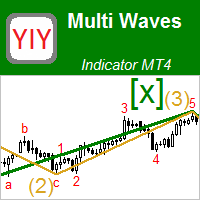
YY Multi Waves
Yuryi Yatsenko
4 (3)
This indicator displays the wave structure of the market in the form several wave levels nested in each other. For each of these levels an automatic preliminary (draft) marking of waves in Elliott's style (123..., ABC... etc.) is created. This markup is completely automatic and absolutely univocal. The indicator is especially useful for beginner wave analysts, because among all the possible versions for wave marking, it allows you to immediately take the most adequate version as a ba
RelicusRoad Dynamic Circles est un indicateur de sommets et creux de swing pour MetaTrader 4 et MetaTrader 5 qui marque les points de retournement avec des cercles sur trois longueurs de lookback à la fois : 9, 60 et 156 bougies. Les petits retournements et les grands retournements se trouvent sur le même graphique mais paraissent différents. Un point de la plage courte montre un swing mineur, tandis que les anneaux plus grands des plages moyenne et longue n'apparaissent que là où le prix a fait
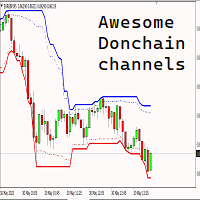
Introducing the Donchian Channels indicator for MQL4, a powerful technical analysis tool designed to boost your trading success. This indicator consists of four lines that represent the upper and lower boundaries of price movement over a specified period. With the Donchian Channels indicator, you can easily identify potential breakouts and reversals in the market. The upper line shows the highest high of the specified period, while the lower line represents the lowest low. The space between thes
Ezy Option Signal
Nirundorn Promphao
The principle of this indicator is very simple: detecting the trend with Moving Average, then monitoring the return point of graph by using the crossing of Stochastic Oscillator and finally predicting BUY and SELL signal with arrows, alerts and notifications. The parameters are fixed and automatically calculated on each time frame. Example: If you install indicator on EURUSD, timeframe M5: the indicator will detect the main trend with the Moving Average on this timeframe (for example the Moving
PZ Harmonacci Patterns
PZ TRADING SLU
3.17 (6)
Trade smarter, not harder: Empower your trading with Harmonacci Patterns This is arguably the most complete harmonic price formation auto-recognition indicator you can find for the MetaTrader Platform. It detects 19 different patterns, takes fibonacci projections as seriously as you do, displays the Potential Reversal Zone (PRZ) and finds suitable stop-loss and take-profit levels. [ Installation Guide | Update Guide | Troubleshooting | FAQ | All Products  ] It detects 19 different harmonic pric
Les acheteurs de ce produit ont également acheté
Trend SniperX MT4
Sarvarbek Abduvoxobov
5 (5)
Trend Sniper X est un indicateur de suivi de tendance multi-temporalité pour MetaTrader 5 qui aide les traders à identifier la direction de la tendance et les points de retournement potentiels avec clarté et précision. Pour MT5 : https://www.mql5.com/en/market/product/181101 Information sur le prix : Le prix actuel est une offre promotionnelle et peut évoluer au fur et à mesure de la sortie des prochaines mises à jour et nouvelles fonctionnalités. Canal Code2Profit Maîtrisez le marché grâce à l'
M1 Sniper
Oleg Rodin
4.97 (30)
M1 SNIPER est un système d'indicateurs de trading facile à utiliser. Il s'agit d'un indicateur à flèche conçu pour l'unité de temps M1. Cet indicateur peut être utilisé seul pour le scalping sur l'unité de temps M1 ou intégré à votre système de trading existant. Bien que conçu spécifiquement pour le trading sur l'unité de temps M1, ce système peut également être utilisé avec d'autres unités de temps. Initialement, j'avais conçu cette méthode pour le trading du XAUUSD et du BTCUSD. Cependant, je
Le système PRO Renko est un système de trading très précis spécialement conçu pour le trading de graphiques RENKO. Il s'agit d'un système universel qui peut être appliqué à divers instruments de négociation. Le système neutralise efficacement ce qu'on appelle le bruit du marché en vous donnant accès à des signaux d'inversion précis. L'indicateur est très facile à utiliser et n'a qu'un seul paramètre responsable de la génération du signal. Vous pouvez facilement adapter l'outil à n'importe que
Currency Strength Wizard est un indicateur très puissant qui vous offre une solution tout-en-un pour un trading réussi. L'indicateur calcule la puissance de telle ou telle paire de devises en utilisant les données de toutes les devises sur plusieurs périodes. Ces données sont représentées sous la forme d'un indice de devise facile à utiliser et de lignes électriques de devise que vous pouvez utiliser pour voir la puissance de telle ou telle devise. Tout ce dont vous avez besoin est d'attacher l'
Atomic Analyst
Issam Kassas
5 (14)
Atomic Analyst — MetaTrader 4 Pour toute question sur le produit, sa configuration ou le support technique, envoyez-moi un message directement ici sur MQL5. L’indicateur transforme des calculs complexes du marché en signaux visuels simples, bougies colorées, lectures de tendance, niveaux de stop-loss et plusieurs zones de take-profit que les traders peuvent comprendre rapidement et utiliser dans des conditions réelles de marché. Principales utilisations de trading : Scalping et trading intraday
Smart Trend Trading System est un indicateur pour MetaTrader 4 qui réunit les informations de tendance, les signaux d’entrée et de sortie et les niveaux de prix sur un même graphique. Il combine plus de 10 outils de trading en un seul système, incluant la détection de tendance, les zones de retournement, Smart Cloud, la logique de trailing stop, le support et la résistance, la coloration des bougies, les alertes et l’analyse multi-timeframe. Le système est conçu pour vous aider à trader différen
Scalper Vault
Oleg Rodin
5 (40)
Scalper Vault est un système de trading puissant et complet, conçu pour les traders en quête de régularité dans le cadre du trading intrajournalier. Cet indicateur de haute précision constitue un système de trading autonome et exhaustif, offrant des analyses de qualité institutionnelle, aussi bien pour le Forex que pour les options binaires. VEUILLEZ ME CONTACTER APRÈS VOTRE ACHAT POUR OBTENIR MES CONSEILS DE TRADING AINSI QU'UN EXCELLENT BONUS ! En éliminant les incertitudes et les analyses ma
Neuro Poseidon MT4
Daria Rezueva
4.74 (46)
Neuro Poseidon is a new indicator by Daria Rezueva. It combines precise trading signals with adaptive TP/SL levels - creating best possible trades as a result! Message me and get  Neuro Poseidon Assistant  as a gift to automize your trading process! What makes it stand out? 1. Proven profitability on all assets and timeframes 2. Only confirmed BUY and SELL signals present on the chart 3. Adaptive TP & SL levels generated by the software for each trade 4. Easy to understand - suitable for all
Gann Made Easy
Oleg Rodin
4.84 (173)
Gann Made Easy est un système de trading Forex professionnel et facile à utiliser qui est basé sur les meilleurs principes de trading en utilisant la théorie de mr. WD Gann. L'indicateur fournit des signaux d'ACHAT et de VENTE précis, y compris les niveaux Stop Loss et Take Profit. Vous pouvez échanger même en déplacement en utilisant les notifications PUSH. VEUILLEZ ME CONTACTER APRÈS L'ACHAT POUR RECEVOIR GRATUITEMENT DES INSTRUCTIONS DE TRADING ET D'EXCELLENTS INDICATEURS SUPPLÉMENTAIRES! Vou
Liquidity Scalper System : un système de trading basé sur la liquidité au format indicateur. La plupart des indicateurs n'affichent qu'une flèche, puis le trader décide seul où placer le stop, où se trouve l'objectif et s'il peut faire confiance au signal. Liquidity Scalper System couvre tout le cycle du trade : il trouve les pools de liquidité, donne un signal lors de leur cassure, calcule immédiatement Entry, Stop Loss et trois objectifs, et affiche sur le panneau les statistiques et les résu
SR Liquidity
Oleg Rodin
5 (2)
SR Liquidity est un indicateur de trading conçu pour révéler les zones cachées où se concentre la liquidité du marché et où le prix réagit avec le plus d'intensité. Ces zones de liquidité spécifiques agissent comme de puissants niveaux de support et de résistance, vous offrant une cartographie claire des points où le marché est le plus susceptible de se retourner. Plutôt que de tracer des lignes de support et de résistance classiques, l'indicateur SR Liquidity analyse le comportement réel des pr
AW Prime Oscillator
AW Trading Software Limited
5 (1)
Une combinaison de deux oscillateurs. Le premier affiche les points d'entrée, le second montre la tendance actuelle. L'indicateur peut afficher les signaux d'oscillateur par des flèches dans deux modes, tous les signaux d'oscillateur rapides ou les signaux uniquement dans la direction de la tendance actuelle. Il dispose d'un panneau multi-périodes et de trois types de notifications de signal. Avantages: Convient au day trading et au scalping Filtrage des tendances Configuration simple et sensibl
Top Bottom Tracker est un indicateur basé sur des algorithmes sophistiqués qui analyse la tendance du marché et peut détecter les hauts et les bas de la tendance / Version MT5 . Le prix augmentera progressivement jusqu'à ce qu'il atteigne 500$. Prochain prix --> 99$ Caractéristiques Pas de repeinture Cet indicateur ne change pas ses valeurs lorsque de nouvelles données arrivent Paires de trading Toutes les paires de devises Période de temps Toutes les périodes de temps Paramètres de
Cycles Predictor Indicator This indicator uses past market cycles to predict future price movements. The indicator scans through past data and considers  combinations  of cycles. When cycles  coincide  at the same future date/time then it is considered a valid future prediction. The predictions are drawn as vertical lines on the right side of the chart in the future. A prediction will often result in type of candle (ex. bull or bear) and/or a reversal point (ex. bottom or top) forming at this ex
Break and Retest Hunter MT4 is a powerful MetaTrader 5 indicator designed to automatically identify support and resistance levels, breakout structures, and potential retest opportunities in real time. Bonus Indicator: After purchasing Break and Retest Hunter , contact me to receive Trade Indicator Assistant EA completely free as a bonus utility. $65 for the next 10 copies . Next price is $120.  Combining adaptive market analysis, clear BUY/SELL signals, Fibonacci-based profit targets, and a pre
Signal GoldRush Trend Arrow L'indicateur GoldRush Trend Arrow Signal fournit une analyse précise et en temps réel des tendances, spécialement conçue pour les scalpers à haute vitesse et à court terme sur la paire XAU/USD. Conçu spécialement pour les intervalles de temps d'une minute, cet outil affiche des flèches directionnelles indiquant clairement les points d'entrée, ce qui permet aux scalpers de naviguer en toute confiance dans des conditions de marché volatiles. L'indicateur se compose
ForexTrendMT4
Andriy Sydoruk
5 (1)
ForexTrendMT4 Indicator: A Reliable Tool for Market Tracking The ForexTrendMT4 indicator offers reliable market trend tracking, filtering out sudden fluctuations and market noise. This tool helps identify trends and signals favorable entry points into the market using arrows. It is suitable for both scalping on shorter timeframes and long-term trading strategies. Based on the principles of technical analysis, ForexTrendMT4 takes into account the cyclical nature of the market. Key Features and A
CRT Multi-Timeframe Market Structure & Liquidity Sweep Indicator Non-Repainting | Multi-Asset | MT5 Version Available MT5 Version:   https://www.mql5.com/en/market/product/162075 Full User Guide — explains what each feature does and why:   https://www.mql5.com/en/blogs/post/767525 Quick Start User Guide  — explains how to configure and in what order:  https://www.mql5.com/en/blogs/post/767540 Indicator Overview CRT Ghost Candle HTF Fractal is a complete institutional-grade market structure too
Super Signal – Skyblade Edition Système de signaux de tendance professionnel sans repaint / sans latence, avec un taux de réussite exceptionnel | Pour MT4 / MT5 Il fonctionne mieux sur des unités de temps inférieures, comme 1 minute, 5 minutes et 15 minutes. Caractéristiques principales : Super Signal – Skyblade Edition est un système de signaux intelligent conçu spécifiquement pour le trading de tendance. Il utilise une logique de filtrage multicouche pour détecter uniquement les mouvements d
ACTUELLEMENT 40% DE RÉDUCTION La meilleure solution pour tout débutant ou trader expert ! Cet indicateur est un outil de trading unique, de haute qualité et abordable car nous avons incorporé un certain nombre de caractéristiques exclusives et une nouvelle formule. Avec seulement UN graphique, vous pouvez lire la force de la devise pour 28 paires Forex ! Imaginez comment votre trading va s'améliorer parce que vous êtes capable de repérer le point de déclenchement exact d'une nouvelle tendance
Introducing Volume Orderflow Profile , a versatile tool designed to help traders visualize and understand the dynamics of buying and selling pressure within a specified lookback period. Perfect for those looking to gain deeper insights into volume-based market behavior! MT5 Version -  https://www.mql5.com/en/market/product/122657 The indicator gathers data on high and low prices, along with buy and sell volumes, over a user-defined period. It calculates the maximum and minimum prices during this
True Direction Oscillator
Muhammad Elbermawi
4.85 (364)
Ou (TDO) qui est un indice qui mesure le taux de variation des prix en utilisant le principe du « Pure Momentum ». Lorsque le prix d'un titre augmente de 10 à 15, le taux de variation du prix est de 150 %, mais lorsqu'il redescend de 15 à 10, le taux de variation du prix n'est que de 33,3 %. C'est pourquoi les indicateurs d'analyse technique tels que « Taux de variation des prix » (ROC) ou « Momentum » donnent des lectures plus élevées pour les mouvements de prix ascendants que ceux donnés aux m
Trend Lines PRO
Roman Podpora
5 (2)
TREND LINES PRO     Cet indicateur permet de comprendre les véritables changements de direction du marché. Il révèle les renversements de tendance et les points de retour des principaux acteurs. Tu vois     Lignes BOS     Détection des changements de tendance et des niveaux clés sur des unités de temps supérieures, sans paramètres complexes ni interférences inutiles. Les signaux restent affichés sur le graphique même après la fermeture de la bougie. VERSION MT 5    -     Révèle son potentiel max
Actuellement 30% de réduction ! La meilleure solution pour tout débutant ou trader expert ! Ce logiciel de tableau de bord fonctionne sur 28 paires de devises. Il est basé sur 2 de nos principaux indicateurs (Advanced Currency Strength 28 et Advanced Currency Impulse). Il donne un excellent aperçu de l'ensemble du marché Forex. Il montre les valeurs de l'Advanced Currency Strength, la vitesse de mouvement des devises et les signaux pour 28 paires de devises dans tous les (9) délais. Imaginez
Advanced Supply Demand
Bernhard Schweigert
4.91 (302)
Offre spéciale : 30 % de réduction La solution idéale pour les traders débutants comme experts ! Cet indicateur est un outil de trading unique, performant et abordable grâce à l’intégration de nombreuses fonctionnalités exclusives et d’une nouvelle formule. Cette mise à jour vous permet d’afficher des zones sur deux unités de temps. Vous pourrez ainsi visualiser non seulement une unité de temps supérieure, mais aussi l’unité de temps du graphique, ainsi que l’unité de temps supérieure : des z
KT Parabolic RSI MT4
KEENBASE SOFTWARE SOLUTIONS
KT Parabolic RSI overlays Parabolic SAR directly on the RSI line to highlight likely market turning points. Classic RSI overbought and oversold readings already hint at reversals, and the added PSAR filter removes much of the noise and sharpens those signals, giving you clearer trade setups. Big Square Signals: A Parabolic SAR flip on an RSI that sits in overbought or oversold territory. These mark high-probability market turns. Small Square Signals: A SAR flip inside the neutral RSI band. Treat
SmartSignal
Pavel Krysanov
For any trader, the result of market analysis is the correct identification of the market entry and exit points. The more correctly they are selected, the more profitable the trading. The SmartArrows indicator does not display any excessive information that may distract or confuse the trader, but only the mot important things. The indicator is very simple to use. When a down arrow appears, open a SELL trade, with an up arrow open BUY. Despite its seeming simplicity, the SmartArrows indicator con
This is a professional chart indicator designed for traders focused on stability and clear price action. It helps filter market noise and provides clear visual entry and exit zones for your trading decisions. Core Features: Strictly Non-Repainting: The system is built with strict non-repaint logic. What you see on the chart is the true historical performance. Confirmed Signals: Signals are triggered and confirmed only after the candle closes . Once a trading arrow appears on a closed candle, it
DayTrader PRO MT4
Davit Beridze
4.6 (10)
DayTrader PRO MT5:  https://www.mql5.com/en/market/product/186222 DayTrader PRO est un indicateur de trading avancé qui combine le filtre Laguerre de John Ehlers avec un puissant moteur d'auto-optimisation. Au lieu d'utiliser des paramètres fixes, l'indicateur recherche automatiquement les meilleurs réglages en fonction des conditions récentes du marché, vous aidant à vous adapter à la volatilité changeante sans ajustements manuels constants. L'indicateur génère des signaux clairs d'ACHAT (BUY)
Indicator plots price cycle blocks and sends signals with smart volume confirmation. Price cycles and fractals are combined to determine the demand/supply blocks. The indicator can be used alone or combined with other Cycle Indicators Inputs: Period: Recommended value is between 35 and 55( Which are Set 1 and Set 2 periods of cycle sniper ) Engulfing: If true, you will be able to see the engulfing bar confirmation. Volume Filter: True (The  arrow comes with volume confirmation ) Videos with dif
Plus de l'auteur
Charts247 Market Structure Essentials MT5 Swing highs and lows, HH / HL / LH / LL labels, CHoCH and BOS on the close, the live intraday high and low, and the structure trend. Closed candles only; confirmed swings never move. Charts247 Market Structure Essentials reads price structure the way the Waves of Success method does: from closed candles only, with every swing confirmed before it is drawn. Nothing on history is redrawn. What it shows • Swing highs and lows. A swing high is a candle whose
FREE
Charts247 Market Structure Essentials Swing highs and lows, HH / HL / LH / LL labels, CHoCH and BOS on the close, the live intraday high and low, and the structure trend. Closed candles only; confirmed swings never move. Charts247 Market Structure Essentials reads price structure the way the Waves of Success method does: from closed candles only, with every swing confirmed before it is drawn. Nothing on history is redrawn. What it shows • Swing highs and lows. A swing high is a candle whose hig
FREE
Charts247 Wave Master MTF A complete 0-5 wave count with a built-in rules panel: it reads both directions on your chart and on a higher timeframe, grades every wave, maps the major structure and marks where price spent the most time. Closed candles only. Most wave tools leave you with numbers on a chart and the hard part still to do: is this wave worth trading, which side has the trend, and does the bigger timeframe agree? Wave Master MTF answers all three on one screen. It runs the Waves of S
Charts247 Break and Count Spots the moment a rising support (or falling resistance) gives way, marks the entry candle and its stop, then maps the reversal level and counts the lows (highs) beyond it: buy low, no trade, buy low, continuation. Closed candles only. A support line that has held three times is one of the most watched structures on any chart. When it breaks, two trades follow: the break itself, and later the reversal from the exhaustion lows. Break and Count marks both, on fixed ru
Charts247 Daily Currency Matrix Every currency and every pair starts the day at zero and moves in pips, on one screen: see which currency is driving the market today, which pairs carry the move, and whether the H4 candles agree. Strongest to weakest, updated every second. A pair is only ever two currencies pulling against each other. When EURUSD rises, is the euro strong or the dollar weak? The Daily Currency Matrix answers that before you open a single pair chart: it resets every currency and
Charts247 Market Structure Sessions The full Charts247 market structure: swings, CHoCH and BOS, intraday highs and lows by session, structure trend, session read, zigzag counter, break count, alerts and a control panel. Closed candles only. Charts247 Market Structure Sessions shows market structure the way the Waves of Success method reads it, and places each intraday high and low in the session where it printed. Everything is calculated on closed candles; nothing on history is redrawn. What

Charts247 Wave Master MTF MT5 A complete 0-5 wave count with a built-in rules panel: it reads both directions on your chart and on a higher timeframe, grades every wave, maps the major structure and marks where price spent the most time. Closed candles only. Most wave tools leave you with numbers on a chart and the hard part still to do: is this wave worth trading, which side has the trend, and does the bigger timeframe agree? Wave Master MTF answers all three on one screen. It runs the Waves
Charts247 Break and Count MT5 Spots the moment a rising support (or falling resistance) gives way, marks the entry candle and its stop, then maps the reversal level and counts the lows (highs) beyond it: buy low, no trade, buy low, continuation. Closed candles only. A support line that has held three times is one of the most watched structures on any chart. When it breaks, two trades follow: the break itself, and later the reversal from the exhaustion lows. Break and Count marks both, on fixe
Charts247 Daily Currency Matrix MT5 Every currency and every pair starts the day at zero and moves in pips, on one screen: see which currency is driving the market today, which pairs carry the move, and whether the H4 candles agree. Strongest to weakest, updated every second. A pair is only ever two currencies pulling against each other. When EURUSD rises, is the euro strong or the dollar weak? The Daily Currency Matrix answers that before you open a single pair chart: it resets every currency
Filtrer:
Aucun avis
Répondre à l'avis