Harmonic Pattern Scanner PRZ Stats
- Indicators
- Version: 1.0
- Activations: 10

Harmonic patterns with an honest track record. The indicator finds Gartley, Bat, Alt Bat, Butterfly, Crab, Deep Crab, Shark, Cypher, 5-0 and AB=CD patterns on your chart and on dozens of symbols and timeframes at once, draws the XABCD shape with its Potential Reversal Zone (PRZ) and Fibonacci ratios, gives entry, stop loss and three targets, and shows how often each pattern actually worked on each symbol: PRZ hold rate, TP1 and TP2 hit rate and average result in R, measured with exactly the same non-repainting rules as the live signals.
The complete manual is on this page: no private messages needed. Example set files are listed at the end.
Why it is different
- Historical statistics built in. For every pattern type, on this chart, on every scanned symbol and timeframe and on all of them together: number of signals, PRZ hold rate, TP1 and TP2 hit rate and average R. The scanner shows the hold rate of that pattern on that symbol next to every signal, so you can see at a glance which setups have a record and which do not.
- Written completion rules, no repainting. A pattern is completed only when point D is a confirmed swing inside the PRZ. From that bar on it is frozen: never moved, never deleted. If price later breaks the stop, the pattern stays on the chart and is counted as a loss.
- Three clear targets (38.2 %, 61.8 % and 100 % of AD) and one stop beyond the PRZ, instead of a long list of possible levels.
- Detector, scanner and statistics in one product, light on the terminal: a symbol is re-analysed only when it closes a new bar.
Patterns
| Pattern | AB/XA | BC/AB | CD/BC | D |
|---|---|---|---|---|
| Gartley | 0.618 | 0.382-0.886 | 1.13-1.618 | 0.786 XA |
| Bat | 0.382-0.50 | 0.382-0.886 | 1.618-2.618 | 0.886 XA |
| Alt Bat | 0.30-0.382 | 0.382-0.886 | 2.0-3.618 | 1.13 XA |
| Butterfly | 0.786 | 0.382-0.886 | 1.618-2.618 | 1.272-1.414 XA |
| Crab | 0.382-0.618 | 0.382-0.886 | 2.24-3.618 | 1.618 XA |
| Deep Crab | 0.886 | 0.382-0.886 | 2.0-3.618 | 1.618 XA |
| Shark | 0.382-0.886 | 1.13-1.618 | 1.618-2.24 | 0.886-1.13 XC |
| Cypher | 0.382-0.618 | XC/XA 1.13-1.414 | - | 0.786 XC |
| 5-0 | 1.13-1.618 | 1.618-2.24 | 0.50 | - |
| AB=CD | - | 0.382-0.886 | 1.13-2.618 | CD = AB |
Every range is widened by the Ratio Tolerance input (default 7 %). The PRZ is the overlap of the XA (or XC / AB) projection and the BC projection. When several patterns fit the same swings, the closest fit is shown; a full XABCD pattern is preferred to a plain AB=CD.
Detection and completion rules
- Swings are pivots with N bars on each side (Swing Depth, default 5). Pattern Sizes adds medium (2 × N) and large (4 × N) swings, so small and large structures are both found. A swing must be at least Minimum Swing × ATR(14) long. A swing is known only after its N right-hand bars have closed.
- Completed pattern: the last swings X-A-B-C-D match a pattern and D lies inside the PRZ. The pattern completes at the close of the bar that confirms D (D + N bars). Entry = close of that bar. If price has already reached TP1 at that moment the signal is skipped.
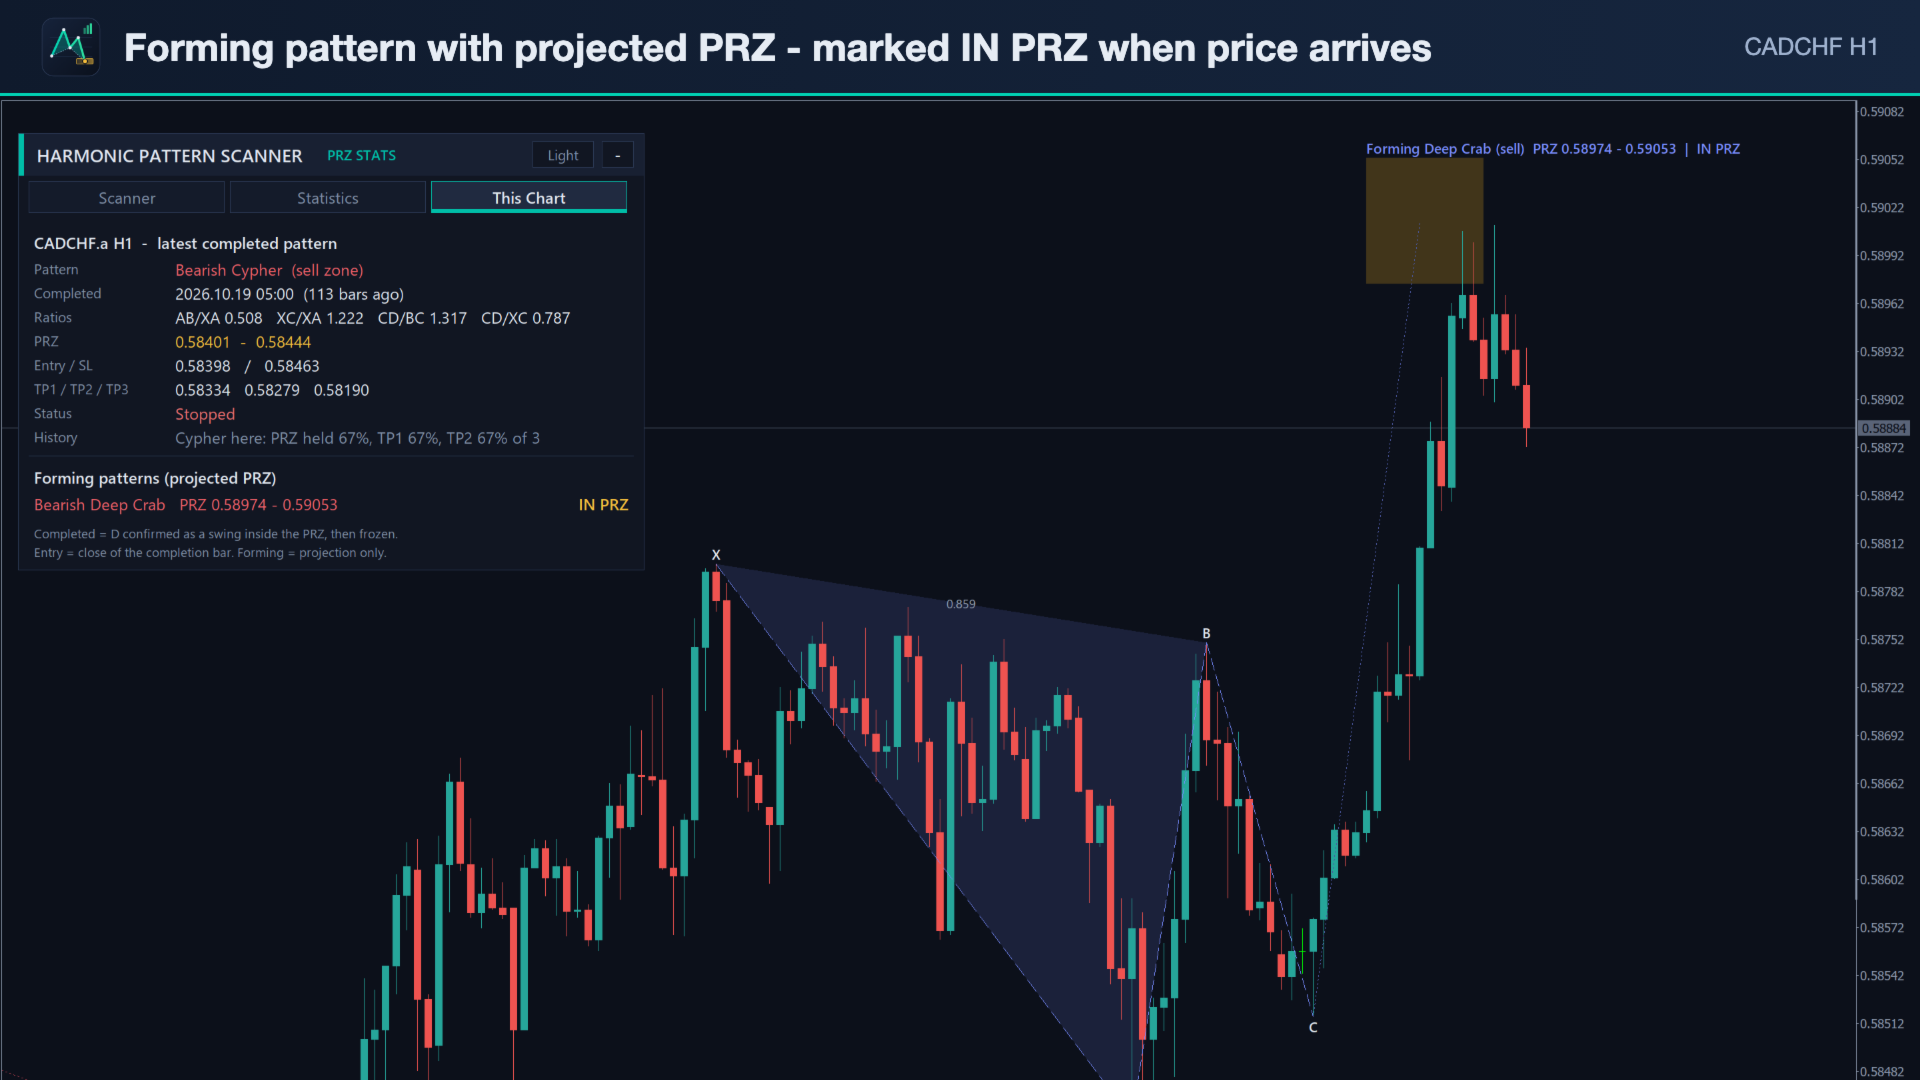
- Forming pattern: X-A-B-C match and price has not run through the PRZ yet. It is drawn dashed with the projected PRZ ahead of price, and marked "In PRZ" when price trades into the zone. A forming pattern is a projection and can still fail; it becomes a signal only when it completes.
- Stop loss beyond the outer edge of the PRZ (or beyond D) plus an ATR buffer. Targets: TP1 / TP2 / TP3 = 38.2 / 61.8 / 100 % of the AD leg (adjustable).
- Outcome: after completion each bar is checked; a bar touching the stop and a target counts as the stop (conservative). PRZ held = TP1 was reached before the stop, or the stop was not hit within the first 10 bars (input). Signals that are still open are not counted.
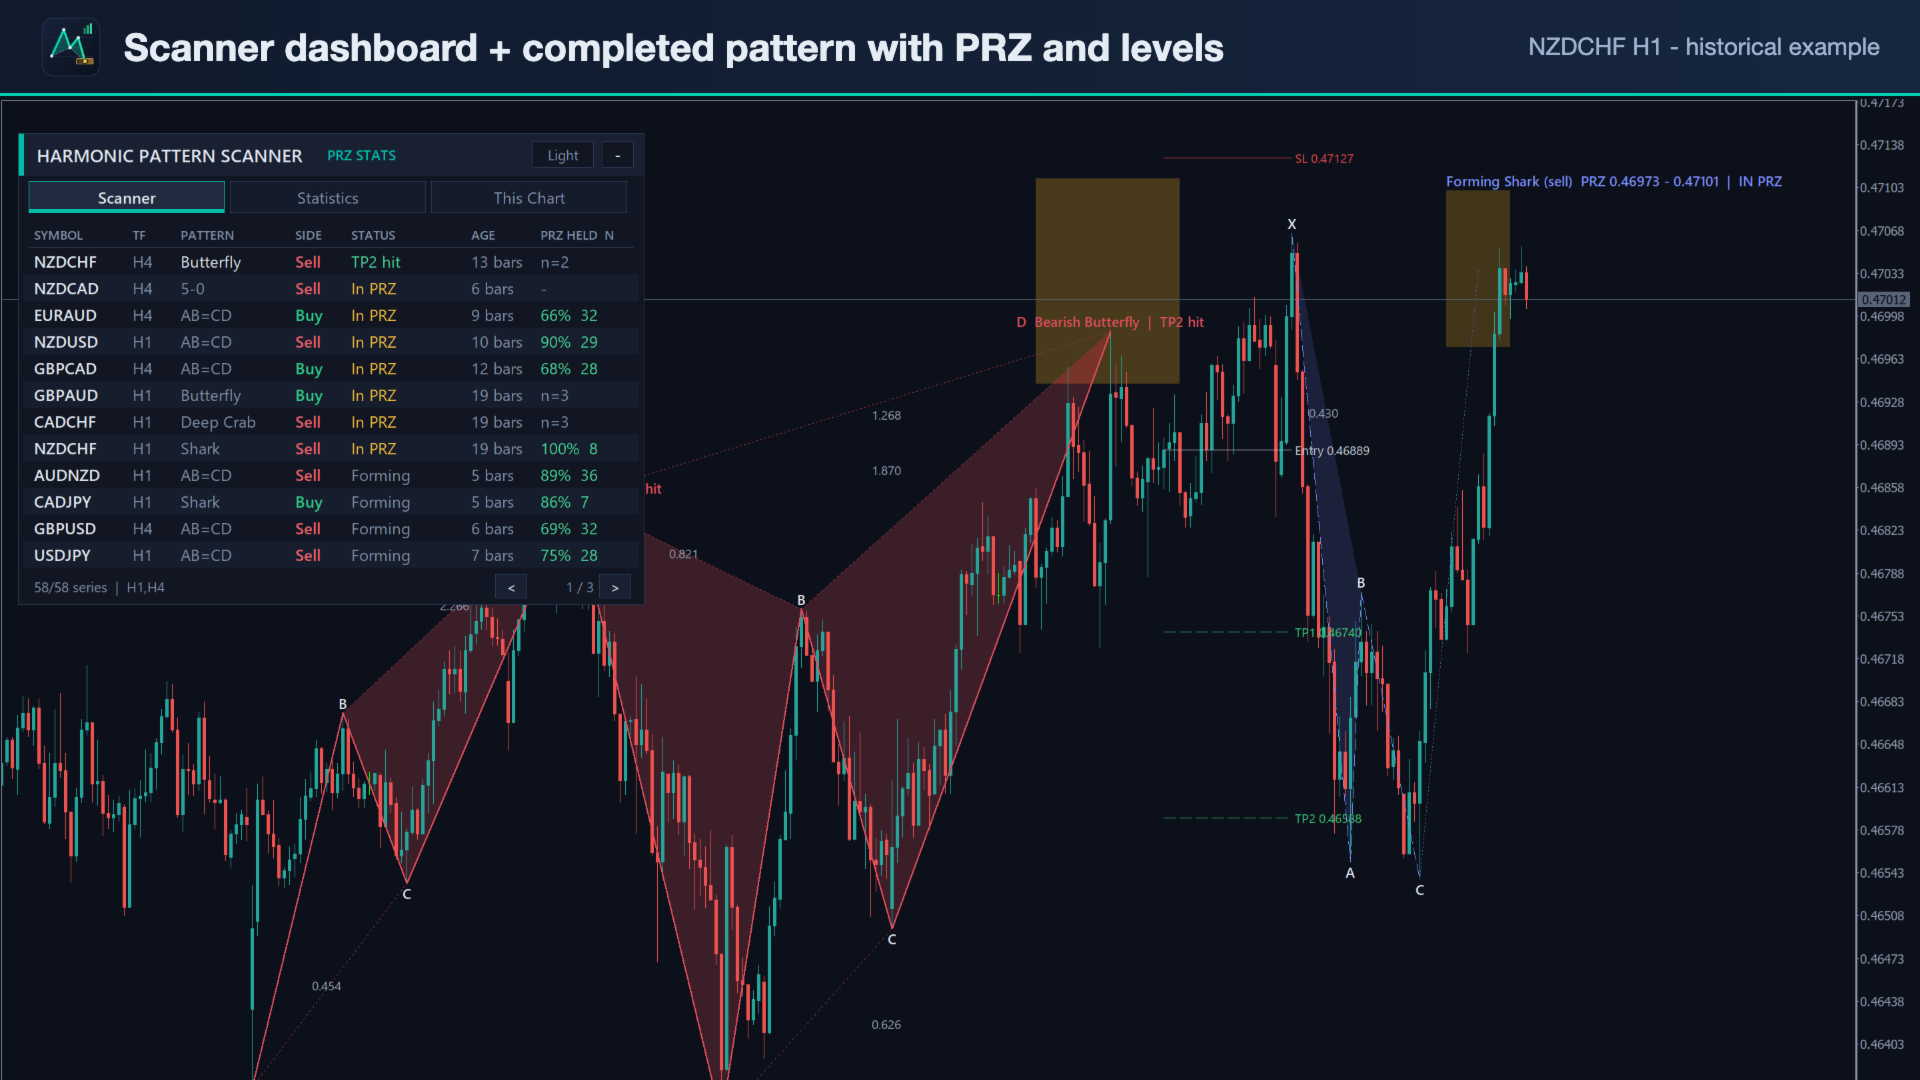
Scanner dashboard
- Scans any list of symbols (default: 28 forex pairs and gold; leave empty to use Market Watch) on any timeframes (default H1 and H4).
- Broker suffixes and prefixes are resolved automatically (EURUSD → EURUSD.a, EURUSDm, ...); a fully tradable variant is preferred.
- Rows: symbol, timeframe, pattern, side, status (Active, TP1 hit, TP2 hit, Stopped, In PRZ, Forming), age in bars and the historical PRZ hold rate of that pattern on that symbol with the number of signals.
- Completed signals newest first, then forming patterns in the PRZ, then other forming patterns. Paging for long lists.
- Click a row to open the chart (or switch this chart, input) with the pattern, PRZ and levels drawn.
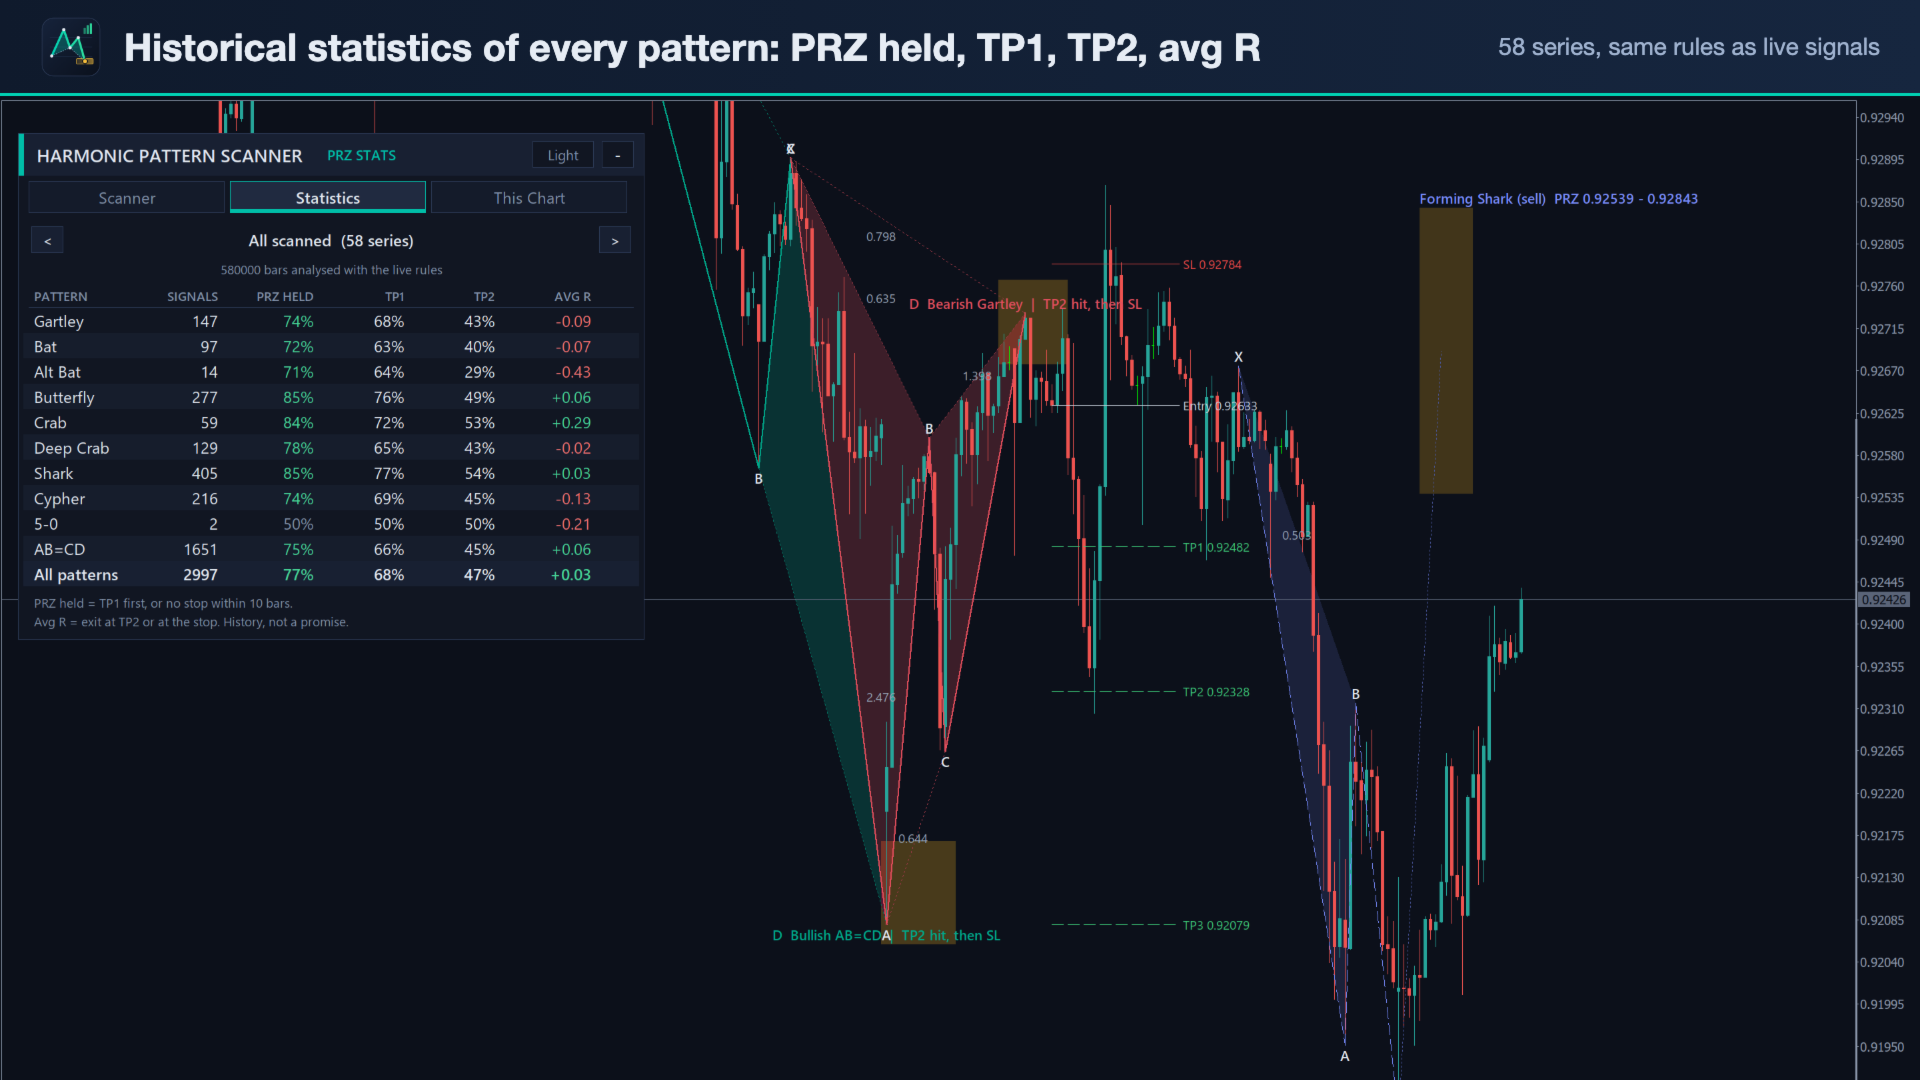
Statistics tab
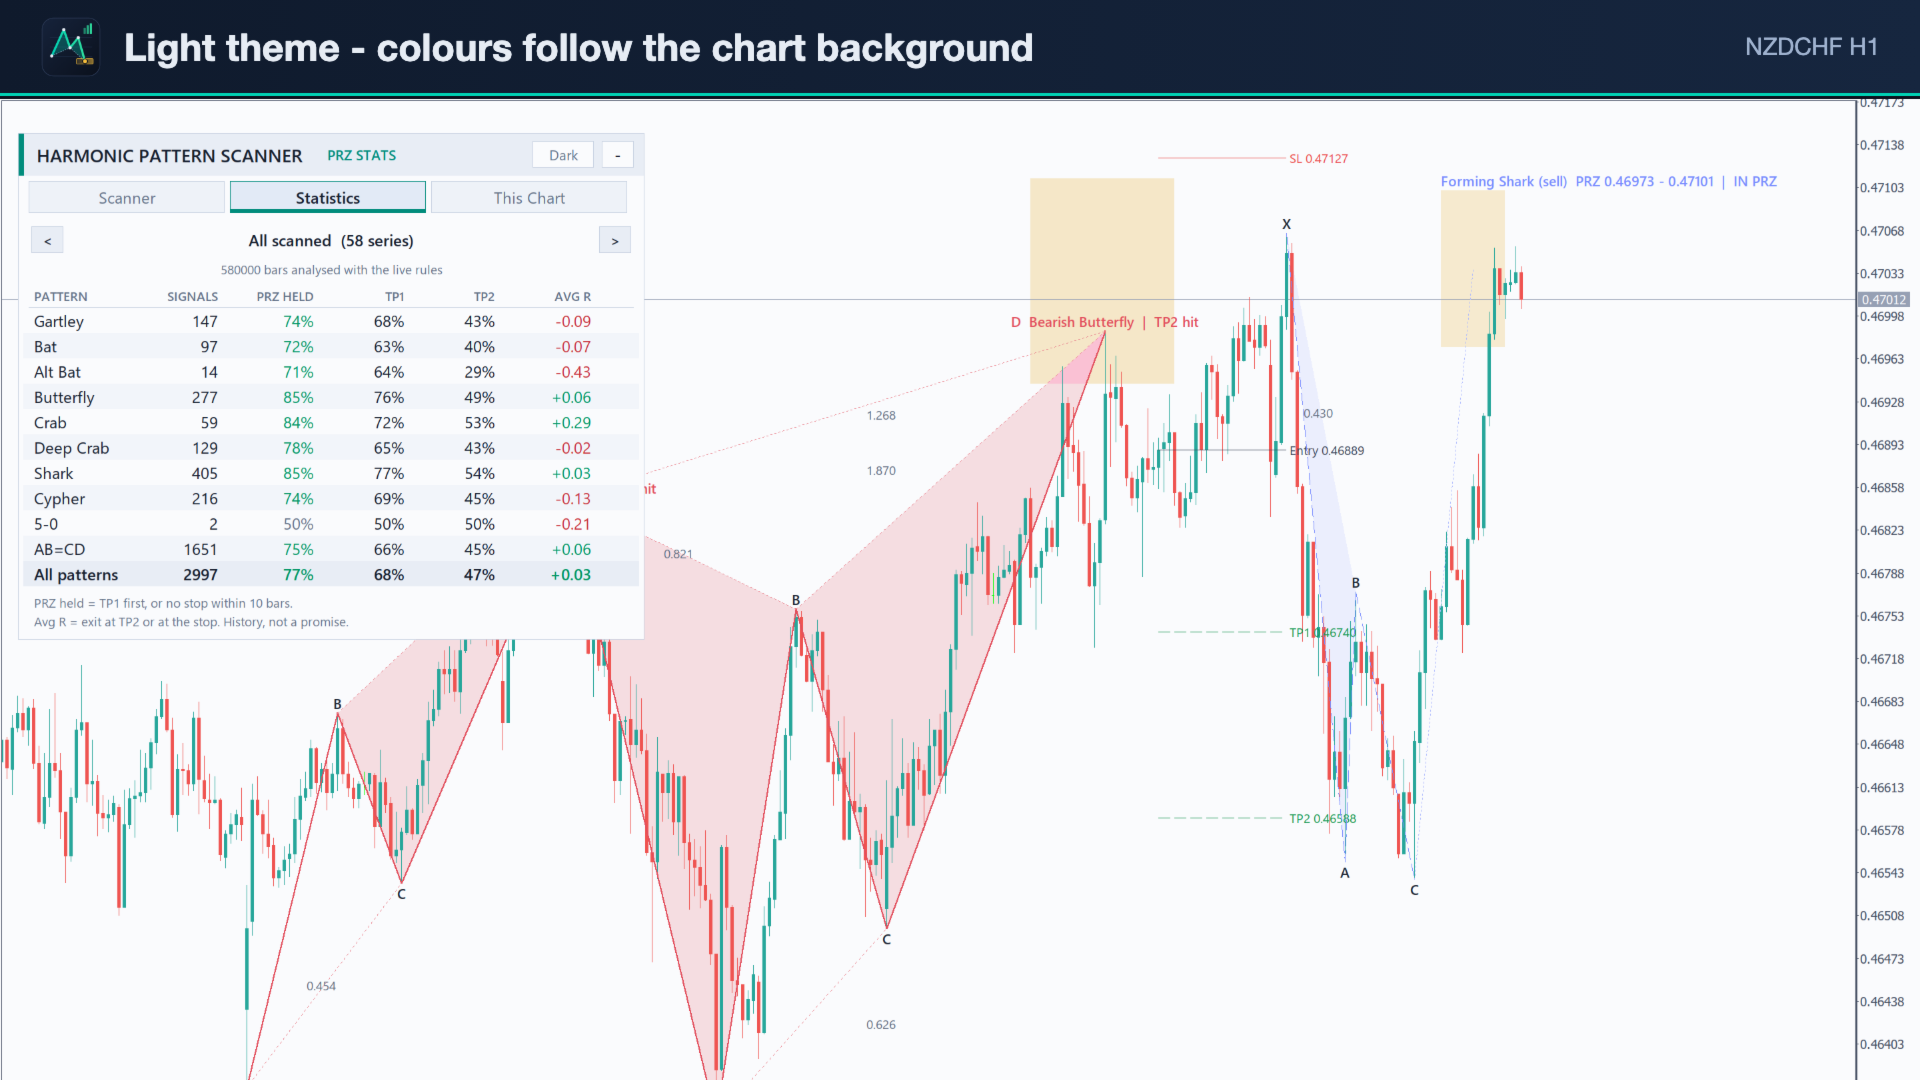
- Pattern-by-pattern table: signals, PRZ held, TP1, TP2, average R (exit at the selected target or the stop).
- Scope buttons cycle through this chart, every scanned symbol/timeframe and "All scanned".
- History Bars (default 10 000) sets how much history is analysed per symbol and timeframe.
This Chart tab
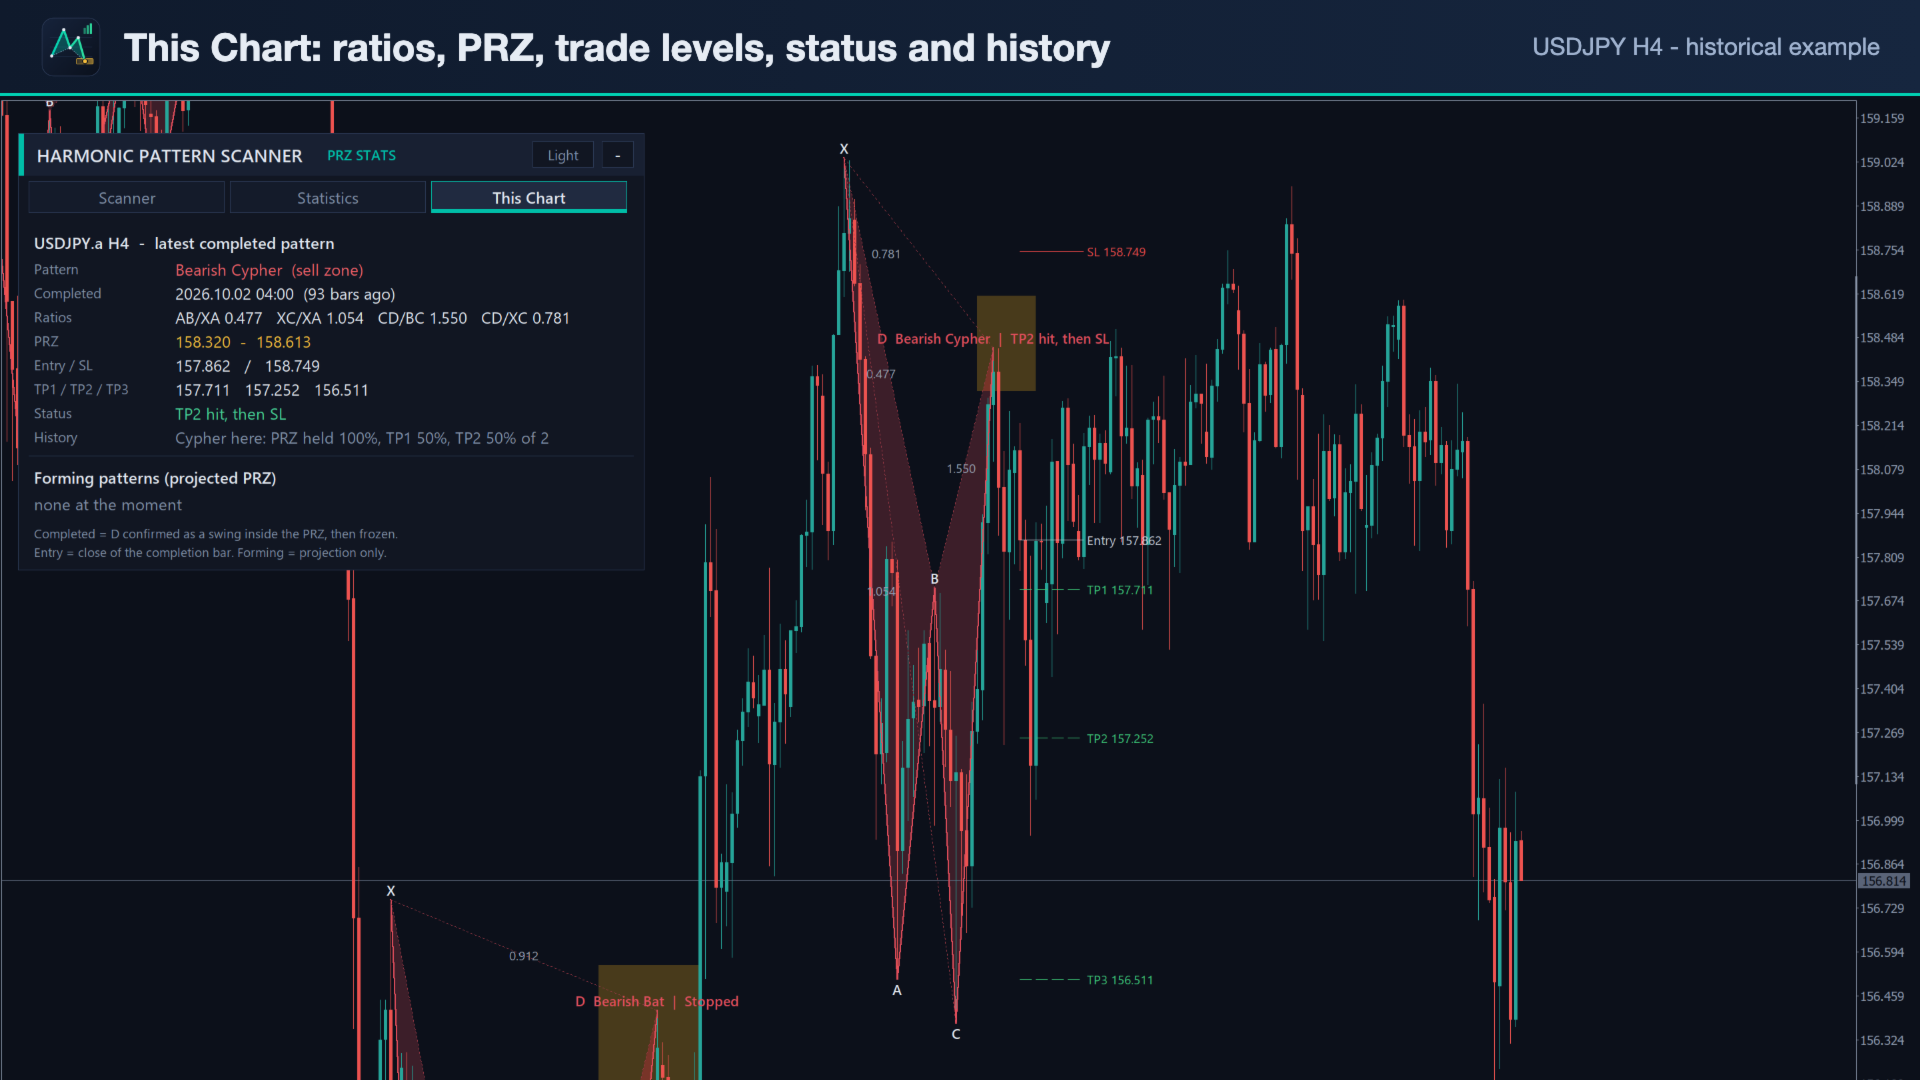
Latest completed pattern with time, measured ratios, PRZ, entry, stop, three targets, its current status and the history of that pattern on this chart; forming patterns with their projected PRZ.
Our statistics study
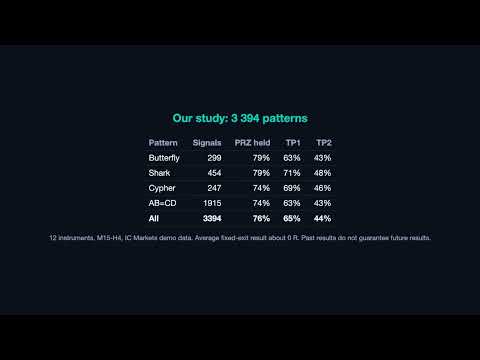
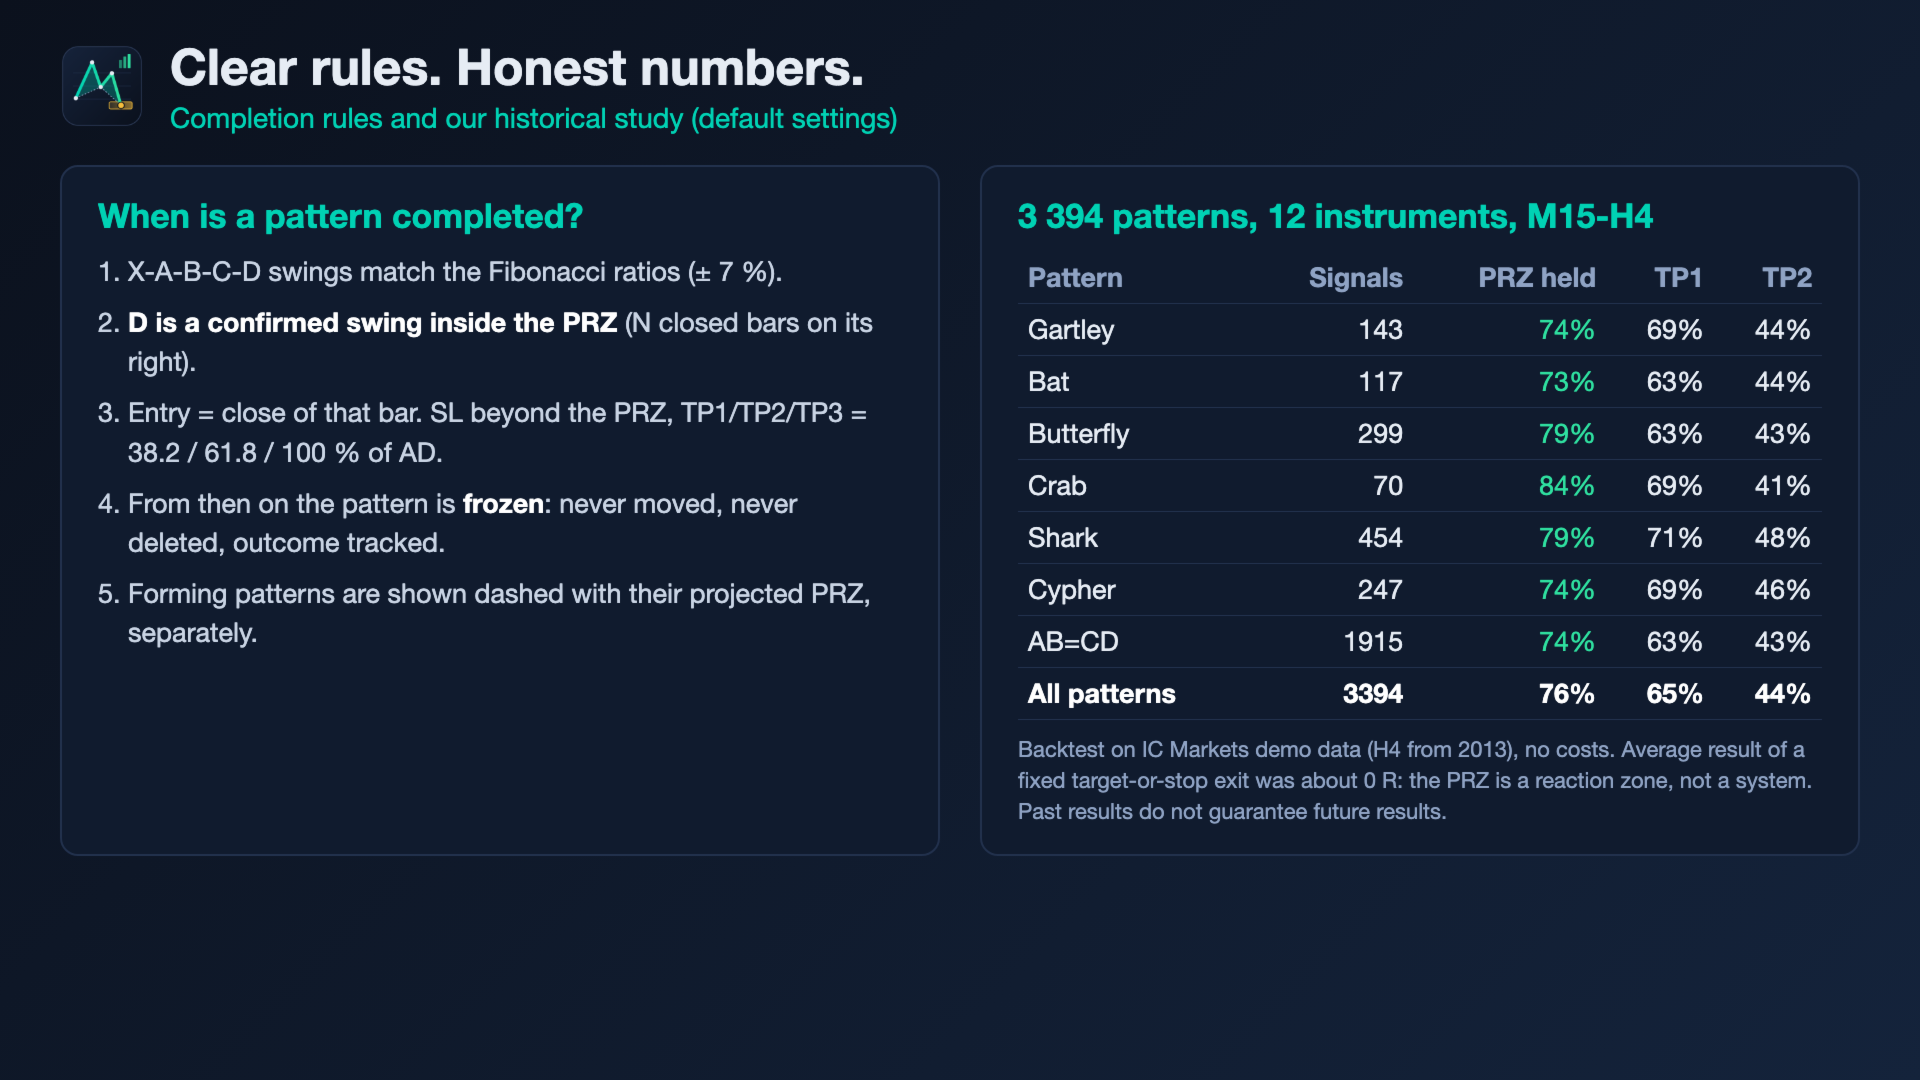
We ran the indicator's own engine with the default settings over 12 instruments (7 forex majors, EURJPY, GBPJPY, EURGBP, XAUUSD, US500) on M15, H1 and H4, 20 000 bars each (IC Markets demo data, H4 back to 2013): 3 394 completed patterns. 76 % held the PRZ, 65 % reached TP1, 44 % TP2 and 28 % TP3; the out-of-sample last 30 % of the data gave the same picture (74 % / 66 % / 44 %). The average result of a fixed "target or stop" exit was close to zero (-0.01 R) for every target: the PRZ is a zone where price often reacts, not a stand-alone trading system. Use the per-symbol statistics in the panel to see how each pattern behaved on the market you trade, and combine patterns with your own context and trade management.
| Pattern | Signals | PRZ held | TP1 | TP2 |
|---|---|---|---|---|
| Gartley | 143 | 74 % | 69 % | 44 % |
| Bat | 117 | 73 % | 63 % | 44 % |
| Butterfly | 299 | 79 % | 63 % | 43 % |
| Crab | 70 | 84 % | 69 % | 41 % |
| Deep Crab | 135 | 75 % | 61 % | 41 % |
| Shark | 454 | 79 % | 71 % | 48 % |
| Cypher | 247 | 74 % | 69 % | 46 % |
| AB=CD | 1915 | 74 % | 63 % | 43 % |
| All (incl. Alt Bat, 5-0) | 3394 | 76 % | 65 % | 44 % |
Backtest statistics describe the past on one broker's data; they are not a promise of future results.
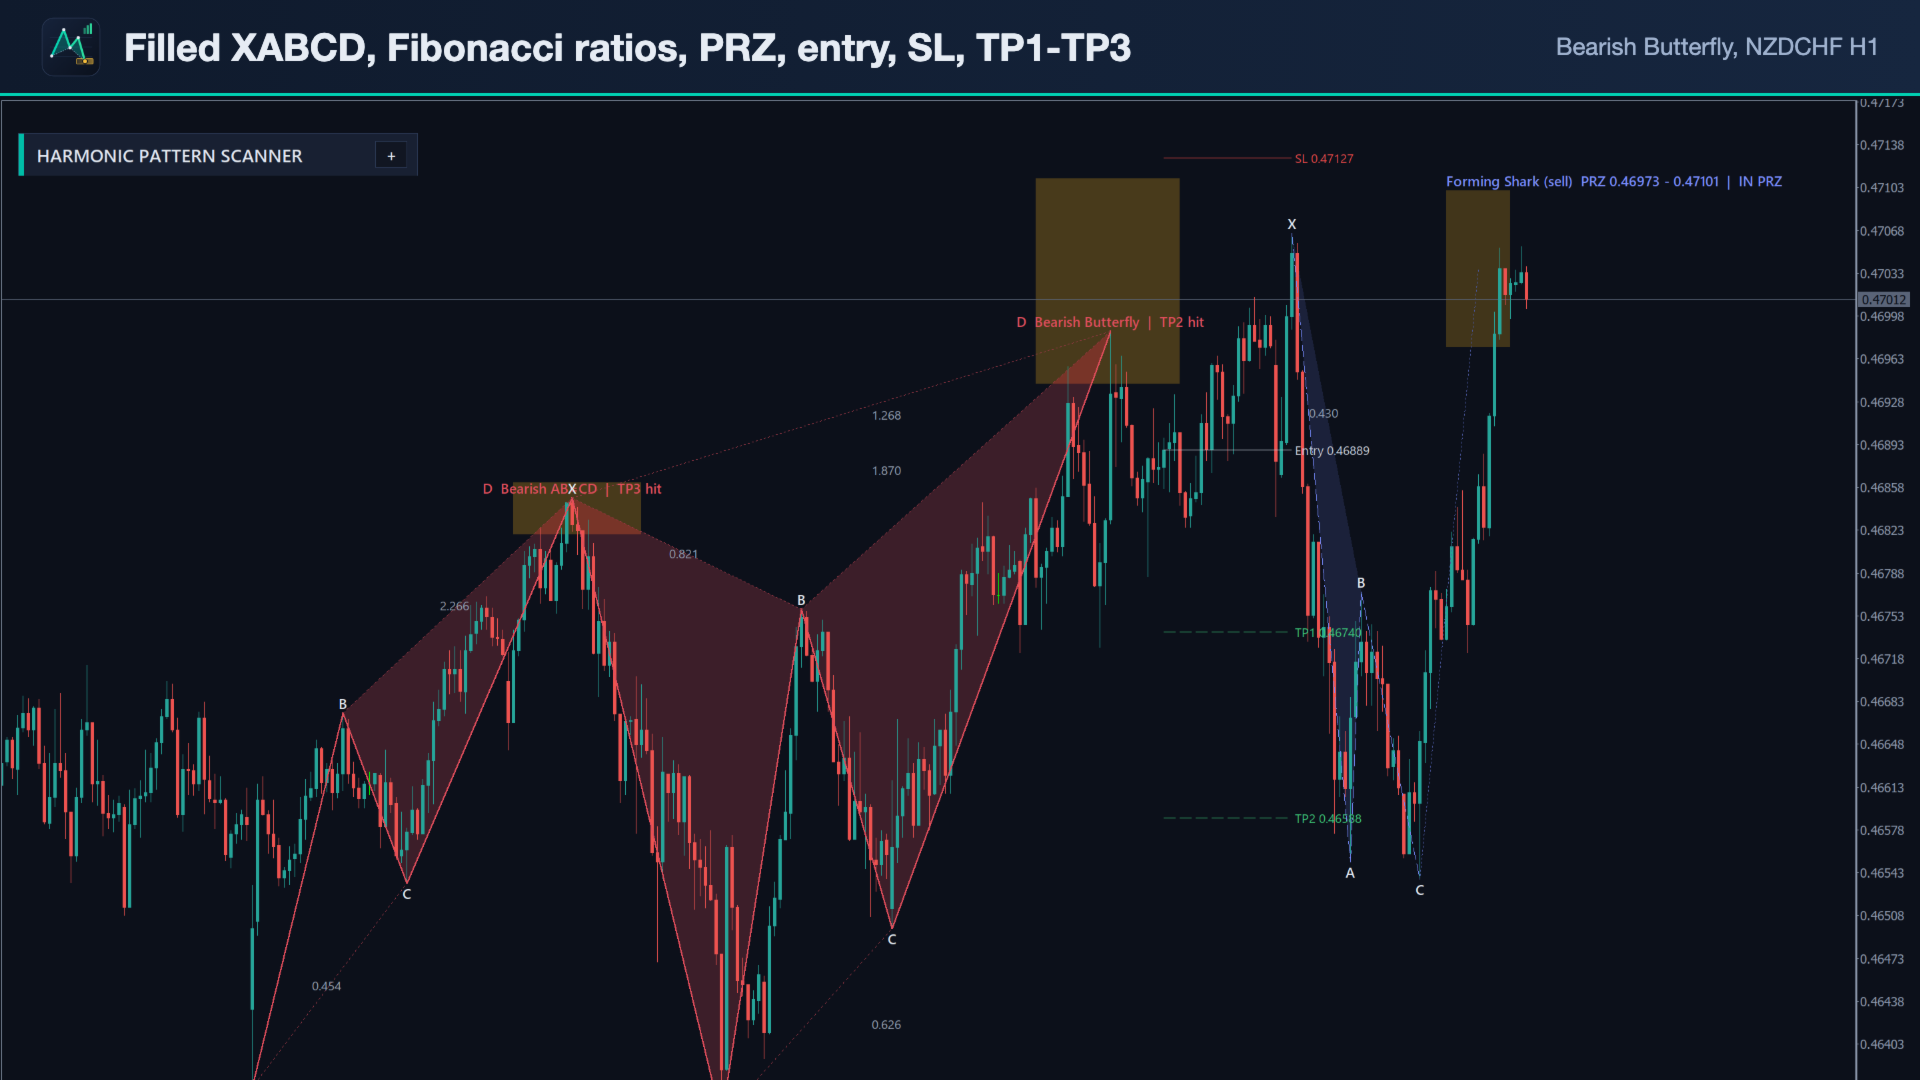
Chart drawing
- Filled XABCD triangles, legs, dotted ratio lines with the measured Fibonacci ratios, point labels, pattern name and result label on past patterns.
- PRZ box, and for the latest completed pattern entry, stop loss and TP1-TP3 lines with prices.
- Colours adapt to dark and light chart backgrounds; all colours are inputs.
Alerts
- Pattern completed (this chart and scanner symbols) and, optionally, price entered the PRZ of a forming pattern.
- Popup, push notification, e-mail and sound. The completed-pattern alert includes entry, stop, targets and the pattern's history on that symbol.
- Alerts fire only for patterns completed on the last closed bar, never for history when the indicator starts.
Panel
- Dark and light themes (Auto follows the chart background; one click toggles), sharp at 100 % and 200 % Windows scaling, adjustable font size.
- Drag the header to move it, minimise it with one click; position, tab and theme are remembered per chart.
Buffers for Expert Advisors
On the completion bar of every signal: 0 = signal (+1 buy, -1 sell), 1 = pattern type (0 Gartley, 1 Bat, 2 Alt Bat, 3 Butterfly, 4 Crab, 5 Deep Crab, 6 Shark, 7 Cypher, 8 5-0, 9 AB=CD), 2 = entry, 3 = stop loss, 4 = TP1, 5 = TP2, 6 = TP3. Empty value elsewhere. Values never change once written.
Main inputs
| Input | Default | Meaning |
|---|---|---|
| Patterns (10 switches) | all on | choose the patterns |
| Show Forming Patterns | true | projected patterns with PRZ |
| Ratio Tolerance | 7 % | wider = more patterns, less precise |
| Pattern Sizes / Swing Depth | Small + Medium / 5 | swing sizes searched |
| Minimum Swing | 0.8 × ATR | ignore tiny swings |
| Stop Loss beyond PRZ | 0.25 × ATR | stop buffer |
| TP1 / TP2 / TP3 | 0.382 / 0.618 / 1.0 | targets as a fraction of AD |
| History Bars | 10 000 | bars analysed for statistics |
| PRZ held bars | 10 | hold period for the PRZ hold rate |
| Symbols / Timeframes | 28 pairs + XAUUSD / H1,H4 | scanner list |
| Show completed signals up to | 20 bars | age limit in the scanner |
| Row Click | open chart | or switch this chart |
| Alerts | completed: popup | popup, push, e-mail, sound, PRZ alert |
| Theme / Font Size | Auto / 9 | panel look |
Example settings
- Swing trading: Timeframes "H4,D1", Pattern Sizes Small + Medium + Large, Ratio Tolerance 7 %.
- Intraday: Timeframes "M15,H1", Swing Depth 4, Minimum Swing 1.0.
- Strict textbook patterns: Ratio Tolerance 5 %, AB=CD off.
Installation
- Buy or rent the indicator; it appears in the Navigator under Indicators → Market.
- Drag it onto any chart. Open the Inputs tab to change the symbols, timeframes, patterns or alerts.
- For push alerts enter your MetaQuotes ID in Tools → Options → Notifications; for e-mail fill Tools → Options → Email.
- The first scan loads history for every symbol; this can take a minute on the first start.
The free demo runs in the Strategy Tester; there the scanner covers only the tested symbol.
Notes
- Works on any symbol and timeframe: forex, metals, indices, crypto.
- The indicator does not trade. Harmonic patterns are an analysis tool; use your own risk management.