EMA Adaptive Enveloper
- Indicators
- Version: 1.10

Adaptive EMA Envelope
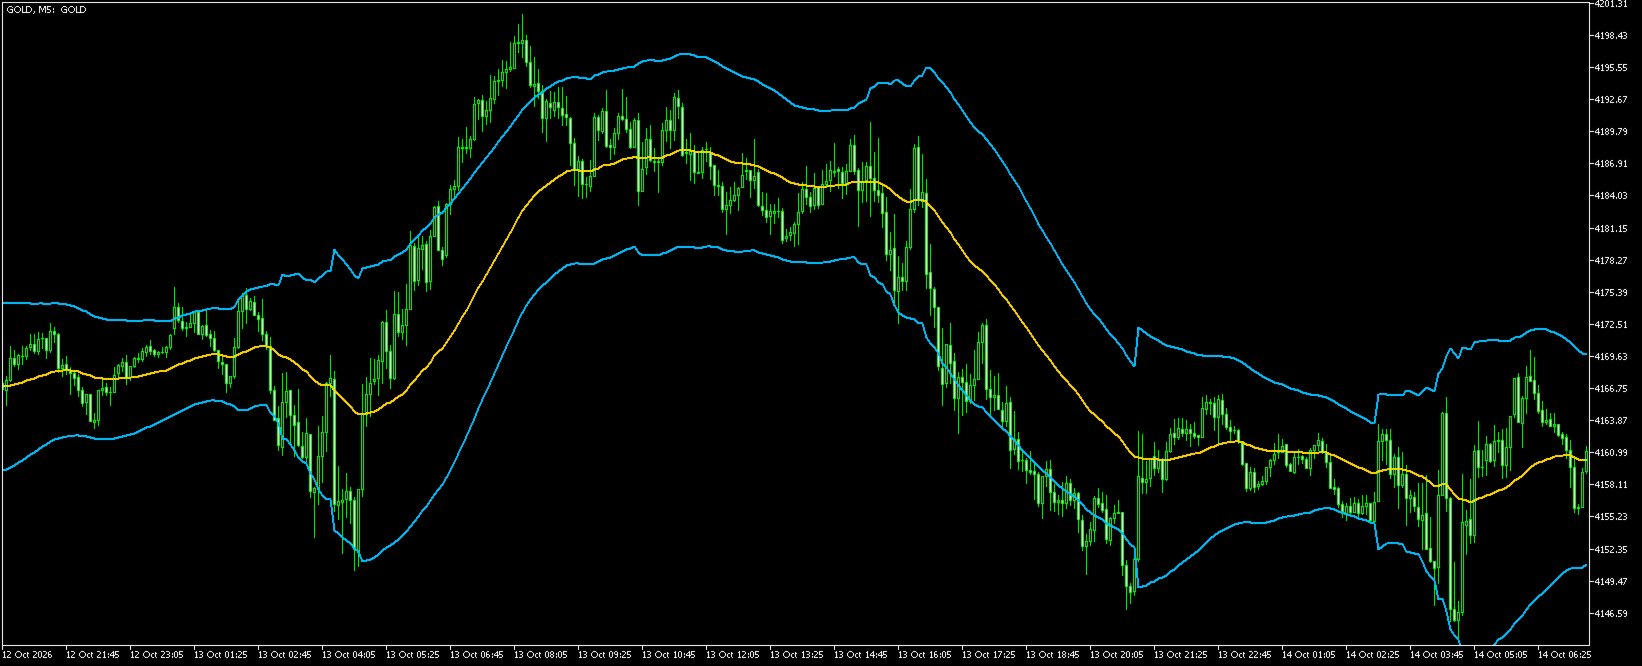
Adaptive EMA Envelope draws an exponential moving average and two symmetrical volatility bands on the main MetaTrader 5 chart. It uses the chart symbol and timeframe without symbol-specific presets.
The center line is an EMA of closing prices. The band distance uses Wilder-smoothed Average True Range. A separate True Range component allows the envelope to respond to sudden changes in a candle's range. Expansion response and contraction smoothing can be adjusted independently.
The default expansion response is immediate. With the default contraction period, the band distance decreases gradually as volatility subsides. The envelope can help users inspect price location relative to a moving average and changing volatility. A band touch or crossing does not confirm a reversal.
Parameters
- EMA period: closing-price EMA period; default 50.
- ATR period: Wilder ATR period; default 14.
- ATR width multiplier: baseline distance from the EMA; default 2.5.
- True Range shock multiplier: additional response to the current candle's True Range; default 1.0. Set to zero to disable this component.
- Expansion response: fraction of an increase in target width applied per candle; default 1.0. Valid values are greater than zero and no greater than one.
- Contraction smoothing period: controls how slowly width contracts; default 20. Larger values produce slower contraction.
Line colors, widths and styles can be changed in the indicator's Colors tab.
Calculation
The target half-width is the greater of ATR multiplied by the ATR width multiplier and True Range multiplied by the shock multiplier. The actual width moves toward this target using the expansion response when increasing and 2 divided by the contraction period plus 1 when decreasing. Upper and lower bands are the EMA plus and minus this width.
EMA is seeded from the first available closing price. ATR is seeded from the average of the first complete True Range observations. No lines are published during the initial warm-up period.
Behavior
The indicator uses current and historical data, without future candles. Values on the open candle change as prices arrive. Closed-candle values remain unchanged as new prices arrive when the historical dataset and settings remain unchanged. Changing settings, loading a different historical starting point or correcting broker history can change the calculated history.
The final band value of a closed candle includes that candle's high, low and close. It must not be treated as a level known before that candle completed. The indicator can be crossed during sustained trends or abrupt moves; it does not guarantee that prices remain within the envelope.
The indicator does not place trades or generate trade alerts. It requires sufficient chart history for the selected periods. Default settings are starting values, not optimized settings for every market. No profitability or trading outcome is promised.