Indicator Truth Lab
- Utilities
-
Geoffrey Pierre Manuel Gonzalez
 Northline Algo — clean, honest tools for MetaTrader 5.
Northline Algo was founded by a trader with more than 15 years of market experience. We build the tools we want to use ourselves.
We design indicators and Expert Advisors from scratch in MQL5, with three rules: - Version: 1.0
- Activations: 10
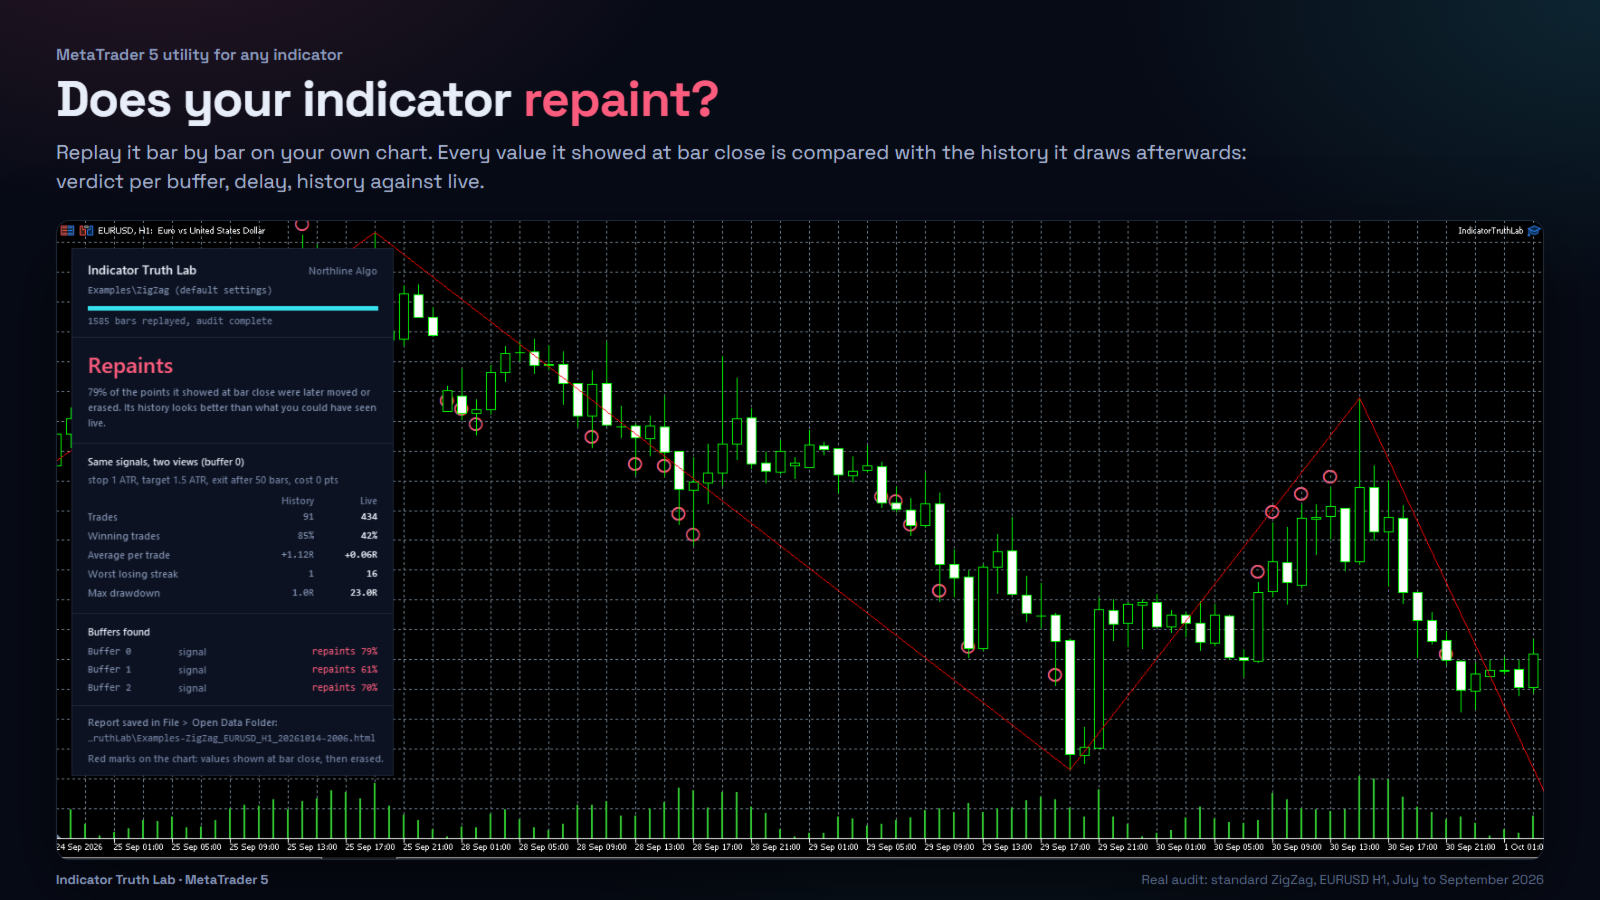
Does your indicator repaint? Audit any MT5 indicator on your own chart: it is replayed bar by bar, as if live, and every value it showed at bar close is compared with the history it draws afterwards. You get a verdict per buffer, the delay of its signals, and its results as the history shows them next to what you could have seen live.
Overview
Most indicators are judged on their history. But many of them redraw that history: an arrow that appeared live is erased a few bars later, a pivot moves, a line is recalculated. Others draw their signals on a bar that was already closed when the signal appeared. In both cases the history looks better than anything a trader could have used in real time.
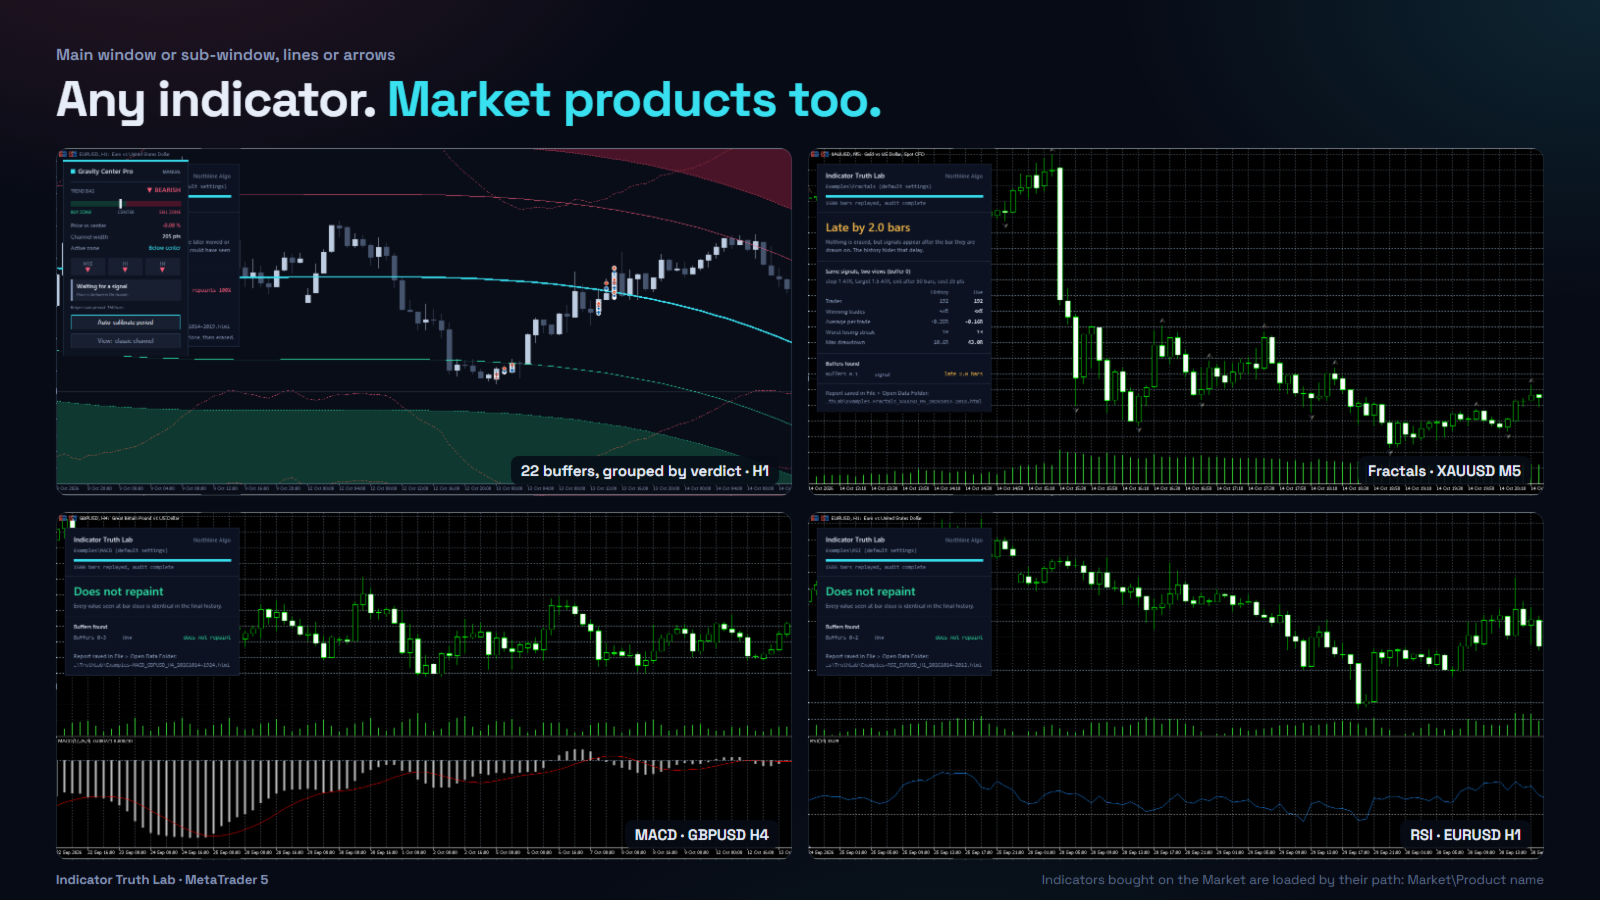
Indicator Truth Lab checks this for you, on any indicator you own, including indicators bought on the Market. It copies the chart history to a temporary symbol and feeds it bar by bar. The audited indicator recalculates exactly as it would live. At each bar close the value of every buffer is recorded, then compared with the final history at the end of the audit.
The tool gives no trading signal and makes no forecast. It measures.
What you get
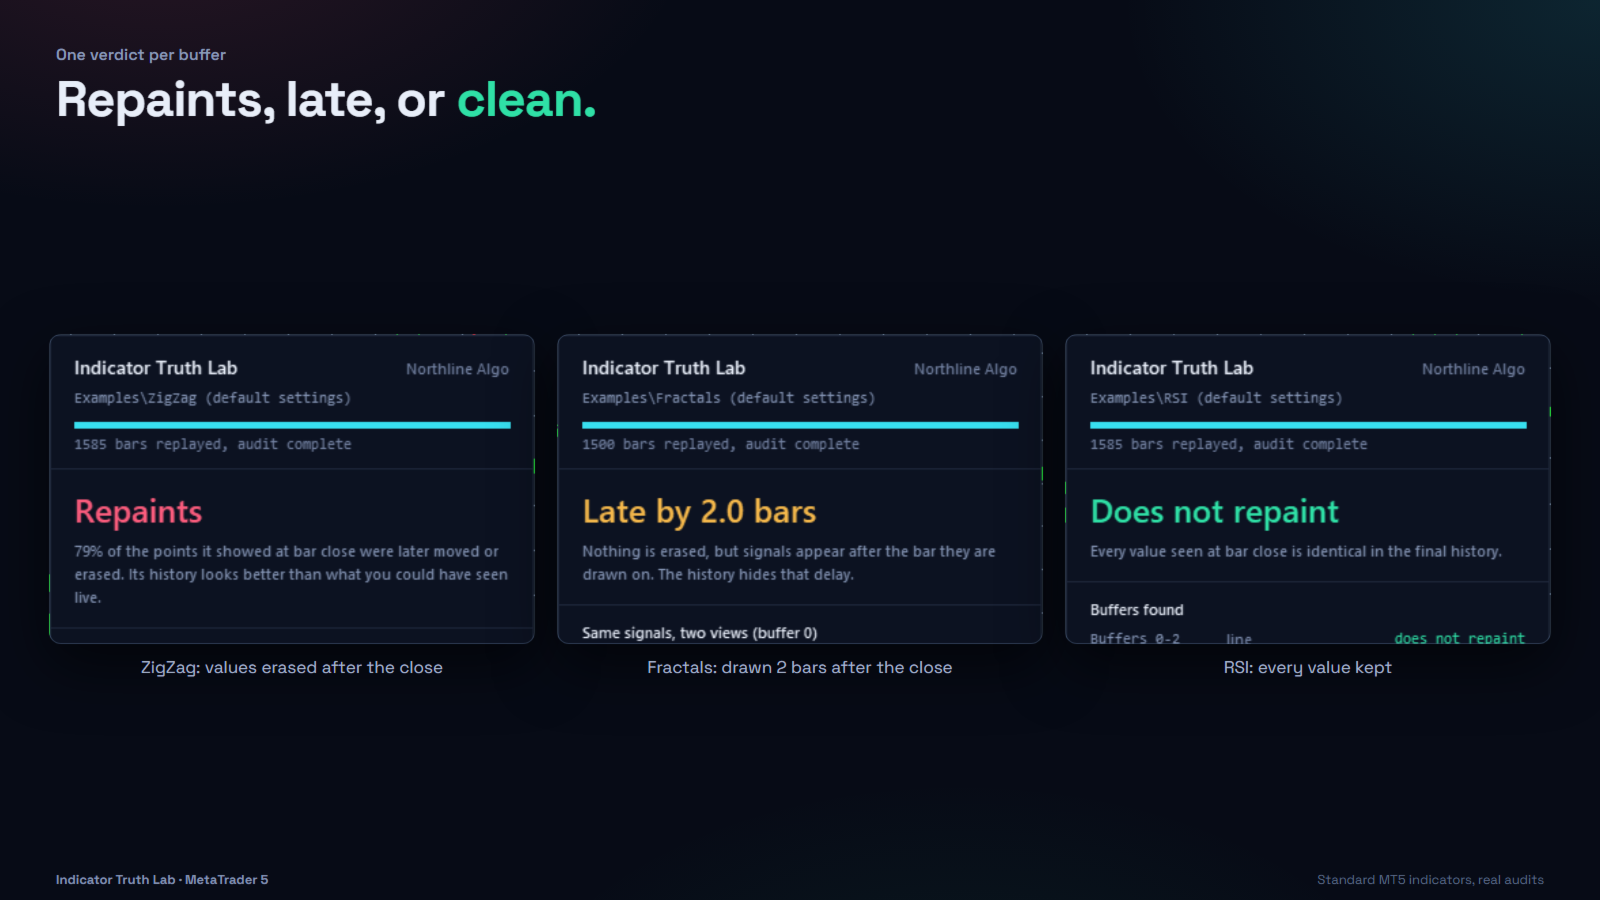
- A verdict for every buffer: does not repaint, late by N bars (average and maximum), or repaints (share of the values that were moved or erased)
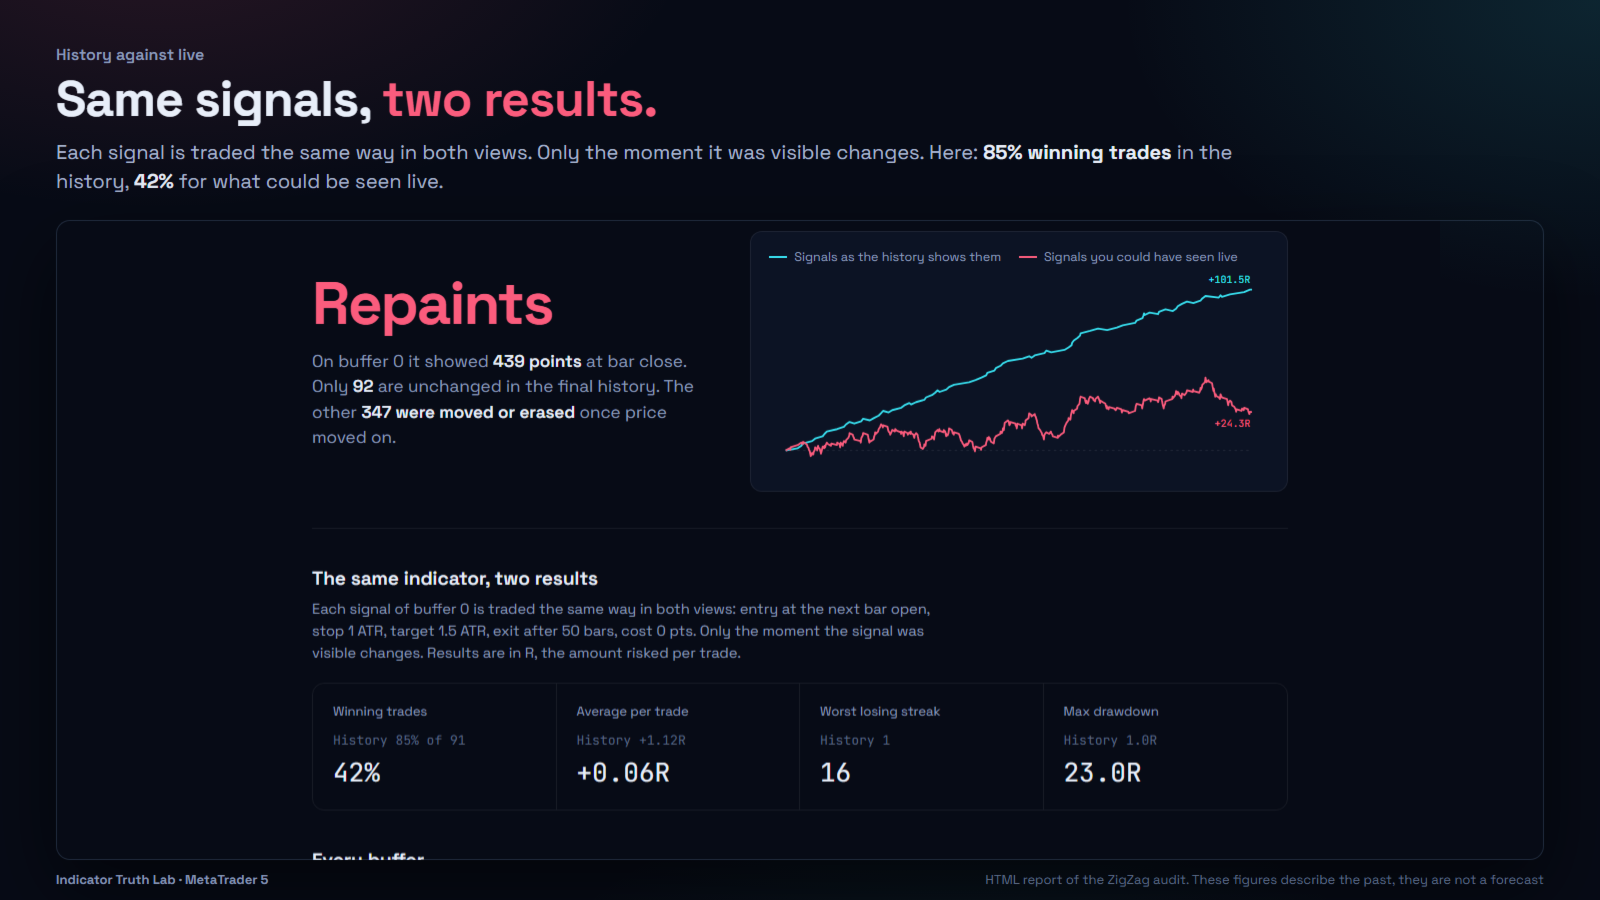
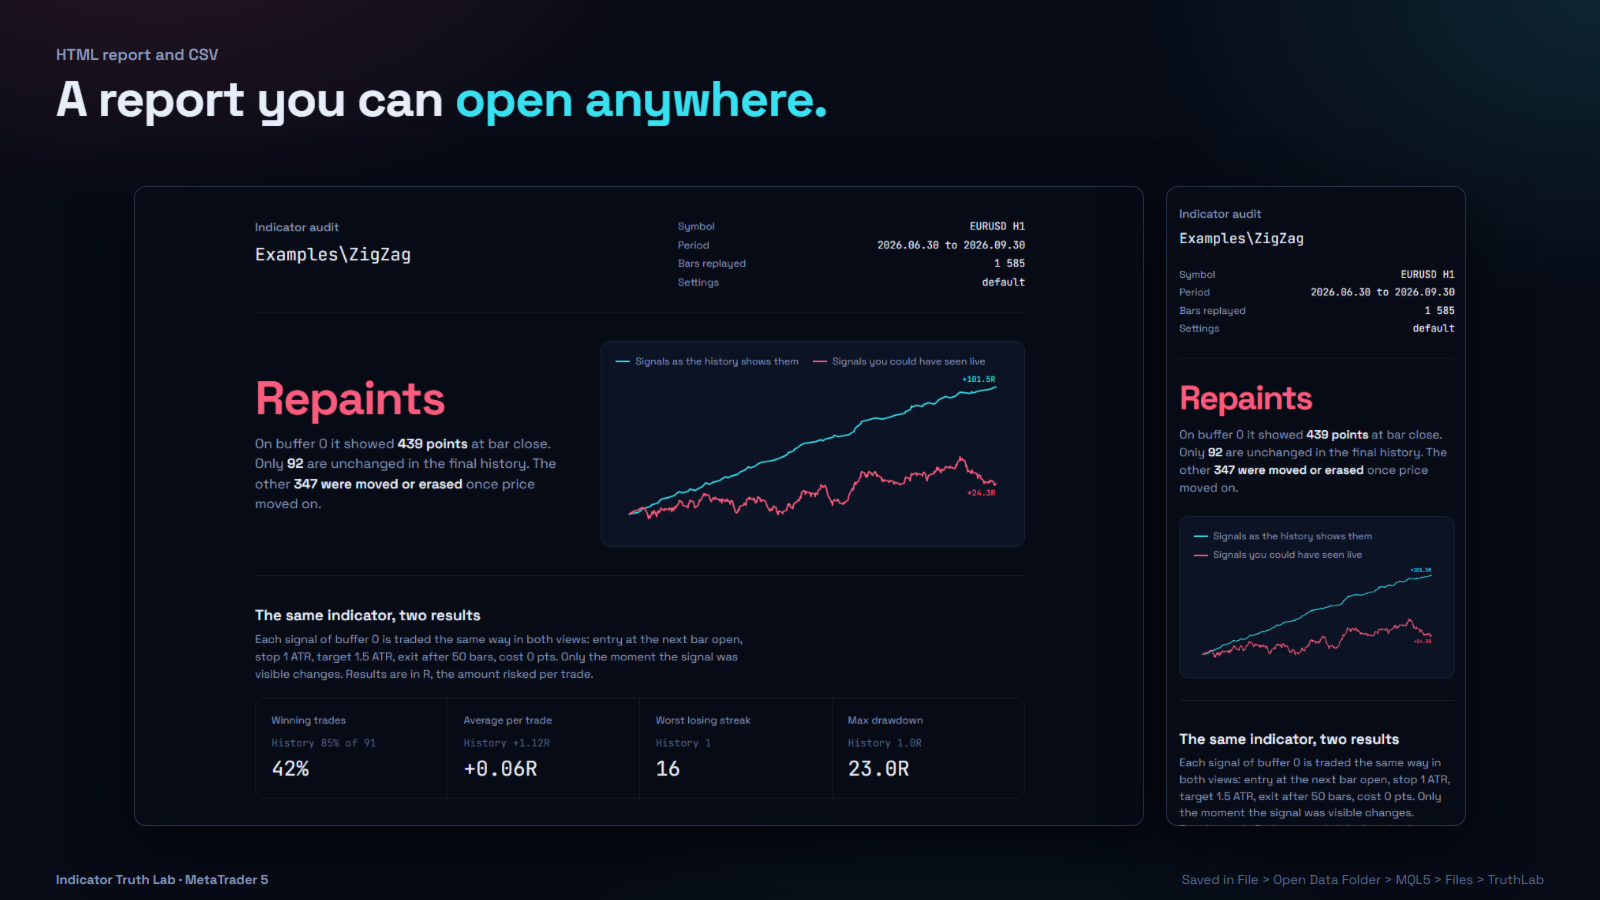
- History against live, for signal buffers: each signal is traded the same way in both views (entry at the next bar open, stop and target in ATR or in points, exit after N bars, spread and commission deducted). Number of trades, winning trades, average result per trade, worst losing streak and maximum drawdown, all in R
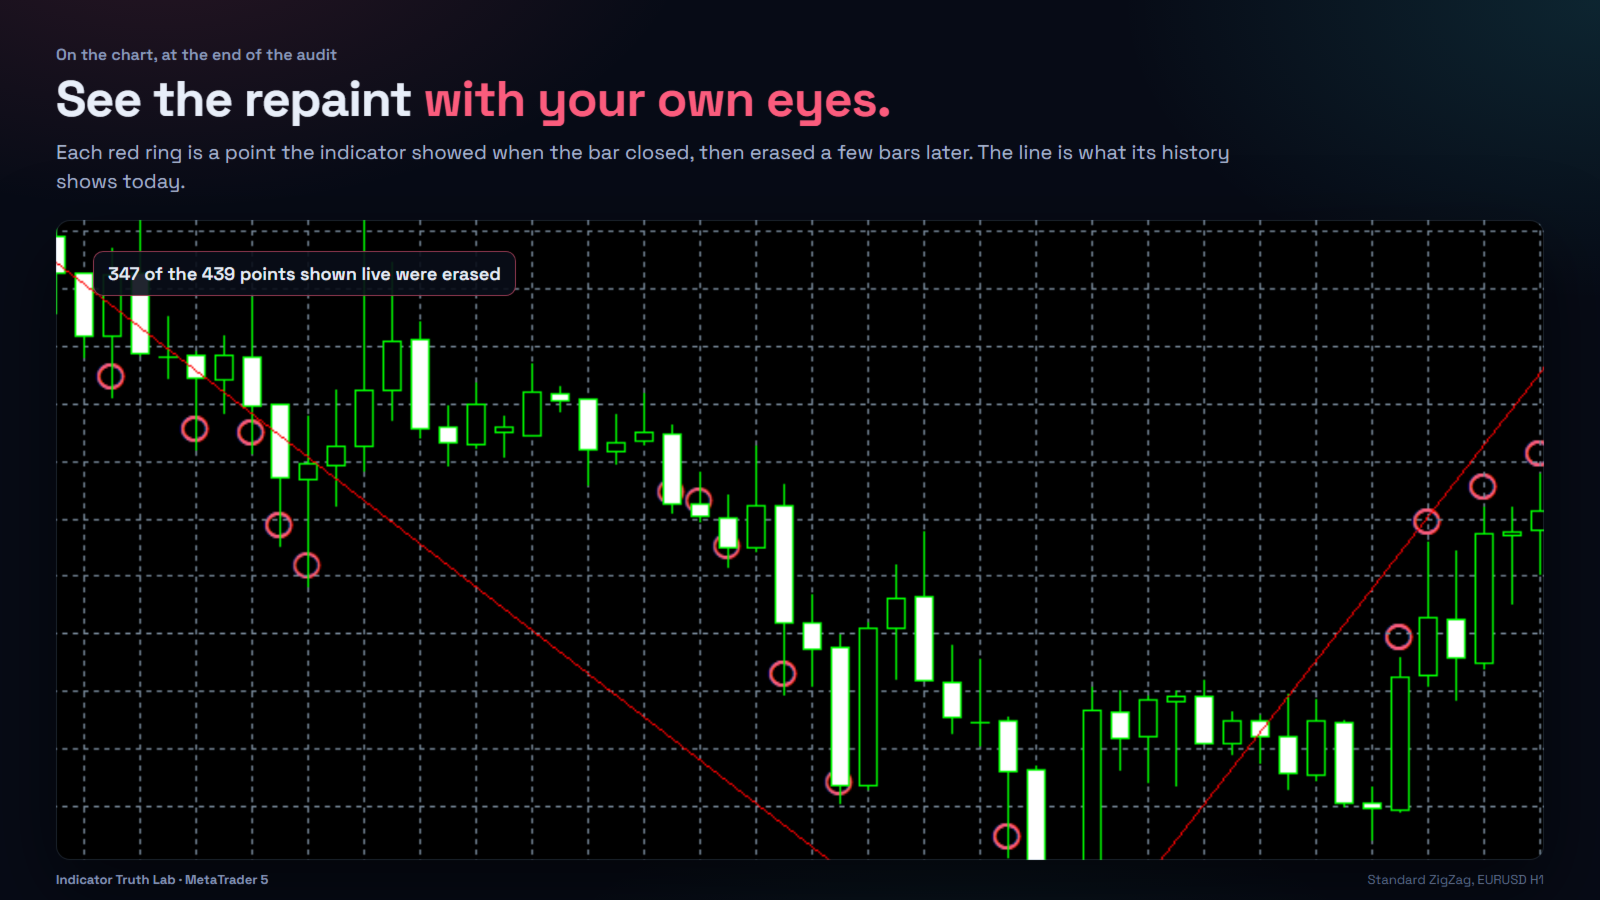
- On the chart: the audited indicator is added at the end of the audit, and every value that was shown at bar close and then erased or moved is marked in red, so you can see the repaint with your own eyes
- A live panel that fills in during the replay, then summarizes the audit
- An HTML report you can open on a computer or a phone and share, plus a CSV file
How to use it
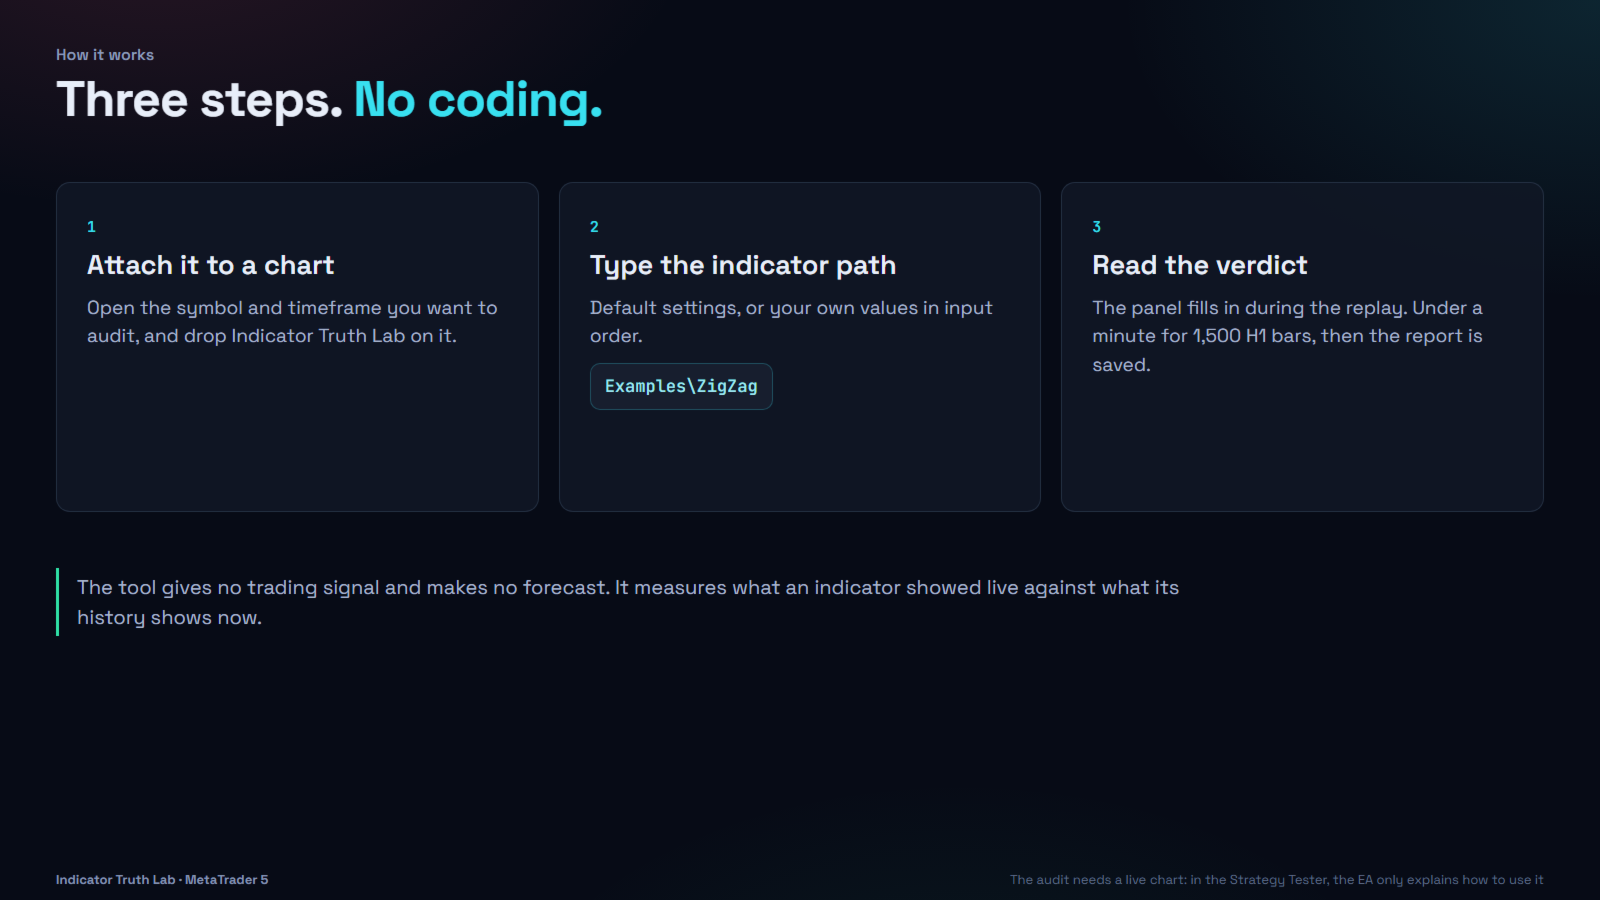
- Open a chart of the symbol and timeframe you want to audit.
- Attach Indicator Truth Lab to the chart (it is an Expert Advisor; no trading permission is needed on a live chart).
- Enter the path of the indicator, relative to the MQL5\Indicators folder: for example Examples\ZigZag, or Market\<product name> for a Market product.
- Optionally enter its settings, then press OK. The panel shows the progress and the time left. On H1, 1,500 bars take less than a minute; the verdict is then on the panel and the report is saved in File > Open Data Folder > MQL5 > Files > TruthLab.
Parameters
- Indicator to audit: path, settings (in the order of the indicator's inputs, comma separated; empty = defaults)
- Audit period: number of bars, or start and end dates
- Buffers: all, or a list (0,2); signal direction auto, or per buffer (0:buy,1:sell)
- Trade model for the statistics: stop and target in ATR(14) multiples or in points, exit after N bars, cost per trade in points (default: current spread)
- Display: add the audited indicator to the chart, mark the erased values
- Advanced: warm-up bars, observation window, replay speed
Good to know
- Settings of an indicator: enter one value per input, in order. A section title in the indicator's inputs (input group) also counts as one value: type any word, for example grp.
- Signal direction: an arrow above the high is read as a sell, below the low as a buy. If an indicator places its arrows elsewhere, set the direction in the inputs.
- History: the chart needs the audited bars plus at least 200 earlier bars, so the indicator can warm up (1,000 by default, reduced automatically when the history is shorter).
- Indicators that draw only with chart objects (no buffers) cannot be read in this version.
- The statistics describe the past on the audited symbol and period. They are not a forecast, and a non-repainting indicator is not a profitable indicator: it is an honest one.
About the Strategy Tester and the demo
The audit needs a temporary custom symbol, which the Strategy Tester does not provide. In the tester (and therefore in the free demo) the EA only displays how to use it, and opens one minimum-size demonstration position per day so the tester has something to show. To see the tool at work, watch the video or rent it for one month.
Indicator Truth Lab is made by Northline Algo.