Volatility Range Compass
- Indicators
- Version: 1.0
- Activations: 5

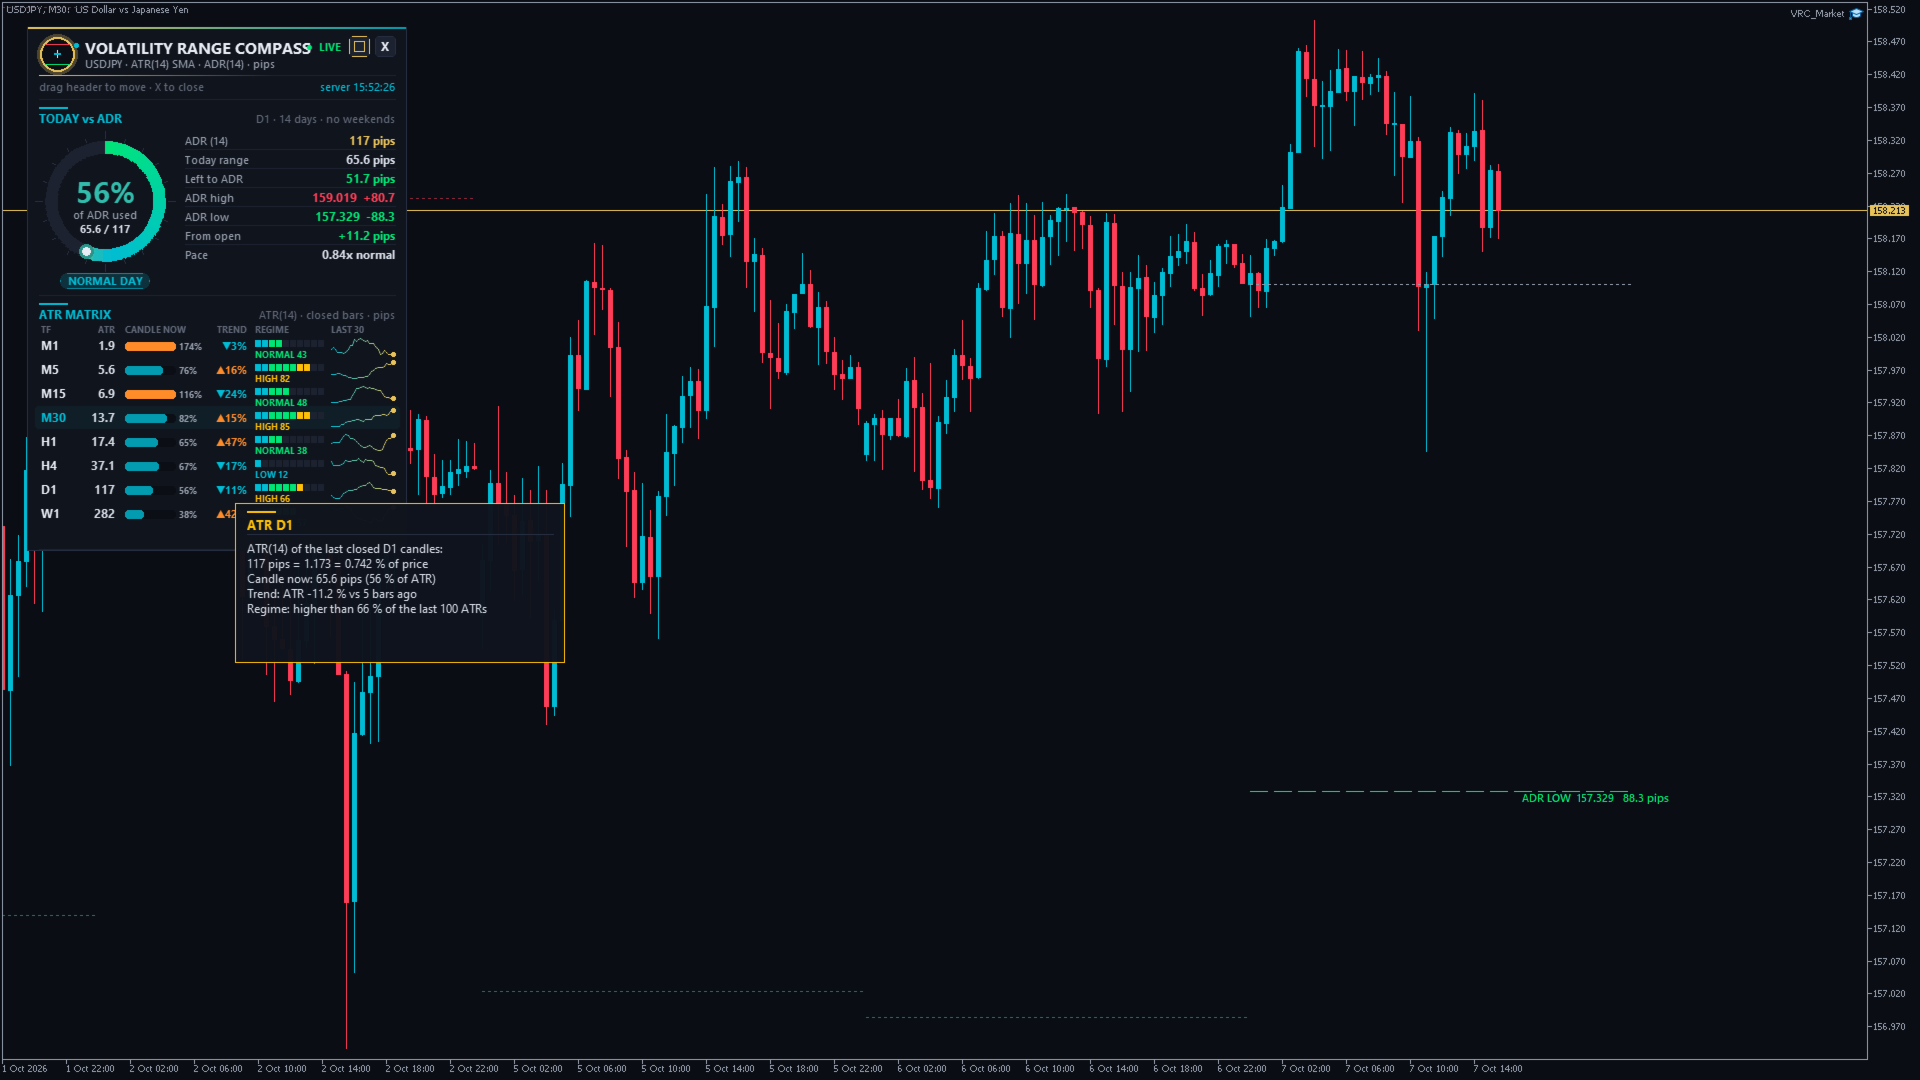
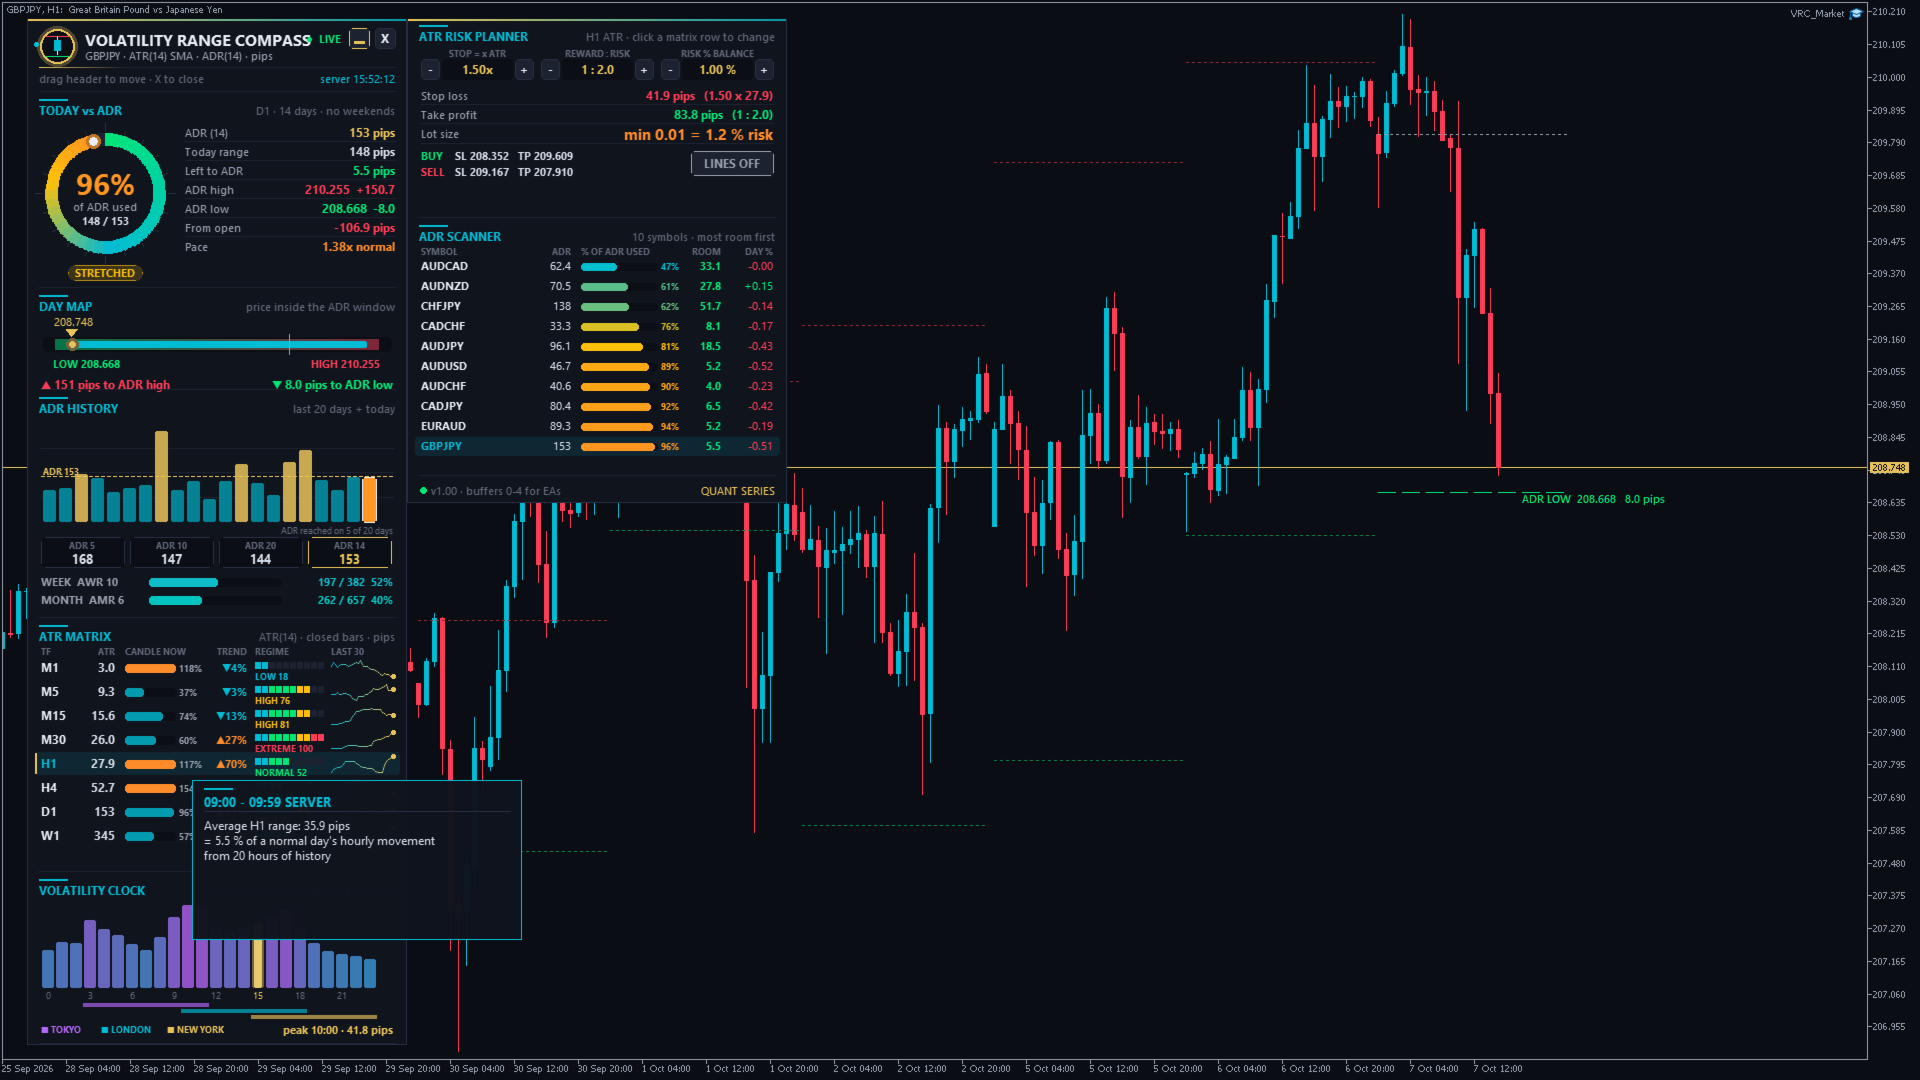
Volatility Range Compass is a volatility dashboard for MetaTrader 5. It answers the questions every trader has before entering a trade:
- How far does this market normally move in a day, a week, a month? (ADR, AWR, AMR)
- How much of today's normal move is already done, and is there still room? (% of ADR used, ADR targets)
- How volatile is each timeframe right now compared with its own history? (ATR matrix M1 to W1 with regime)
- Which hours of the day move the most? (volatility clock)
- How big should my stop be, and which lot size keeps my risk at exactly 1 %? (ATR risk planner)
- Which of my symbols still has the most room today? (ADR scanner)
Everything is calculated from the price history of your broker. There are no external servers, DLLs or internet connections. The indicator never opens or closes trades.
■ The terms in 30 seconds
- ATR (Average True Range) = the average size of the last N candles (default 14), including gaps. An H1 ATR of 12 pips means an H1 candle is usually about 12 pips tall.
- ADR (Average Daily Range) = the average distance between the daily high and the daily low over the last N completed days (default 14). Weekend candles are skipped by default.
- AWR / AMR = the same for weeks (default 10) and months (default 6).
- ADR high target = today's low + ADR. If price keeps rising, a normal day usually ends around this level.
- ADR low target = today's high - ADR. If price keeps falling, a normal day usually ends around this level.
- % of ADR used = today's range (high - low) divided by the ADR. 100 % = today has already moved as much as an average day.
■ Installation and first start
- After the purchase, the indicator appears in the MetaTrader 5 Navigator under Indicators > Market.
- Drag Volatility Range Compass onto any chart (forex, gold, silver, indices, crypto, any timeframe).
- Click OK. The default settings work for every symbol, so you do not need to change anything.
- On the first start the indicator loads the history of all timeframes (M1 to W1). Depending on your broker this takes a few seconds. Sections that are still loading show LOADING.
- Drag the dashboard by its header to any place on the chart. Position and settings are remembered for each chart.
■ The dashboard, section by section
1. Header
Symbol, ATR period and method, ADR period and the unit used (pips or points). The dot shows LIVE or LOADING and the server time is shown on the right. Buttons: ▭ switches between the full dashboard and the compact panel, and X folds the dashboard into a small pill. Click the pill to open the dashboard again.
2. Today vs ADR
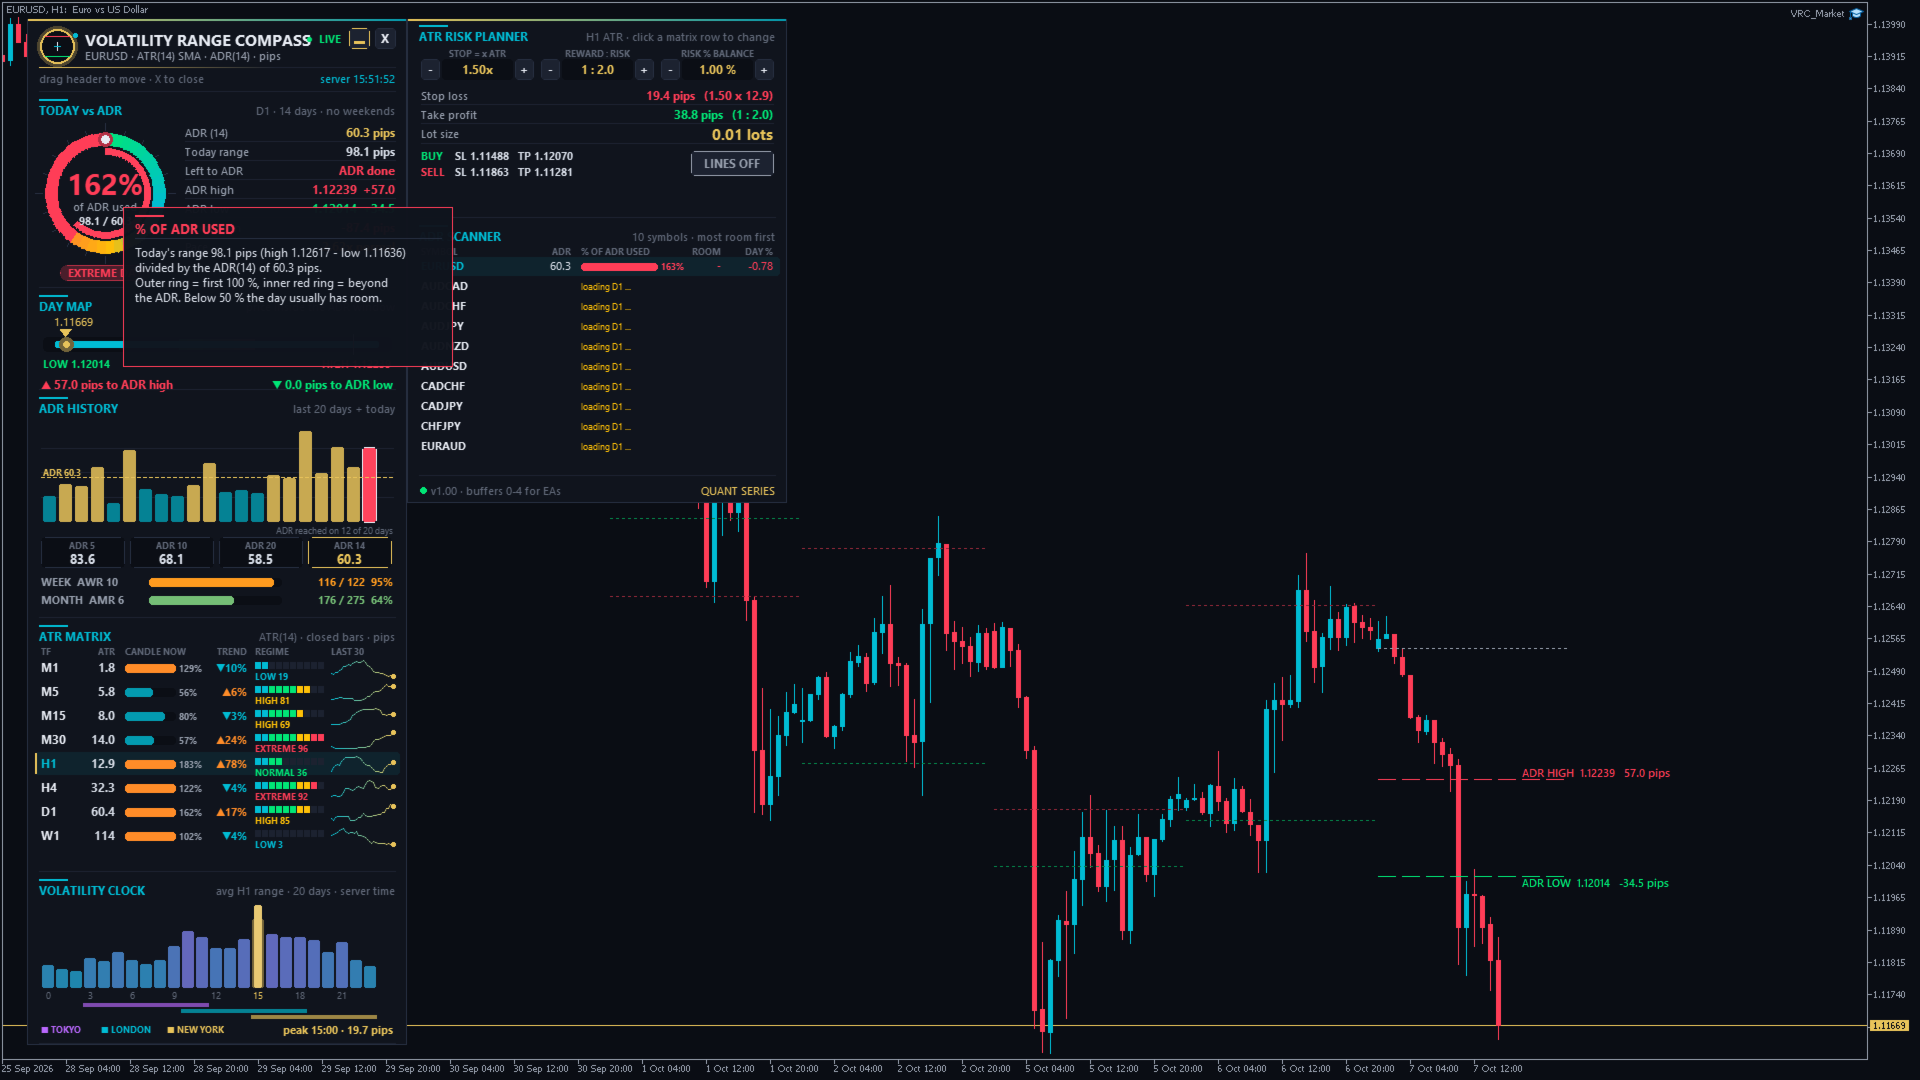
The ring shows how much of today's ADR is already used. The outer ring fills up to 100 %, and a red inner ring shows the part beyond 100 %. Below the ring, the day status:
- ROOM TO RUN (below 50 %): the day has most of its normal move still ahead.
- NORMAL DAY (50-80 %)
- STRETCHED (80-100 %): most of the normal move is done.
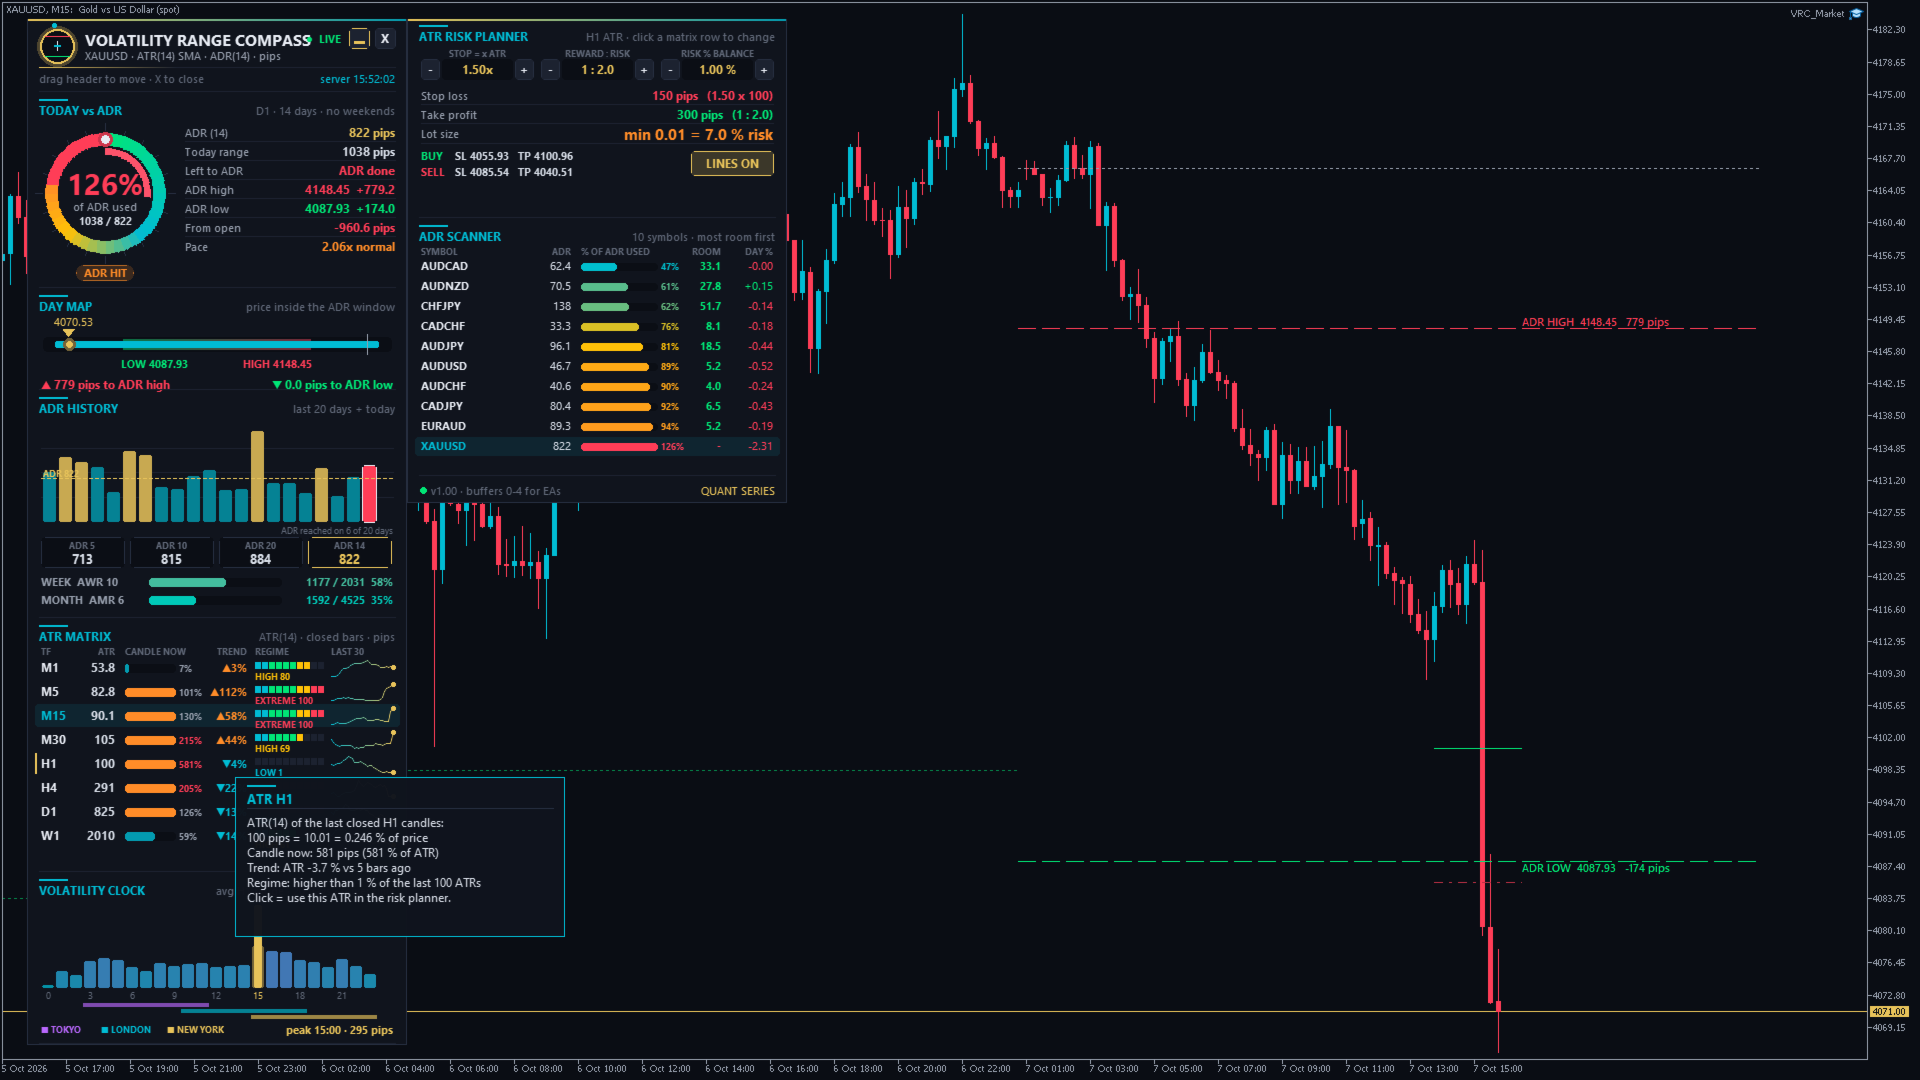
- ADR HIT (100-130 %): an average day would be over.
- EXTREME DAY (above 130 %): unusually large day, often news or trend days.
On the right: ADR, today's range, range left to the ADR, ADR high and low target with the distance from the current price, distance from the day's open and the pace. The pace compares today's movement with what is normal at this time of the day (from the volatility clock). 1.0x = normal, 1.5x = the day is moving 50 % faster than usual, 0.5x = a slow day. Early in the day (before about 6 % of the normal daily movement) it shows early in day.
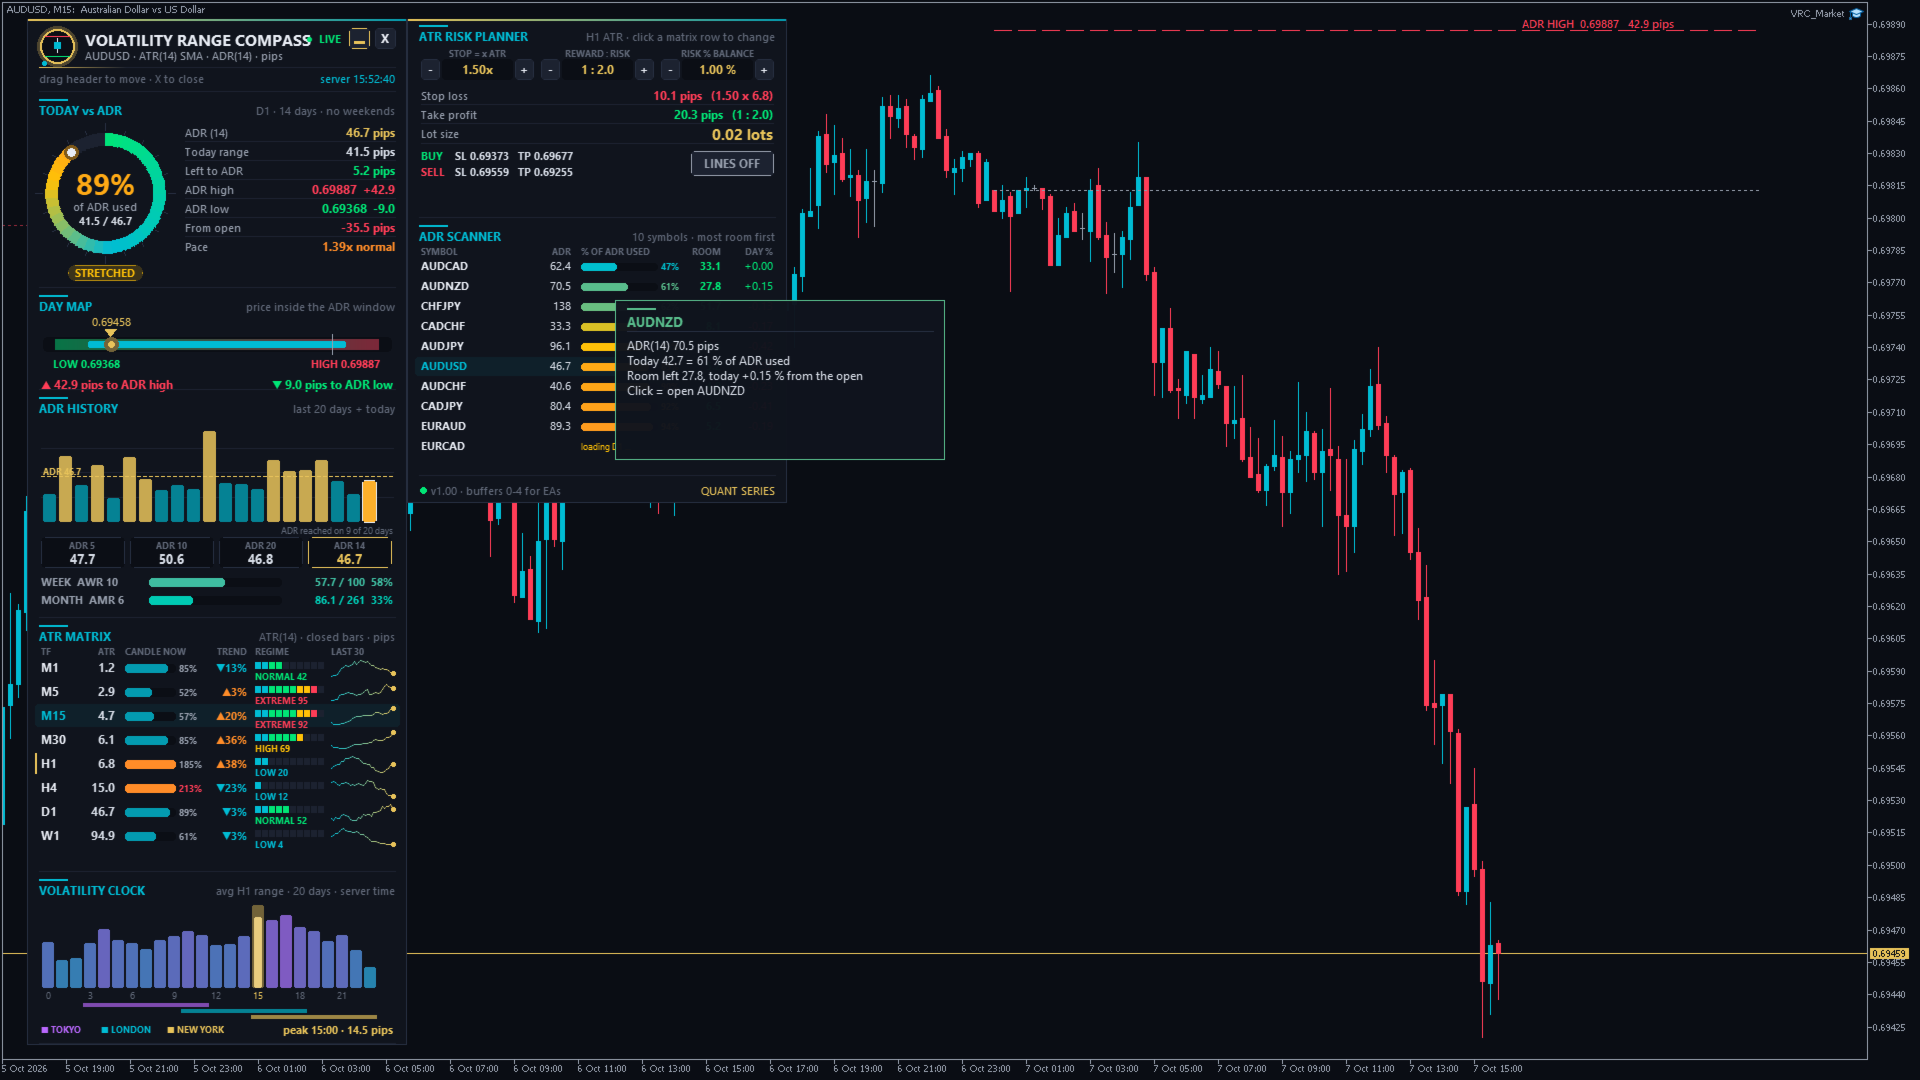
3. Day map
A horizontal map of today. The coloured track is the ADR window from the ADR low target (green) to the ADR high target (red). The cyan bar is today's range, the grey tick is the day's open and the gold marker is the current price. Below it you see how many pips are left to each target. The window shrinks as the day range grows, and when the cyan bar fills it, the ADR is done.
4. ADR history
The last 20 days and today as bars. Gold bars reached the ADR that was valid on that day, and cyan bars did not. The dashed line is the current ADR, and the counter shows on how many of the 20 days the ADR was reached. Below: ADR 5 / 10 / 20 / 14 (a short ADR above the long ADR = volatility is rising) and the weekly (AWR) and monthly (AMR) range with the share already used this week and this month.
5. ATR matrix (M1 to W1)
One row per timeframe, always using closed candles:
- ATR in pips (forex), in 0.10 steps (gold, shown as pips) or in points (indices, crypto).
- Candle now: the current candle's range in % of its ATR. Above 100 % = the candle is already bigger than normal (orange).
- Trend: ATR now compared with 5 candles ago. ▲ = volatility is rising, ▼ = it is falling.
- Regime: rank of the current ATR among the last 100 ATR values. LOW (below 20), NORMAL (20-60), HIGH (60-85), EXTREME (above 85).
- Last 30: sparkline of the last 30 ATR values.
The row of the chart timeframe is highlighted. Click a row to use the ATR of that timeframe in the risk planner (gold marker).
6. Volatility clock
Average H1 range of each hour of the day over the last 20 days, in server time. The gold bar is the current hour and its inner bar shows how much this hour has moved so far. Below the bars are the Tokyo, London and New York sessions shifted to your server time, and the peak hour with its average range.
7. ATR risk planner
Calculates the stop, the target and the lot size from the ATR:
- STOP = x ATR (0.5 to 3.0), REWARD : RISK (0.5 to 5.0) and RISK % BALANCE (0.25 to 5 %). Change them with the - / + buttons.
- Stop loss and take profit in pips, plus the exact price levels for a BUY from the ask and a SELL from the bid.
- Lot size calculated from the tick value of your broker and your balance. It is always rounded down to the lot step, so the real risk is never higher than the chosen %. If even the minimum lot is too large for the chosen risk, the planner shows the real risk of the minimum lot, for example min 0.01 = 7.0 % risk.
- LINES ON / OFF draws the BUY and SELL stop loss and take profit lines next to the price.
The planner only calculates and never places orders.
8. ADR scanner
Up to 14 symbols (your Market Watch or your own list), sorted with the most room first. Columns: ADR, % of ADR used, room left to the ADR and today's % change. The chart symbol is always included. Click a symbol to open it in this chart or in a new chart (input).
9. ADR targets on the chart
Dashed lines for today's ADR high target (red) and ADR low target (green) with price and distance, a dotted line for the day's open, and dotted lines for the final ADR targets of the last 5 days. The targets move live during the day. Hover any line to see its details.
Tooltips: hover any value, bar or row in the dashboard to see what it means and how it is calculated.
■ How to use it - step by step
Before you enter a trade:
- Look at % of ADR used. Below 50 % (ROOM TO RUN), the day usually still has movement left. Above 100 % (ADR HIT), most of the day's normal move is done, so new breakout trades have less room and reversals become more likely.
- Check the distance to the ADR target in your trade direction. If you want 40 pips but only 15 pips are left to the ADR high target, the trade needs an above-average day.
- Check the pace. A pace above 1.3x early in the session often points to a trend or news day. A pace below 0.7x points to a quiet range day.
- Check the regime of your trading timeframe in the ATR matrix. HIGH or EXTREME = wider stops are needed. LOW = expect smaller moves or a coming expansion.
- Check the volatility clock. Entries right before the peak hours have the most movement ahead of them.
Plan the trade:
- Click the row of your trading timeframe in the ATR matrix.
- Set the stop to 1.5x ATR (a common starting value), your reward : risk and your risk %.
- Read the lot size and the SL / TP price levels from the planner, or switch LINES ON to see them on the chart.
- Enter the trade with your usual order panel. The indicator does not trade.
Example (EURUSD): ADR = 60 pips, today's range = 25 pips (42 % used, ROOM TO RUN), pace = 1.1x, price is 20 pips below the ADR high target. H1 ATR = 13 pips, regime NORMAL. Stop 1.5 x 13 = 19.5 pips, target 1 : 2 = 39 pips. The target lies beyond the ADR high target, so a smaller target (about 20 pips) or a better entry fits a normal day better. With a 10,000 USD balance and 1 % risk the planner shows the lot size for 100 USD at a 19.5 pip stop.
Other typical uses:
- Take profit at the ADR target: many day traders close at or before the ADR high / low target.
- Avoid late entries: skip breakout trades on ADR HIT or EXTREME DAY.
- Fade extremes: when price reaches the ADR target with a falling pace, look for reversal signals from your own strategy.
- Choose the symbol: the scanner shows which pairs still have room today.
- Adjust stops to volatility: use ATR-based stops instead of fixed pips, so your stop is wide enough in volatile phases and tight in quiet ones.
■ Alerts
- ADR levels: an alert when today's range reaches 80 % and 100 % of the ADR (input ADR used levels, comma separated, for example 50,80,100,130). Each level fires once per day. Levels that were already passed when you load the indicator do not fire.
- Volatility spike: an alert when the current chart candle is at least 2 x ATR big (input spike = candle range >= N x ATR).
- Delivery as popup, sound, push notification to the MetaTrader app on your phone and / or e-mail. Push and e-mail must be set up in MetaTrader under Tools > Options > Notifications / Email.
■ Inputs - every setting explained
| ATR | |
| period (14) | number of candles in the ATR |
| smoothing method (SMA) | SMA = MetaTrader's standard ATR (identical values). Wilder / RMA = TradingView standard. EMA = reacts faster. |
| matrix timeframes (M1,M5,M15,M30,H1,H4,D1,W1) | comma separated list, maximum 9. Allowed: M1, M5, M15, M30, H1, H4, D1, W1, MN |
| regime = rank inside the last N values (100) | how many past ATR values are used for LOW / NORMAL / HIGH / EXTREME |
| ADR | |
| days in the ADR (14) | completed days in the average daily range |
| skip Saturday / Sunday candles (true) | ignores the small weekend candles some brokers have, so they do not lower the ADR |
| weeks in the AWR (10), months in the AMR (6) | periods of the weekly and monthly average range |
| Alerts | |
| ADR used levels in % (80,100) | leave empty to switch the ADR alerts off |
| volatility spike (true), multiplier (2.0) | alert when the chart candle reaches N x ATR |
| popup / sound / push / e-mail | how alerts are delivered |
| Chart | |
| draw ADR high / low targets (true) | lines and labels on the chart |
| ADR targets of the last N days (5) | history of the final targets (0 = off) |
| draw the day open (true) | dotted line at today's open |
| colours | ADR high target, ADR low target, day open |
| Planner (start values, change them later with - / + in the dashboard) | |
| stop loss = N x ATR (1.5), take profit = R x stop (2.0), risk in % of balance (1.0) | start values of the planner |
| Scanner | |
| symbols (empty) | your own list, for example EURUSD,GBPUSD,XAUUSD,US30. Empty = the first symbols of the Market Watch. Use the exact symbol names of your broker (with suffix, for example EURUSD.r). |
| max. symbols (10) | 1 to 14 |
| click on a symbol | switch this chart / open a new chart / do nothing |
| Display | |
| volatility clock days (20) | days of H1 history for the clock and the pace |
| pip size (Auto) | Auto = forex pips, gold 0.10, silver 0.01, indices / crypto points. Broker points, or a custom pip size in price units. |
| full dashboard or compact panel | start mode (you can switch any time with the button) |
| move away from other panels (true) | if other panels are on the chart, the dashboard moves to a free place, switches to the compact panel or folds to the pill |
| start X / Y (20 / 30) | first position in pixels. After that you can drag the dashboard anywhere. |
| show tooltips (true) | explanations on mouse hover |
| EA buffers: bars calculated (1500) | how many bars the 5 buffers are filled for |
■ For Expert Advisors (iCustom)
Buffers: 0 = ADR (price units), 1 = ADR high target, 2 = ADR low target, 3 = ADR used in %, 4 = ATR of the chart timeframe. Buffers 0-3 are empty on D1 and higher timeframes and on days whose first bar is outside the calculated window. The ADR of each day only uses the days before it, so values of closed bars do not repaint.
■ FAQ
Why are the values different from another ADR indicator? Check three things: the number of days, whether weekend candles are skipped, and whether today is included. This indicator uses completed days only and skips weekend candles by default.
Gold shows "pips" - what is a pip on gold? In Auto mode, 1 pip on gold = 0.10 USD of price movement (for example 2350.00 to 2350.10). Choose broker points or a custom pip size if you prefer another unit.
Which timezone is used for days and hours? The server time of your broker, the same as the D1 and H1 candles of your chart.
The dashboard covers my candles. Drag it to another place, click ▭ for the compact panel, or click X to fold it to a small pill.
A section shows LOADING. MetaTrader is still downloading the history of that timeframe. It disappears after a few seconds. If it stays, open a chart of that timeframe once.
Can I use it on several charts? Yes. Every chart keeps its own position and settings.
■ Notes
- MetaTrader 5 indicator for the main chart window. It works with every broker and symbol: forex, gold, silver, indices, crypto, energies.
- In the Strategy Tester (visual mode) the full dashboard runs on the tester history. Clicking a scanner symbol does not switch charts there.
- The indicator does not trade. It is an analysis and planning tool and does not guarantee profits.