Volatility Range Compass

  • 지표
  • Kay Zaremba
    Kay Zaremba
    Trader and MQL4 / MQL5 / Pine Script developer behind trader.lifestyle.
    YouTube: youtube.com/@traderlifestyle
    What I do:
    • Build free indicators and Expert Advisors for MT4, MT5
    • Turn strategies from YouTube videos, TradingView scripts and forum posts into working code
  • 버전: 1.0
  • 활성화: 5

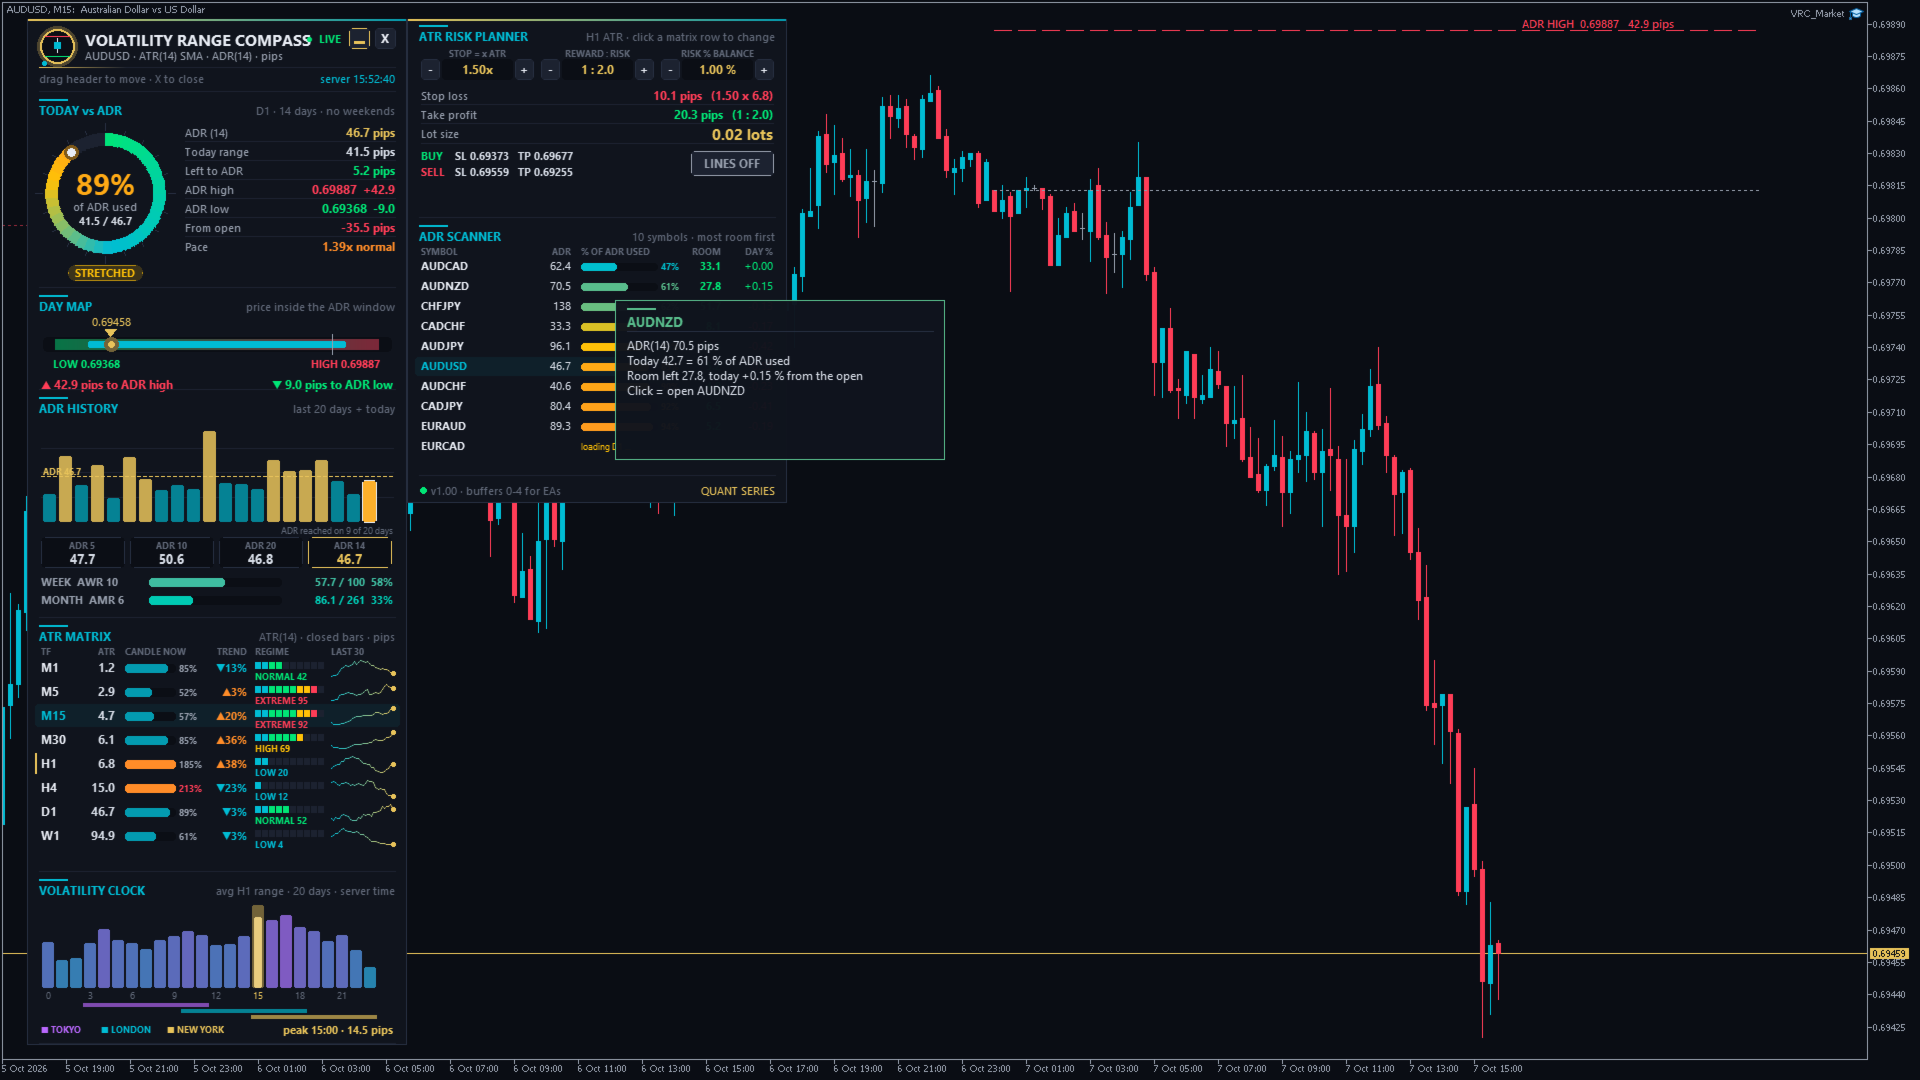
Volatility Range Compass is a volatility dashboard for MetaTrader 5. It answers the questions every trader has before entering a trade:

  • How far does this market normally move in a day, a week, a month? (ADR, AWR, AMR)
  • How much of today's normal move is already done, and is there still room? (% of ADR used, ADR targets)
  • How volatile is each timeframe right now compared with its own history? (ATR matrix M1 to W1 with regime)
  • Which hours of the day move the most? (volatility clock)
  • How big should my stop be, and which lot size keeps my risk at exactly 1 %? (ATR risk planner)
  • Which of my symbols still has the most room today? (ADR scanner)

Everything is calculated from the price history of your broker. There are no external servers, DLLs or internet connections. The indicator never opens or closes trades.

■ The terms in 30 seconds

  • ATR (Average True Range) = the average size of the last N candles (default 14), including gaps. An H1 ATR of 12 pips means an H1 candle is usually about 12 pips tall.
  • ADR (Average Daily Range) = the average distance between the daily high and the daily low over the last N completed days (default 14). Weekend candles are skipped by default.
  • AWR / AMR = the same for weeks (default 10) and months (default 6).
  • ADR high target = today's low + ADR. If price keeps rising, a normal day usually ends around this level.
  • ADR low target = today's high - ADR. If price keeps falling, a normal day usually ends around this level.
  • % of ADR used = today's range (high - low) divided by the ADR. 100 % = today has already moved as much as an average day.

■ Installation and first start

  1. After the purchase, the indicator appears in the MetaTrader 5 Navigator under Indicators > Market.
  2. Drag Volatility Range Compass onto any chart (forex, gold, silver, indices, crypto, any timeframe).
  3. Click OK. The default settings work for every symbol, so you do not need to change anything.
  4. On the first start the indicator loads the history of all timeframes (M1 to W1). Depending on your broker this takes a few seconds. Sections that are still loading show LOADING.
  5. Drag the dashboard by its header to any place on the chart. Position and settings are remembered for each chart.

■ The dashboard, section by section

1. Header
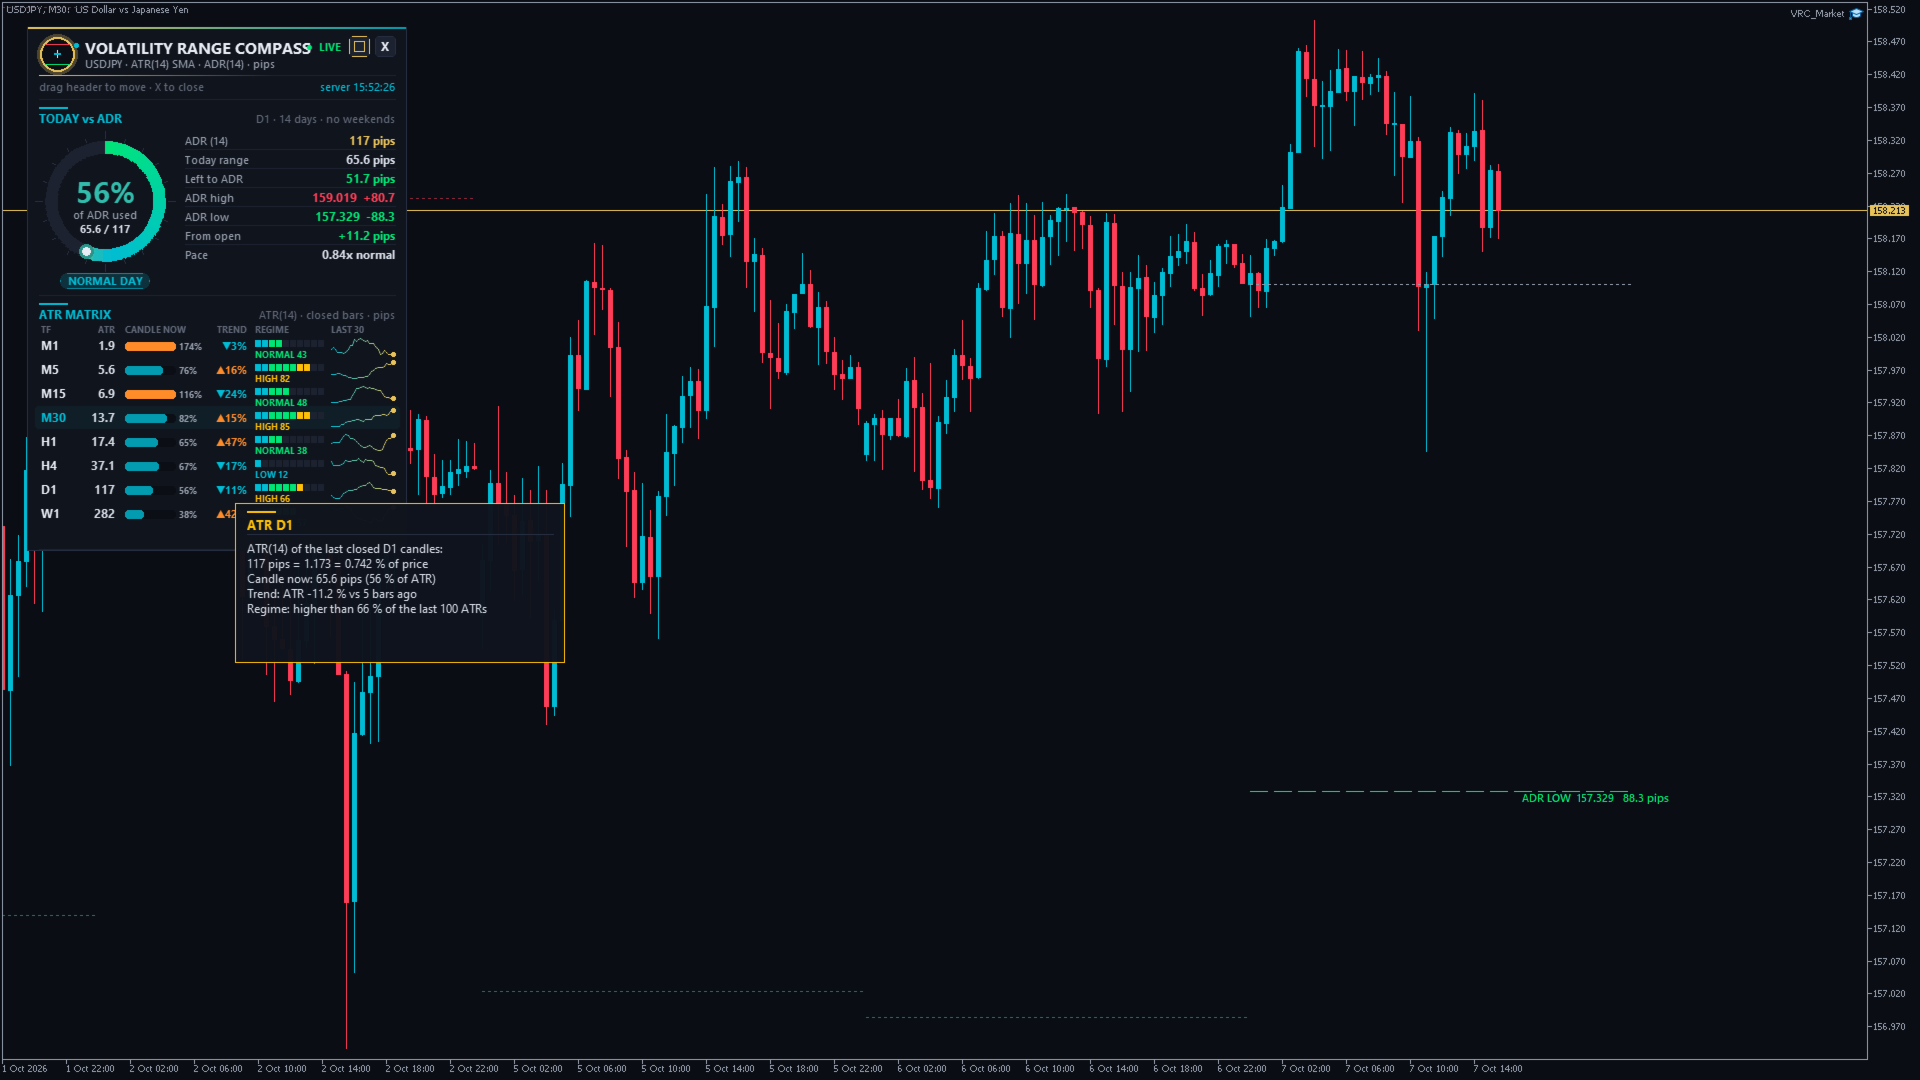
Symbol, ATR period and method, ADR period and the unit used (pips or points). The dot shows LIVE or LOADING and the server time is shown on the right. Buttons: ▭ switches between the full dashboard and the compact panel, and X folds the dashboard into a small pill. Click the pill to open the dashboard again.

2. Today vs ADR
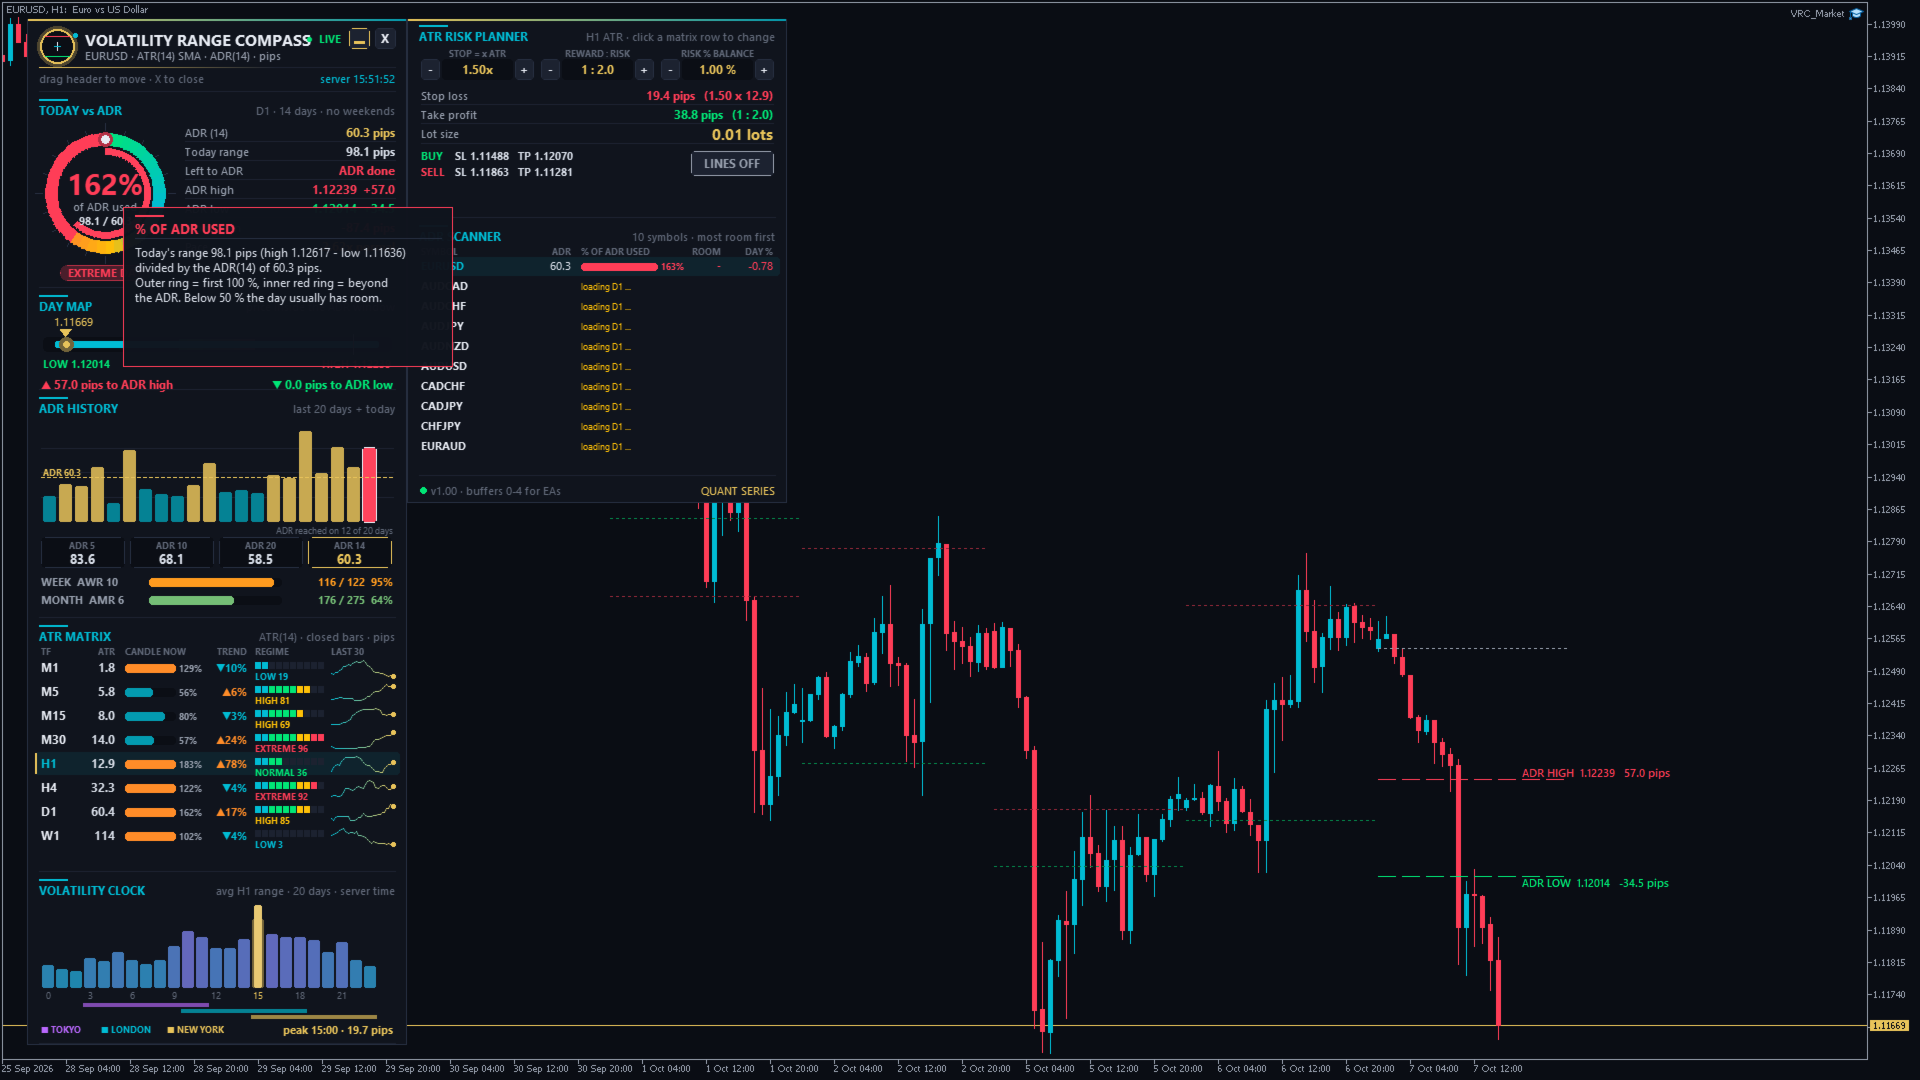
The ring shows how much of today's ADR is already used. The outer ring fills up to 100 %, and a red inner ring shows the part beyond 100 %. Below the ring, the day status:

  • ROOM TO RUN (below 50 %): the day has most of its normal move still ahead.
  • NORMAL DAY (50-80 %)
  • STRETCHED (80-100 %): most of the normal move is done.
  • ADR HIT (100-130 %): an average day would be over.
  • EXTREME DAY (above 130 %): unusually large day, often news or trend days.

On the right: ADR, today's range, range left to the ADR, ADR high and low target with the distance from the current price, distance from the day's open and the pace. The pace compares today's movement with what is normal at this time of the day (from the volatility clock). 1.0x = normal, 1.5x = the day is moving 50 % faster than usual, 0.5x = a slow day. Early in the day (before about 6 % of the normal daily movement) it shows early in day.

3. Day map
A horizontal map of today. The coloured track is the ADR window from the ADR low target (green) to the ADR high target (red). The cyan bar is today's range, the grey tick is the day's open and the gold marker is the current price. Below it you see how many pips are left to each target. The window shrinks as the day range grows, and when the cyan bar fills it, the ADR is done.

4. ADR history
The last 20 days and today as bars. Gold bars reached the ADR that was valid on that day, and cyan bars did not. The dashed line is the current ADR, and the counter shows on how many of the 20 days the ADR was reached. Below: ADR 5 / 10 / 20 / 14 (a short ADR above the long ADR = volatility is rising) and the weekly (AWR) and monthly (AMR) range with the share already used this week and this month.

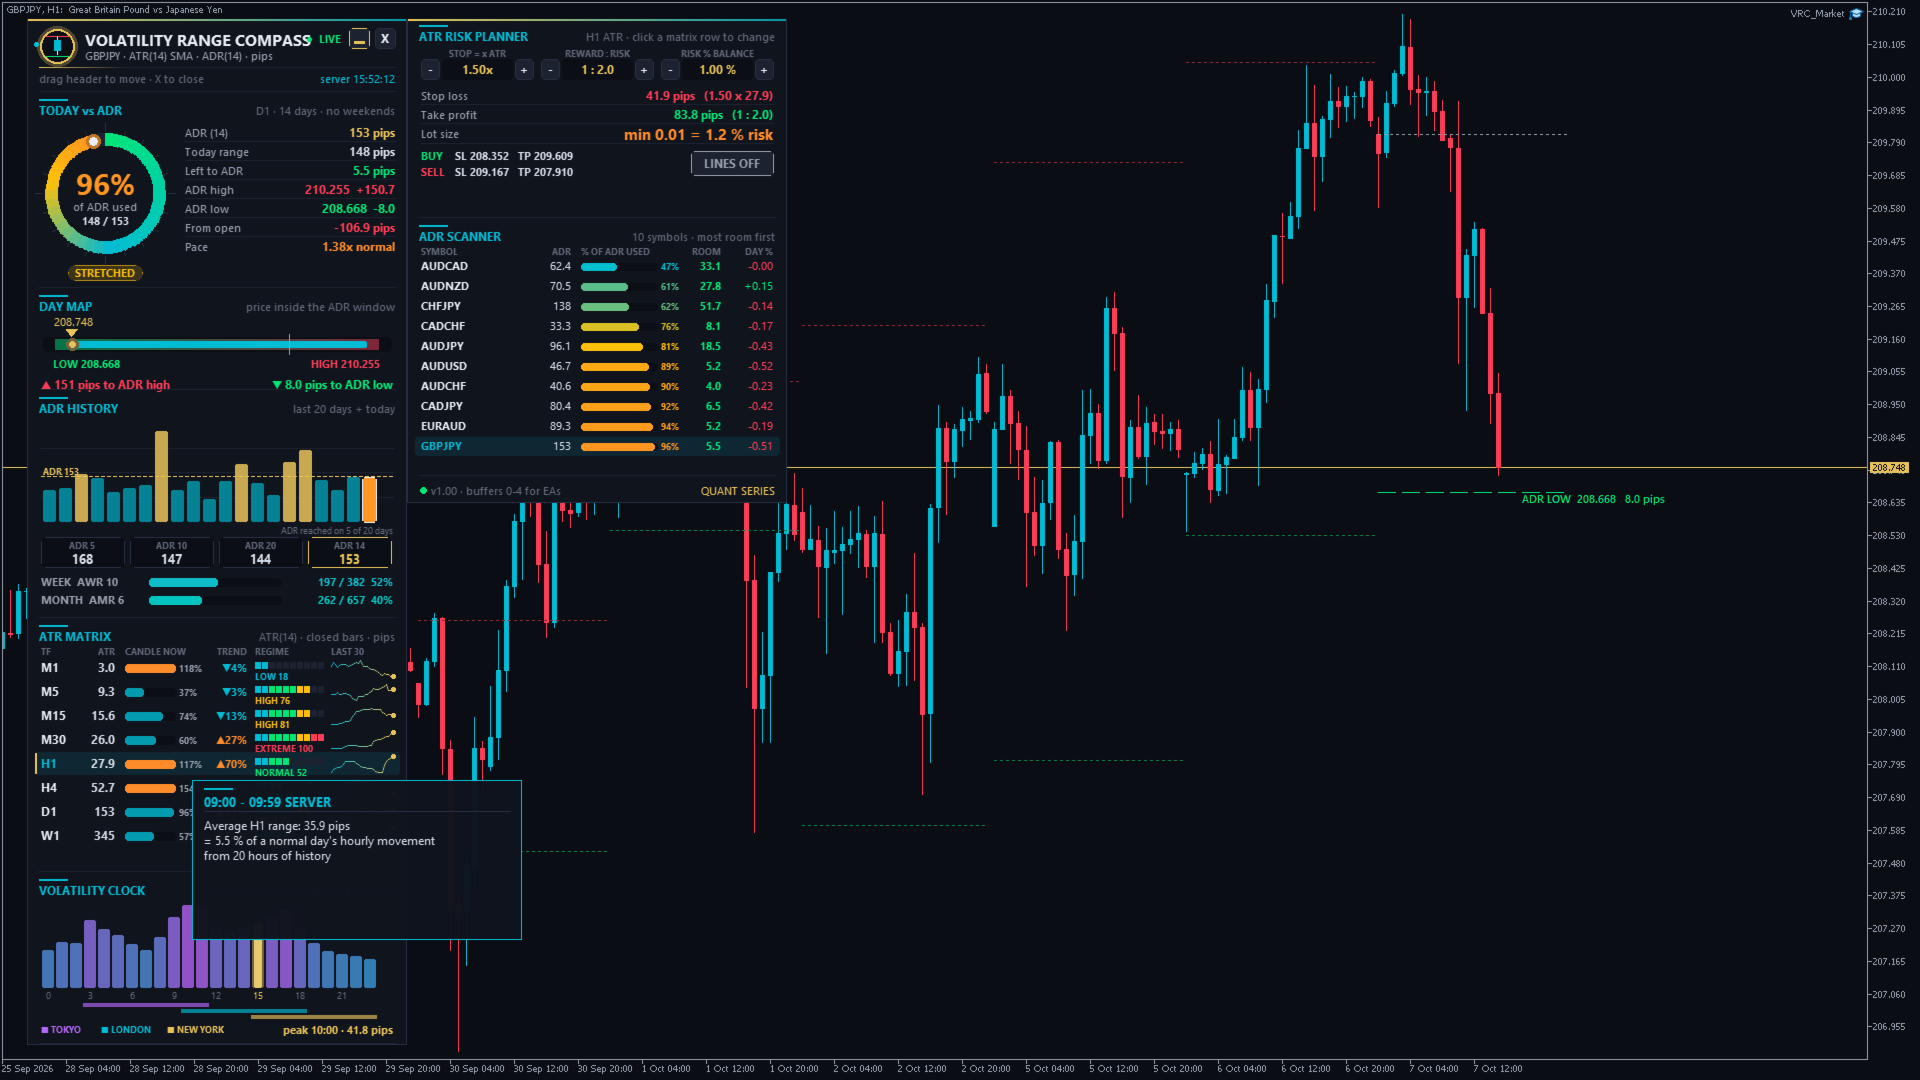
5. ATR matrix (M1 to W1)
One row per timeframe, always using closed candles:

  • ATR in pips (forex), in 0.10 steps (gold, shown as pips) or in points (indices, crypto).
  • Candle now: the current candle's range in % of its ATR. Above 100 % = the candle is already bigger than normal (orange).
  • Trend: ATR now compared with 5 candles ago. ▲ = volatility is rising, ▼ = it is falling.
  • Regime: rank of the current ATR among the last 100 ATR values. LOW (below 20), NORMAL (20-60), HIGH (60-85), EXTREME (above 85).
  • Last 30: sparkline of the last 30 ATR values.

The row of the chart timeframe is highlighted. Click a row to use the ATR of that timeframe in the risk planner (gold marker).

6. Volatility clock
Average H1 range of each hour of the day over the last 20 days, in server time. The gold bar is the current hour and its inner bar shows how much this hour has moved so far. Below the bars are the Tokyo, London and New York sessions shifted to your server time, and the peak hour with its average range.

7. ATR risk planner
Calculates the stop, the target and the lot size from the ATR:

  • STOP = x ATR (0.5 to 3.0), REWARD : RISK (0.5 to 5.0) and RISK % BALANCE (0.25 to 5 %). Change them with the - / + buttons.
  • Stop loss and take profit in pips, plus the exact price levels for a BUY from the ask and a SELL from the bid.
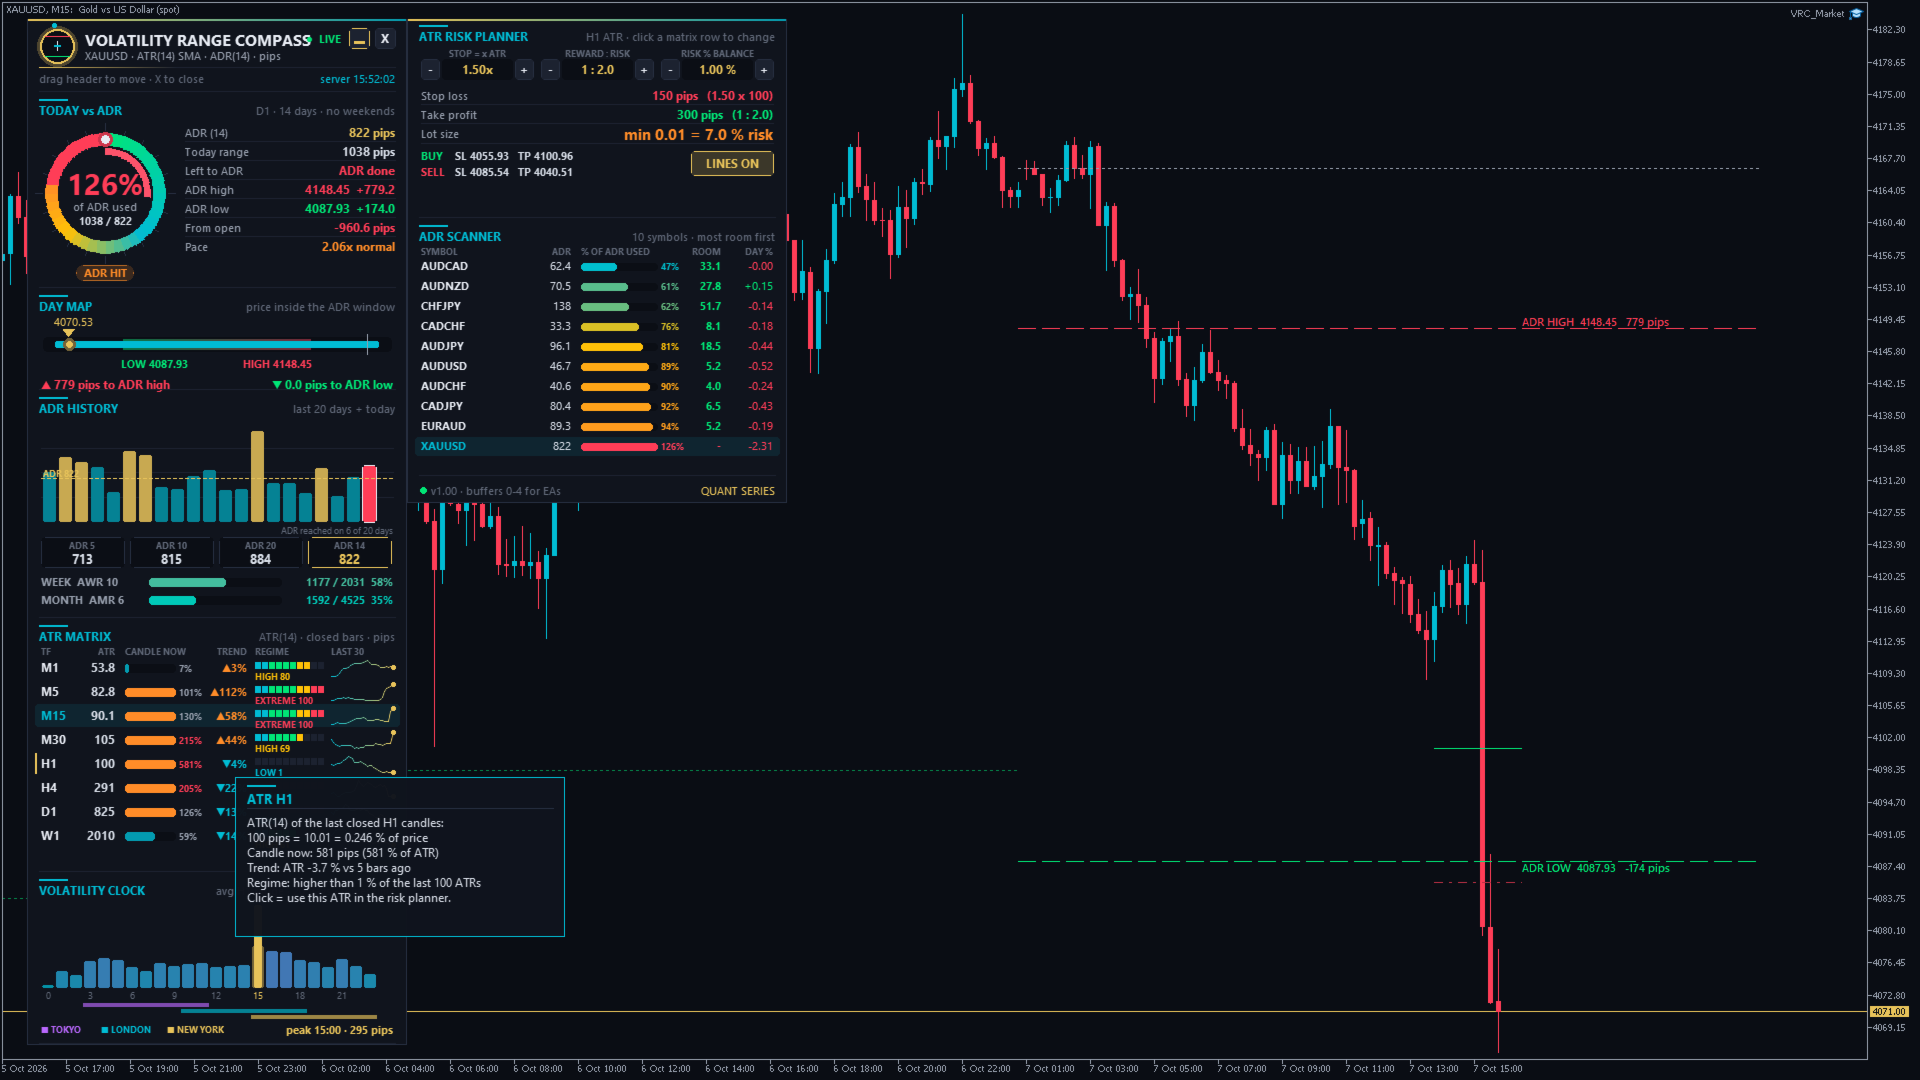
  • Lot size calculated from the tick value of your broker and your balance. It is always rounded down to the lot step, so the real risk is never higher than the chosen %. If even the minimum lot is too large for the chosen risk, the planner shows the real risk of the minimum lot, for example min 0.01 = 7.0 % risk.
  • LINES ON / OFF draws the BUY and SELL stop loss and take profit lines next to the price.

The planner only calculates and never places orders.

8. ADR scanner
Up to 14 symbols (your Market Watch or your own list), sorted with the most room first. Columns: ADR, % of ADR used, room left to the ADR and today's % change. The chart symbol is always included. Click a symbol to open it in this chart or in a new chart (input).

9. ADR targets on the chart
Dashed lines for today's ADR high target (red) and ADR low target (green) with price and distance, a dotted line for the day's open, and dotted lines for the final ADR targets of the last 5 days. The targets move live during the day. Hover any line to see its details.

Tooltips: hover any value, bar or row in the dashboard to see what it means and how it is calculated.

■ How to use it - step by step

Before you enter a trade:

  1. Look at % of ADR used. Below 50 % (ROOM TO RUN), the day usually still has movement left. Above 100 % (ADR HIT), most of the day's normal move is done, so new breakout trades have less room and reversals become more likely.
  2. Check the distance to the ADR target in your trade direction. If you want 40 pips but only 15 pips are left to the ADR high target, the trade needs an above-average day.
  3. Check the pace. A pace above 1.3x early in the session often points to a trend or news day. A pace below 0.7x points to a quiet range day.
  4. Check the regime of your trading timeframe in the ATR matrix. HIGH or EXTREME = wider stops are needed. LOW = expect smaller moves or a coming expansion.
  5. Check the volatility clock. Entries right before the peak hours have the most movement ahead of them.

Plan the trade:

  1. Click the row of your trading timeframe in the ATR matrix.
  2. Set the stop to 1.5x ATR (a common starting value), your reward : risk and your risk %.
  3. Read the lot size and the SL / TP price levels from the planner, or switch LINES ON to see them on the chart.
  4. Enter the trade with your usual order panel. The indicator does not trade.

Example (EURUSD): ADR = 60 pips, today's range = 25 pips (42 % used, ROOM TO RUN), pace = 1.1x, price is 20 pips below the ADR high target. H1 ATR = 13 pips, regime NORMAL. Stop 1.5 x 13 = 19.5 pips, target 1 : 2 = 39 pips. The target lies beyond the ADR high target, so a smaller target (about 20 pips) or a better entry fits a normal day better. With a 10,000 USD balance and 1 % risk the planner shows the lot size for 100 USD at a 19.5 pip stop.

Other typical uses:

  • Take profit at the ADR target: many day traders close at or before the ADR high / low target.
  • Avoid late entries: skip breakout trades on ADR HIT or EXTREME DAY.
  • Fade extremes: when price reaches the ADR target with a falling pace, look for reversal signals from your own strategy.
  • Choose the symbol: the scanner shows which pairs still have room today.
  • Adjust stops to volatility: use ATR-based stops instead of fixed pips, so your stop is wide enough in volatile phases and tight in quiet ones.

■ Alerts

  • ADR levels: an alert when today's range reaches 80 % and 100 % of the ADR (input ADR used levels, comma separated, for example 50,80,100,130). Each level fires once per day. Levels that were already passed when you load the indicator do not fire.
  • Volatility spike: an alert when the current chart candle is at least 2 x ATR big (input spike = candle range >= N x ATR).
  • Delivery as popup, sound, push notification to the MetaTrader app on your phone and / or e-mail. Push and e-mail must be set up in MetaTrader under Tools > Options > Notifications / Email.

■ Inputs - every setting explained

ATR
period (14) number of candles in the ATR
smoothing method (SMA) SMA = MetaTrader's standard ATR (identical values). Wilder / RMA = TradingView standard. EMA = reacts faster.
matrix timeframes (M1,M5,M15,M30,H1,H4,D1,W1) comma separated list, maximum 9. Allowed: M1, M5, M15, M30, H1, H4, D1, W1, MN
regime = rank inside the last N values (100) how many past ATR values are used for LOW / NORMAL / HIGH / EXTREME
ADR
days in the ADR (14) completed days in the average daily range
skip Saturday / Sunday candles (true) ignores the small weekend candles some brokers have, so they do not lower the ADR
weeks in the AWR (10), months in the AMR (6) periods of the weekly and monthly average range
Alerts
ADR used levels in % (80,100) leave empty to switch the ADR alerts off
volatility spike (true), multiplier (2.0) alert when the chart candle reaches N x ATR
popup / sound / push / e-mail how alerts are delivered
Chart
draw ADR high / low targets (true) lines and labels on the chart
ADR targets of the last N days (5) history of the final targets (0 = off)
draw the day open (true) dotted line at today's open
colours ADR high target, ADR low target, day open
Planner (start values, change them later with - / + in the dashboard)
stop loss = N x ATR (1.5), take profit = R x stop (2.0), risk in % of balance (1.0) start values of the planner
Scanner
symbols (empty) your own list, for example EURUSD,GBPUSD,XAUUSD,US30. Empty = the first symbols of the Market Watch. Use the exact symbol names of your broker (with suffix, for example EURUSD.r).
max. symbols (10) 1 to 14
click on a symbol switch this chart / open a new chart / do nothing
Display
volatility clock days (20) days of H1 history for the clock and the pace
pip size (Auto) Auto = forex pips, gold 0.10, silver 0.01, indices / crypto points. Broker points, or a custom pip size in price units.
full dashboard or compact panel start mode (you can switch any time with the button)
move away from other panels (true) if other panels are on the chart, the dashboard moves to a free place, switches to the compact panel or folds to the pill
start X / Y (20 / 30) first position in pixels. After that you can drag the dashboard anywhere.
show tooltips (true) explanations on mouse hover
EA buffers: bars calculated (1500) how many bars the 5 buffers are filled for

■ For Expert Advisors (iCustom)

Buffers: 0 = ADR (price units), 1 = ADR high target, 2 = ADR low target, 3 = ADR used in %, 4 = ATR of the chart timeframe. Buffers 0-3 are empty on D1 and higher timeframes and on days whose first bar is outside the calculated window. The ADR of each day only uses the days before it, so values of closed bars do not repaint.

■ FAQ

Why are the values different from another ADR indicator? Check three things: the number of days, whether weekend candles are skipped, and whether today is included. This indicator uses completed days only and skips weekend candles by default.

Gold shows "pips" - what is a pip on gold? In Auto mode, 1 pip on gold = 0.10 USD of price movement (for example 2350.00 to 2350.10). Choose broker points or a custom pip size if you prefer another unit.

Which timezone is used for days and hours? The server time of your broker, the same as the D1 and H1 candles of your chart.

The dashboard covers my candles. Drag it to another place, click ▭ for the compact panel, or click X to fold it to a small pill.

A section shows LOADING. MetaTrader is still downloading the history of that timeframe. It disappears after a few seconds. If it stays, open a chart of that timeframe once.

Can I use it on several charts? Yes. Every chart keeps its own position and settings.

■ Notes

  • MetaTrader 5 indicator for the main chart window. It works with every broker and symbol: forex, gold, silver, indices, crypto, energies.
  • In the Strategy Tester (visual mode) the full dashboard runs on the tester history. Clicking a scanner symbol does not switch charts there.
  • The indicator does not trade. It is an analysis and planning tool and does not guarantee profits.
추천 제품
Phoenix Orb Asia
Nigel Nii Darku Narnor Darko
This is a professional-grade institutional toolkit designed for breakout traders and trend followers worldwide. It specializes in the  Opening Range Breakout (ORB)  strategy—one of the most consistent ways to capture intraday volatility during the London and New York opens. This indicator does the heavy lifting for you by automatically mapping out the high and low of the first 15 minutes of any session. It combines this with  Smart Money Concepts (SMC) , identifying structural shifts like  BOS
I recommend you to read the   product's blog  (manual) from start to end so that it is clear from the beginning what the indicactor offers. This multi time frame and multi symbol divergence dashboard indicator sends an alert when one or two different divergences have been identified. It can be used with all time frames from M1 to MN. Maximum 9 time frames can be shown in the dashboard at the same time. It is possible to enable moving average, RSI or Bollinger bands trend filter to filter out on
Wilizard SMC Suite is a complete Smart Money Concepts / ICT toolkit in a single, fast, non-repainting indicator. Instead of loading six separate tools onto one chart, you get every institutional-style concept — market structure, order blocks, fair value gaps, liquidity, premium/discount, killzones, a multi-timeframe dashboard and confluence signals — working together, all confirmed on closed bars. Everything you see is calculated on CLOSED candles only. Nothing shifts, redraws, or disappears a
Arnold Tradenegger
Saiful Izham Bin Hassan
아놀드 트레이드네거 엘리트(Arnold Tradenegger Elite)는 현대 시장 환경에 맞게 설계된 탄력적 알고리즘을 기반으로 구축된 전문가급 전문가 자문(EA)입니다. 동적 시장 필터링과 기관 수준의 리스크 관리를 결합합니다. 이 시스템은 MACD, 이동 평균, RSI, 스토캐스틱, MFI를 포함한 다중 지표 확인 매트릭스를 사용하여 진입 시점을 정밀하게 포착합니다. 거래를 강제하기보다 적응하도록 설계되었으며, 변동성 움직임 중 포지션을 보호하기 위해 ATR 기반 동적 트레일링 스탑을 활용합니다. 주요 특징 2단계 실행: 엄격한 브로커 규칙과 완벽하게 호환됩니다. 알고리즘은 스탑을 0으로 설정한 시장가 주문을 제출하고, 실행 티켓을 확인한 후 독립적으로 손절매와 이익 실현을 수정합니다. 이는 즉각적인 거부 및 슬리피지 추적 오류를 방지합니다. 글로벌 자본 보호: 전체 계좌 잔액을 모니터링하는 엄격한 회로 차단기입니다. 변동 손실이 설정된 최대 한도에 도달하면 EA가 즉시
Emotions are a weakness. QHO mathematics is the future of your trading! You know what really truly frustrating?  Information garbage and noise. All those legacy, lagging indicators on the charts look like an attempt to steer a rocket ship with a steam engine. They are useless. They look at the past while the market is already flying forward on next-gen tech. We created QHO. This is not just another indicator. This is pure mathematics crushing market chaos right on your chart. Imagine completely
Breakout Entry Signals MT5
Christopher Graham Parish
!! FLASH SALE !!   Over 80% off !!     For ONE week only. Now only $47 - normally $297! >>>      Ends on 30 June 2023 - Don't miss it! Buy and Sell Alerts when price breaks out following strict price action. Sends Alerts – #On MT5 To Your Phone To Your Email Does not repaint . Works on any Forex pair, any timeframe. 10 Activations allowed so you are free from limitations >> MT4 Version Here For spreads from a tiny 0.1pip RAW/ECN Accounts,  click here . Check out my Waka Esque EA signal here
Ultimate Double Top & Bottom (Pro Volume Matrix) Stop trading retail breakouts. Start trading Institutional Traps. The   Ultimate Double Top & Bottom   is not a standard, lagging pattern scanner. It is a highly advanced, non-repainting structural engine equipped with a proprietary   3-Leg Volume Matrix . Designed exclusively for Smart Money Concepts (SMC) and order flow traders, this indicator mathematically dissects the tick volume inside M and W patterns to reveal true institutional intent:  
ToolBox 360 is the swiss knife of all indicators. It is full packed with useful tools to help you with your trading. It can be used to find best entry and exit points and help you to decide if you should open a trade or not. It shows market trends, candlestick formations outside / inside bars and you can sett time based allerts. Main features: Time based Fibonacci lines Choose a start and end time and the indicator shows you Fibonacci lines within the selected time range including range high a
DS 2MV Candles Colors
Herminio Jesus Da Costa Machado
DS 2MV Candles Colors  Created by Hermínio Machado 2025 The DS 2MV Candles Colors indicator visually enhances your chart by coloring candles based on price position relative to two Smoothed Moving Averages (SMMA) . It’s designed to help traders quickly identify the current trend direction and potential neutral zones at a glance. How It Works The indicator plots two Smoothed Moving Averages (SMMA) — one based on the High and another on the Low price. Candle colors change according to wher
Neuro Future
Sergey Rozhnov
신경망 지표       학습 기능이 내장되어 있습니다. 이 시스템은 다단계 맞춤형 퍼셉트론과 고급 학습 설정을 통해 미래 가격 변동을 예측하는 진정한 자율형 인공지능 시스템입니다   . 모든 금융 종목에 대해 지표를 직접 학습시킬 수 있으며, 머신러닝에 대한 특별한 지식은 필요하지 않습니다. 필요한 모든 것이 이 도구에 수집되어 있으며, 자동 모드와 사전 설정을 통해 편리하게 구현됩니다. 주요 업데이트 버전 2.0-2.5 가 출시되었습니다. 고급 입력 기능:지표에 대한 지원이 추가되었습니다. 이제 더 깊은 시장 분석을 위해 원시 가격 데이터를 세 가지 기술 지표와 결합하거나 가격이없는 지표 만 사용할 수 있습니다. 차단하지 않고 라이브 교육:지능형 학습 알고리즘은 백그라운드에서 비동기 적으로 작동합니다. 메타 트레이더 5 터미널은 완전히 반응하여 신경망을 학습하면서 시장을 계속 거래하고 분석 할 수 있습니다. 특징: 간편 시작   . 자동 모드로 빠르게 시작할 수 있는 간단한 설
Breakout Index
Waleed Saleem
Monster Breakout Index V2 is a clean, visual momentum indicator engineered to spot potential breakout opportunities by evaluating extreme price extensions against median historical range channels. Overview The indicator continuously monitors the median price across a configurable lookback window and compares it against current high and low extremes. When price expansion breaks out of the established median bounds, MBI V2 immediately plots distinct histogram bars in a separate window, allowing tr
- simple Price Action Indicator - a  3 Candle Pattern (1. Direction-Candle / 2. the TRAP / 3. Trigger-Candle)    BUT every Signal needs ATTENTION to check for a clean Range - NON Lagging ! the Alert shows instantly whats happening - recommended SETUP is: - there is a VOLUME-Filter (in points for the   1. candle ) to avoid alerts with tiny Candles during a NON-VOLUME-Time - 10% off the Boobietrap-Candle as the ALERT-Level --> can easily be adjusted - user defined - recommended Timeframe: M30 (we
Best trending
Minh Tuan Le
ARIPoint is a powerful trading tool designed to generate high-probability entry signals with dynamic TP/SL/DP levels based on price volatility. The integrated performance tracking function displays win/loss statistics, number of PP1/PP2 hits, and success rate, all updated in real time. Key Features: Buy/sell signals with adaptive volatility range Real-time TP/SL/DP levels based on ATR Integrated MA filter with ATR/StdDev volatility option. Performance statistics table (Success, Profit/Loss,
Smart Volatility Squeeze MT5 Smart Volatility Squeeze MT5 is a volatility compression and momentum expansion indicator for MetaTrader 5. It builds on John Carter's Volatility Squeeze framework and extends the usual single-tier squeeze into three compression tiers, so you can see not only whether the market is compressed but how tightly it is compressed before it expands. The indicator opens in a separate window and draws two elements: a linear regression momentum histogram and a row of coloured
In the context of trading, Malaysia SNR (Support and Resistance) refers to the technical analysis of support and resistance levels in financial markets, particularly for stocks, indices, or other assets traded. This is single timeframe version. Multiple timeframe version is avaiable here . There are three type of Malaysia SNR level Classic , GAP and Flipped 1. Classic Support is the price level at which an asset tends to stop falling and may start to rebound. It acts as a "floor" where demand is
가격이 유동성을 탐색할 수 있는 위치 파악 Liquidity Reaction Map MT5는 확인된 가격 구조를 기반으로 잠재적인 매수측 및 매도측 유동성 영역을 식별하는 차트 기반 시장 분석 지표입니다. 스윙 포인트, 동일 고점과 동일 저점, 전일 및 전주 레벨, 세션 고점과 저점, 심리적 라운드 가격을 하나의 정리된 유동성 지도에 결합합니다. 서로 가까운 레벨은 하나로 병합할 수 있으며 강도, 현재 가격과의 거리, 여러 출처의 일치 정도에 따라 순위가 결정됩니다. 이 지표는 가격이 유동성 영역에 접근하거나, 해당 유동성을 스윕하거나, 거부되거나, 돌파할 수 있는 위치를 분석하는 데 도움을 줍니다. 거래를 개시하거나 관리하지 않습니다. 유동성 출처 유동성 지도는 다음 항목을 기반으로 유동성을 식별할 수 있습니다. 확인된 스윙 고점과 저점 동일 고점과 동일 저점 전일 고점과 저점 전주 고점과 저점 완료된 세션의 고점과 저점 심리적 라운드 가격 레벨 설정 가능한 여러 시간대 매수측 유
Moonshine Pivot Trend is a trend indicator for MT4 and MT5 whose trailing stop sits still for days at a time. On gold H1 it produced 153 signals in four and a half years, about 33 a year. If that sounds low, that's the argument I want to make before you look at a screenshot and decide something is broken. Most ATR trend tools centre their band on the current candle, so every new bar moves the anchor and a quiet stretch nudges you out of a trend that never broke. This one anchors to confirmed swi
Supertrend Volume Confirm
Isaac Alexander Pinero Garcias
DESCRIPTION Supertrend Volume Confirm — Trend Signals Confirmed by Volume and RSI Supertrend Volume Confirm is a buy/sell signal indicator based on the classic Supertrend, with two additional confirmation filters: volume and RSI. Unlike more complex multi-timeframe systems, this indicator works on a single timeframe, designed for traders who want something direct and easy to read. It works on any market symbol (forex, gold, indices, stocks, crypto) thanks to its default use of tick volume, unive
Dorian
Ivan Simonika
The Dorian indicator is an intuitive tool for determining the current market trend. It is based on a simple visualization in the form of two-color lines, which makes it convenient for use by both beginners and experienced traders. This indicator not only helps determine the direction of the trend, but also serves as a valuable advisor for making decisions about entering the market or closing positions. Due to its simplicity and effectiveness, Dorian is recommended for traders of any experience
LZ Session Boxes PRO
Lukasz Tomasz Zychal
LZ Session Boxes PRO is a professional-grade tool for day traders, designed to beautifully visualize global trading sessions (Asia, Pacific/Sydney, London, New York) across your entire chart history. It eliminates the confusion of broker time offsets by automatically detecting timezones and adjusting for Daylight Saving Time (DST), ensuring your session boxes always align perfectly with real-market hours. Feature highlights - 4 Major Sessions: highlights Asian, Pacific (Sydney), London, and N
EAAV Visual Position Sizer
Eduardo Alberto Araque Vera
EAAV Visual Position Sizer is an advanced graphical utility for MetaTrader 5 designed to simplify visual trade management and accurately calculate position sizing before executing any order. The tool places interactive levels directly on your chart, allowing traders to quickly and intuitively adjust entry, protective stop, and target levels. Key Features: • Automatic Position Sizing: Automatically calculates the exact volume (lots) based on a fixed account risk percentage or fixed monetary am
LT Support Resistance - 지지와 저항을 100% 자동으로 식별 수동으로 지지와 저항선을 그리느라 귀중한 시간을 낭비하는 데 지치셨나요? 아니면 매번 중요한 레벨을 놓쳐서 답답하셨나요? LT Support Resistance는 이러한 번거로운 작업을 없애기 위해 개발되었습니다. 여러 타임프레임(시간족)을 동시에 분석하여, 거래 중인 자산의 가장 중요한 구역을 자동으로 식별하고 차트에 표시해 줍니다. == 중요 레벨의 스마트 자동화 == 주관적이고 시간이 오래 걸리는 수동 라인 작도 대신, 본 지표는 과거 가격 데이터를 분석하여 유의미한 반전 포인트를 식별하고, 가격이 '실제'로 신뢰하고 반응하는 지지 및 저항선을 그려줍니다. 그 결과 데이터에 기반한 객관적이고 신속한 분석이 가능해집니다. == 주요 특징 == 100% 자동 감지: 수동 분석 없이도 지지/저항 레벨 식별 멀티 타임프레임(MTF): M5 차트에서 H1, H4, D1, W1 레벨을 동시에 시각화 스마트 알
Buy Sell Range
Israr Hussain Shah
The Range Filter Buy and Sell indicator is a trend-following technical analysis tool designed to identify optimal entry and exit points in the market. It filters out market noise by creating dynamic bands around price movements, generating clear buy and sell signals when price breaks through these bands. Key Features Dynamic Range Filtering : Uses a sophisticated algorithm to calculate adaptive bands that adjust to market volatility Trend Identification : Clearly visualizes the current trend dir
P A R Intelligence is a multi-strategy trading indicator designed for professional traders who demand precision, flexibility, and advanced market analysis. This powerful tool combines two proven trading methodologies into one seamless interface, providing institutional-grade support/resistance detection with intelligent breakout and pattern recognition systems. Why This Is Your Ultimate Trading Edge DUAL-STRATEGY ARCHITECTURE Choose between - or combine - two powerful trading approaches:
이 다중 시간 프레임 및 다중 기호 표시기는 핀 막대, 아침/저녁 별, 인글핑, 핀셋, 쓰리 라인 스트라이크, 내부 막대 및 페넌트 및 삼각형을 스캔합니다.   지표는 단일 차트 모드에서도 사용할 수 있습니다. 이 옵션에 대한 자세한 내용은 제품의       블로그   .       고유한 규칙 및 기술과 결합하여 이 표시기를 사용하면 자신만의 강력한 시스템을 생성(또는 강화)할 수 있습니다. 특징 Market Watch 창에 표시되는 모든 기호를 동시에 모니터링할 수 있습니다. 하나의 차트에만 지표를 적용하고 전체 시장을 즉시 모니터링하십시오. M1에서 MN까지 모든 시간대를 모니터링하고 패턴이 식별되면 실시간 경고(팝업, 푸시 또는 메일)를 보냅니다. RSI 및 볼린저 밴드를 핀 바, 아침/저녁 별   , 인글프잉 및 핀셋 형성   에 대한 필터로 사용하여 잠재적 반전을 적절하게 식별할 수 있습니다. 이동 평균을 주요 추세 필터로 사용하고 ADX를 변동성 필터로 사용할 수 있습니
Sonic R Pro Enhanced EA - 버전 2025 249달러 - 첫 5명만! 실시간 신호 Sonic R Pro Enhanced의 실시간 성과 확인하기: 거래 전략 Sonic R Pro Enhanced는 Dragon Band (EMA 34 및 EMA 89)를 기반으로 한 전통적인 Sonic R 전략의 업그레이드 버전으로, 자동화된 거래 시스템입니다. 타임프레임: M15, M30 지원 통화쌍: XAUUSD, BTCUSD, AUDJPY, USDJPY 거래 스타일: 스윙 트레이딩 - 풀백 및 반대 트렌드 최소 자본: 500 USD 레버리지: 1:200 이상 사용자 가이드 Sonic R Pro Enhanced는 단순함을 위해 최적화되었습니다. 사용자는 RiskAmount 하나의 파라미터만 설정하면 됩니다. RiskAmount < 0일 경우: 계좌 잔액의 백분율로 위험을 계산 RiskAmount > 0일 경우: 거래당 고정 USD 금액으로 위험을 설정 예제:
Alpha One MT5
Burak Baltaci
알파 원 MT5 - 고급 추세 탐지 시스템 알파 원은 전문적인 추세 추종 지표로, 차트에 직접 표시되는 자동 진입, 손절매, 세 가지 이익 실현 수준과 함께 명확한 매수 및 매도 신호를 제공합니다. 이 지표는 실시간 추세 강도와 방향을 반영하기 위해 녹색과 빨간색 사이를 전환하는 15개의 동적 라인으로 구성된 독특한 에너지 필드 시각화 기능을 갖추고 있습니다. 녹색 에너지는 강세 우세를, 빨간색 에너지는 약세 압력을 나타내어 시장 모멘텀을 즉시 시각적으로 파악할 수 있게 합니다. 신호 시스템 신호는 여러 독립적인 분석 차원에서의 모멘텀 변화를 분석하는 다중 확인 과정을 통해 생성됩니다. 각 신호는 차트에 표시되기 전에 여러 구성 요소의 일치된 판단이 필요합니다. 리페인트 없음 보장 모든 신호는 확정된 마감 바에서만 계산됩니다. 신호가 표시되면 절대 이동, 변경 또는 사라지지 않습니다. 과거 데이터에서 보는 것은 실시간에 나타난 것과 정확히 동일합니다. 백테스트 결과는 실제 성
Super Scanner
Li Wei Huang
【Super Scanner】Indicator Introduction : The color of the Super Scanner which is green and climbing up means that the price trend is going up.The color of the Super Scanner is red and going down means that the price trend is going down. It is very simple to use it to judge the market trend! What's even better is that the open parameters of the indicators allow investors to adjust. You can adjust【Super Scanner】according to your needs. Adjust it faster to be closer to short-term market fluctuatio
Paid release: Lorentzian ML Classifier Signals MT5 is a paid MetaCoderStore indicator. Use the product comments for setup questions, feature requests, and feedback for future updates. Lorentzian ML Classifier Signals MT5 is a closed-bar signal indicator inspired by the high-demand Lorentzian distance classification approach used by many TradingView traders. It compares the current market state against similar historical states using Lorentzian distance, then confirms the result with trend, kerne
The indicator is based on the two-buffer scheme and does not require any additional settings. It can be used on any financial instrument without any restrictions. The indicator is a known ZigZag, but it does not redraw . The indicator allows to easily detect significant levels on the price chart, as well as demonstrates the ability to determine the probable direction of a price movement. The calculations are based on the candles' Close prices, thus improving the reliability of the levels. Param
이 제품의 구매자들이 또한 구매함
Trend Sniper X
Sarvarbek Abduvoxobov
4.9 (40)
Trend Sniper X 는 트레이더가 추세 방향과 잠재적 반전 지점을 명확하고 정확하게 포착할 수 있도록 도와주는 MetaTrader 5용 멀티 타임프레임 추세 추종 지표입니다. MT4용: https://www.mql5.com/en/market/product/193245 가격 정보: 현재 가격은 프로모션 할인가이며, 향후 업데이트 및 새로운 기능이 출시됨에 따라 변동될 수 있습니다. 보너스 혜택: 본 지표 전용 무료 자동매매 Assistant EA를 받으시려면 구매 후 작성자에게 메시지를 보내주시기 바랍니다. Code2Profit 채널 멀티 타임프레임 분석으로 시장을 마스터하세요! Trend Sniper X로 승률을 극대화하는 방법: 핵심 규칙 및 세션 팁 기술 사양 플랫폼 MetaTrader 5 지표 유형 멀티 타임프레임 추세 지표 운용 타임프레임 모든 차트 타임프레임 지원, 독립적으로 선택 가능한 상위 타임프레임(M1–MN1) 주요 상품 외환, 금(XAUUSD) 및 기타 C
Smart Trend Trading System — MetaTrader 5 구매 후 MQL5에서 저에게 메시지를 보내시면 Smart Universal Expert Advisor를 무료로 받으실 수 있으며, 온라인 강좌, PDF 매뉴얼 및 비공개 그룹 이용 권한도 함께 제공됩니다. STTS는 추세 방향, 진입·청산 신호, 반전 구간, 주요 가격 수준을 차트에 모아 보여줍니다. 시스템을 참고해 수동으로 거래하거나, 별도의 호환 EA를 연결하여 선택한 설정에 따라 자동으로 거래를 실행할 수 있습니다. 하나의 시스템, 네 가지 트레이딩 접근법 STTS의 트레이딩 접근법은 크게 네 가지로 나뉩니다. • 스캘핑 — 단기 신호와 시장 움직임을 살펴봅니다. • 추세 매매 — 방향을 평가하고 추세 안에서 기회를 찾습니다. • 반전 매매 — 잠재적인 전환 구간과 방향 변화를 파악합니다. • 거래량 매매 — 거래량 기반 정보로 시장 활동을 평가합니다. 진입·청산 화살표, 추세 정보, 지지·저항 수
SuperScalp Pro
Van Minh Nguyen
4.66 (35)
SuperScalp Pro - Professional Multi-Layer Confluence Scalping System SuperScalp Pro는 클래식 Supertrend에 여러 지능형 확인 필터를 추가한 고급 스캘핑 지표입니다. 더 높은 확률의 Buy/Sell 거래 기회를 식별하는 데 도움을 주며, 잘못된 신호를 크게 줄이는 데 도움을 줍니다. 명확한 Buy 및 Sell 화살표가 차트에 직접 표시되며, ATR 기반 Stop Loss 및 Take Profit 수준이 실시간으로 자동 계산됩니다. 구매 후 설정 방법 및 권장 구성에 대한 안내가 필요하시면 저에게 문의해 주세요. SuperScalp Pro Auto Trader를 사용하여 신호를 쉽게 자동화할 수 있습니다: [Auto Trader] 권장 설정 파일 다운로드: [Set File] 전체 문서는 제품 블로그에서 확인할 수 있습니다: [User Guide] 업데이트를 확인하려면 공식 채널에 참여하세요: [Official C
SMC Intraday Formula
VividMind Digital Solutions
5 (26)
먼저 솔직하게 말하겠습니다. 어떤 인디케이터도 단독으로 당신을 수익성 있게 만들어주지 않습니다. 누군가 그렇게 말한다면, 그는 당신에게 꿈을 파는 것입니다. 완벽한 매수/매도 화살표를 보여주는 모든 인디케이터는 완벽하게 보이도록 만들 수 있습니다 — 단지 올바른 과거 구간을 확대하고 승리한 거래만 캡처하면 됩니다. 우리는 그렇게 하지 않습니다.  SMC Intraday Formula는 도구입니다. 시장 구조를 읽고, 가장 높은 확률의 가격 구간을 표시하며, 현재 스마트 머니의 흐름이 어떻게 보이는지 아주 단순한 언어로 보여줍니다. 최종 결정은 여전히 당신이 합니다. 실행도 당신이 합니다. 하지만 이제는 희망이 아니라 정확성으로 거래하게 됩니다. 우리는 이 인디케이터를 지난 약 3년 동안 골드(XAUUSD) 및 주요 외환 통화쌍의 데이 트레이딩 스캘핑에 사용해 왔습니다. M1, M5, M15, M30에서 우리의 핵심 도구입니다. 이 도구는 미래를 예측하려 하지 않습니다 — 지금 형성
Gann Made Easy MT5
Oleg Rodin
5 (10)
Gann Made Easy 는 mr.의 이론을 사용하여 최고의 거래 원칙을 기반으로 하는 전문적이고 사용하기 쉬운 Forex 거래 시스템입니다. W.D. 간. 이 표시기는 Stop Loss 및 Take Profit Levels를 포함하여 정확한 BUY 및 SELL 신호를 제공합니다. PUSH 알림을 사용하여 이동 중에도 거래할 수 있습니다. 구매 후 거래 방법 안내 및 유용한 추가 지표를 무료로 받으시려면 저에게 연락주세요! 아마도 Gann 거래 방법에 대해 이미 여러 번 들었을 것입니다. 일반적으로 Gann의 이론은 초보자 거래자뿐만 아니라 이미 거래 경험이 있는 사람들에게도 매우 복잡한 것입니다. Gann의 거래 방식은 이론적으로 적용하기 쉽지 않기 때문입니다. 나는 그 지식을 연마하고 Forex 지표에 최고의 원칙을 적용하기 위해 몇 년을 보냈습니다. 표시기는 적용하기가 매우 쉽습니다. 차트에 첨부하고 간단한 거래 권장 사항을 따르기만 하면 됩니다. 지표는 지속적으로 시장 분석
새로운 왕의 등장 - 인디케이터 + 주문 관리 표시(TP1 + TP2 + TP3) + 선택형 텔레그램 시그널 전송 기능 포함 (무료) (완전한 트레이딩 및 시그널 시스템) 골드를 위한 최고의 EA: Gold Slayer 이 인디케이터는 고급 전략, 사용자 지정 가능한 주문 관리 시스템, 그리고 엔벨로프 확장을 결합한 평균 회귀(mean reversion) 시스템을 포함하고 있습니다. 또한 RSI와 같은 여러 지능형 확인 필터를 통해 높은 확률의 반전 진입 구간을 포착하여 BUY 및 SELL 시그널을 제공합니다. 단순히 거래 방법만 배우는 것이 아니라, 여러 포지션을 효과적으로 관리하고 이전에 수익 중인 오픈 포지션으로 손실 거래를 커버하는 방법까지 익힐 수 있습니다. M5 전용으로 설계 및 최적화되었으며, 유동성이 풍부해 시그널이 더 깔끔하고 신뢰도 높은 BTCUSD와 XAUUSD에서 뛰어난 성능을 발휘합니다. 이 인디케이터는 ATR 기반으로 자동 계산된 진입가, 손절가, 익절가와
ARIPoint
Temirlan Kdyrkhan
1 (4)
ARIPoint is a powerful trading companion designed to generate high-probability entry signals with dynamic TP/SL/DP levels based on volatility. Built-in performance tracking shows win/loss stats, PP1/PP2 hits, and success rates all updated live. Key Features: Buy/Sell signals with adaptive volatility bands Real-time TP/SL/DP levels based on ATR Built-in MA Filter with optional ATR/StdDev volatility Performance stats panel (Success, Profit/Loss, PP1/PP2) Alerts via popup, sound, push, or email Cu
Auto Optimized SpeedAngle 은 지속적인 워크포워드 최적화(Walk-Forward Optimization, WFO)를 통해 곡선 적합(curve-fitting)을 제거한 기관 수준의 모멘텀 벡터화 시스템입니다. 시장 체제가 바뀔 때 성능이 떨어지는 정적 입력에 의존하는 대신, 이 지표는 표본 외(Out-of-Sample, OOS) 검증을 사용하여 매개변수를 동적으로 재보정하며, 표시되는 신호가 과거의 우연이 아닌 진정한 통계적 우위를 나타내도록 보장합니다. 핵심 기관용 프레임워크 워크포워드 최적화 엔진: 핵심 알고리즘은 수천 가지의 룩백(lookback) 및 임계값 조합을 지속적으로 스캔하며, 데이터를 인샘플(in-sample)과 표본 외(out-of-sample) 세트로 엄격하게 분리합니다. 미지의 데이터 환경에서 수학적 우수성이 증명된 경우에만 새로운 매개변수 구성을 채택합니다. 정량적 목적 함수: 순수한 총이익을 쫓는 대신, 최적화 엔진은 기관 수준의 안정성
Neuro Poseidon MT5
Daria Rezueva
4.75 (52)
Neuro Poseidon is a new indicator by Daria Rezueva. It combines precise trading signals with adaptive TP/SL levels - creating best possible trades as a result! Message me and get  Neuro Poseidon Assistant  as a gift to automize your trading process! What makes it stand out? 1. Proven profitability on all assets and timeframes 2. Only confirmed BUY and SELL signals present on the chart 3. Adaptive TP & SL levels generated by the software for each trade 4. Easy to understand - suitable for al
Entry Points Pro for MT5
Yury Orlov
4.52 (151)
전설이 돌아왔습니다: Entry Points Pro 10. MQL5 마켓 Top-3 자리를 3년간 지켜온 전설적인 지표의 재출시입니다. 수백 개의 호평 리뷰(두 버전 합산 589개), 매일 이 지표로 거래하는 수천 명의 트레이더, 31,000회 이상의 데모 다운로드   MT4+MT5 . 지난 5년간 여러분이 남긴 리뷰를 하나도 빠짐없이 읽었고, 약속 대신 그 답을 버전 10에 담았습니다. 1999년부터 시장에서 활동하며 정직함과 자신의 평판, 그리고 고객을 소중히 여기는 개발자가 만들었습니다. Entry Points Pro의 진입 시그널은 절대 리페인팅되지 않습니다. 그리고 이번에는 개발자의 말뿐이 아니라 검증 가능한 사실입니다: 확정 시그널은 캔들 종가에서만 표시되며, 자동화 테스트에서 리페인팅 0건 이 확인되었습니다(EURUSD, XAUUSD, BTCUSD에서 2,486,568회의 불변조건 검사 — 위반 0건). 검증 방법은 공개되어 있으니 전략 테스터에서 직접 재현해 보실 수
FiboSniper Pro
Van Minh Nguyen
5 (3)
FiboSniper Pro – Multi-Filter Fibonacci System with Auto SL/TP and Control Panel FiboSniper Pro는 동적 Fibonacci Envelopes와 여러 확인 필터를 결합하여 선별된 Buy 및 Sell 신호를 생성하는 기술적 지표입니다. Fibonacci 레벨은 Moving Average와 ATR을 기반으로 계산된 후 ADX, EMA, RSI, ATR, Volume, Time 및 Candle 구조를 통해 필터링됩니다. 이 지표는 ATR 기반의 자동 Stop Loss 및 Take Profit 레벨을 차트에 직접 표시하며, 빠른 설정 조정을 위한 인터랙티브 Control Panel을 제공합니다. 구매 후 권장 설정 파일과 자세한 사용 방법을 받으려면 저에게 문의해 주세요. Auto Trader X를 사용하여 FiboSniper Pro 신호를 자동화할 수 있습니다: [Auto Trader X] User Guide 및 Se
Welcome to ENTRY IN THE ZONE AND SMC MULTI TIMEFRAME SPECIAL BENEFIT / FOR OUR MQL5 CUSTOMERS FREE ACCESS TO THE NEW TOOL  — COMING SOON — Learn more on our official website  : https://www.fableedge.net Entry In The Zone and SMC Multi Timeframe is a real-time market analysis tool based on Smart Money Concepts (SMC), designed to analyze market structure, price direction, and key trading zones. It supports both Single-Timeframe Analysis and Multi-Timeframe Analysis, providing a clearer view of the
Unix Scalper
Issam Kassas
4 (4)
Unix Scalper — MetaTrader 5 구매 후 MQL5에서 저에게 메시지를 보내시면 Smart Universal Expert Advisor를 무료로 받으실 수 있으며, 온라인 강좌, PDF 매뉴얼 및 비공개 그룹 이용 권한도 함께 제공됩니다. 매매 기회를 찾고, 거래 계획을 확인하고, 실행 방법을 선택하세요. UNIX Scalper는 시장 분석, BUY/SELL/WAIT 판단, Entry, Stop Loss, TP1 및 TP2 가격 수준을 하나의 정돈된 패널에 제공합니다. 신호와 거래 계획을 한눈에 • 명확한 판단: BUY, SELL 또는 WAIT. • 구체적인 가격 수준: Entry, Stop Loss, TP1 및 TP2. • 다중 시간대 개요: 패널의 여러 시간대 신호를 비교하세요. • 판단을 돕는 분석: 추세, 모멘텀, 거래량, 변동성, 지지와 저항, 시장 품질. • 다양한 레이아웃: Minimized, Compact, Standard 또는 Full. 신호와
M1 Sniper MT5
Oleg Rodin
5 (7)
M1 SNIPER 는 사용하기 쉬운 거래 지표 시스템입니다. M1 시간대에 맞춰 설계된 화살표 지표입니다. 이 지표는 M1 시간대 스캘핑을 위한 단독 시스템으로 사용할 수 있으며, 기존 거래 시스템의 일부로도 사용할 수 있습니다. 이 거래 시스템은 M1 시간대 거래용으로 특별히 설계되었지만, 다른 시간대에도 사용할 수 있습니다. 원래는 XAUUSD와 BTCUSD 거래를 위해 이 방법을 설계했지만, 다른 시장 거래에도 유용하다는 것을 알게 되었습니다. 이 지표의 신호는 추세 방향과 반대로 거래될 수 있습니다. 저는 지표의 신호를 활용하여 양방향으로 거래할 수 있도록 돕는 특별한 거래 기법을 알려드립니다. 이 방법은 특별한 동적 지지선과 저항선 가격 영역을 활용하는 것을 기반으로 합니다. 구매하시면 M1 SNIPER 화살표 지표를 바로 다운로드하실 수 있습니다. 또한, 아래 스크린샷에 표시된 Apollo Dynamic SR 지표는 M1 SNIPER 도구를 사용하는 모든 사용자에게 무료로
Tokyo mt5 Indicator
Vasiliy Strukov
5 (7)
Tokyo Indicator는 추세 방향, 잠재적 거래 신호 및 시장 상황을 명확하고 시각적으로 보여줍니다. 색상으로 구분된 계단식 추세선은 강세 구간(파란색)과 약세 구간(자홍색)을 명확히 구별해 줍니다. 추세가 전환될 때 나타나는 방향성 화살표는 잠재적인 매수 및 매도 기회를 강조하여 보여줍니다. 통합 대시보드는 현재 신호, 시장 성향(bias), 모멘텀, 변동성, 신호 품질 등의 정보를 한눈에 파악할 수 있도록 구성되어 있습니다. 이를 통해 트레이더는 별도의 패널을 오갈 필요 없이 가격 움직임(price action)과 지표의 데이터를 동시에 분석할 수 있습니다. 깔끔한 차트 화면과 간결한 시장 개요를 제공하는 Tokyo Indicator는 체계적인 추세 분석과 거래 결정을 지원합니다. 모든 시간대와 다양한 자산(특히 금)에서 활용할 수 있습니다. 추세 방향, 잠재적 거래 신호 및 시장 상황을 명확하고 시각적으로 보여줍니다. 색상으로 구분된 계단식 추세선은 강세 구간(파란색)
FX Trend MT5 NG
Daniel Stein
5 (6)
FX Trend NG: 차세대 멀티 마켓 트렌드 인텔리전스 개요 FX Trend NG 는 다중 시간 프레임 기반의 전문 트렌드 분석 및 시장 모니터링 도구입니다. 몇 초 만에 전체 시장 구조를 파악할 수 있도록 설계되었습니다. 여러 차트를 일일이 전환할 필요 없이, 어떤 종목이 추세에 있는지, 어디에서 모멘텀이 약화되고 있는지, 그리고 어떤 시간 프레임이 서로 정렬되어 있는지 즉시 확인할 수 있습니다. 출시 기념 특별 혜택 – FX Trend NG 를 $30 (6개월) 또는 $80 평생 라이선스 로 이용할 수 있습니다. 이미 Stein Investments 고객이신가요? -> 메시지를 보내 전용 고객 그룹에 참여하세요. 설정이나 사용 방법이 필요하신가요? -> Stein Investments 공식 페이지 를 방문하세요. 1. FX Trend NG가 특별한 이유 3단계 추세 로직 – 단순한 Buy / Sell이 아닙니다 • 대부분의 지표는 Buy 또는 Sell 두 가지 상태만 제
Adaptive Price Action Engine 지표를 구매하면 EA(자동매매 프로그램)가 무료 멀티 타임프레임 기반 자기 최적화 추세 & 캔들 패턴 분석 시스템 시장은 끊임없이 변화하며, 모든 Price Action 패턴이 모든 시장 환경에서 동일한 가치를 가지는 것은 아닙니다. Adaptive Price Action Engine 은 변화하는 시장 환경에 적응할 수 있도록 설계되었으며, 추세 구조, 멀티 타임프레임 분석, 캔들 패턴 및 통계적 최적화 를 하나의 분석 프레임워크로 결합합니다. 두 가지 적응형 모드 Dual Alpha Trend Mode 낮은 타임프레임과 높은 타임프레임에서 적합한 Alpha Trend 파라미터를 자동으로 탐색하여, 최근 시장 움직임에 맞춰 추세 분석을 조정합니다. Candlestick + Alpha Mode Alpha Trend를 통한 시장 국면 분석과 22개의 상승 및 하락 캔들 패턴 을 결합합니다. 모든 패턴을 동일하게 취급하는 대신, 다양
Power Candles MT5
Daniel Stein
4.58 (12)
Power Candles V3 - 자체 최적화 강도 지표 파워 캔들 V3는 적용된 모든 차트에서 통화 및 상품의 강세를 실행 가능한 거래 계획으로 전환합니다. 단순히 캔들에 색상을 입히는 대신, 백그라운드에서 실시간 자동 최적화를 수행하여 현재 보고 있는 종목에 대한 최적의 손절매, 익절 및 신호 임계값을 제공합니다. 한 번의 클릭으로 실시간 거래에 적용할 수 있으며, 진입점, 손절매 및 익절 선이 정확한 가격에 맞춰 차트에 표시되고, 방향과 함께 알림이 발령됩니다. 이 도구는 Stein Investments 에코시스템의 일부입니다. 18개 이상의 도구와 함께 당신의 1대1 AI 트레이딩 멘토 Max.  항상 대기 중, 모든 인디케이터를 깊이 있게 이해, 무언가를 차근차근 생각해보고 싶은 순간에 도움을 줍니다.  https://stein.investments 에서 만나보세요 매 종가 바마다 3,000회 이상의 트레이딩 시뮬레이션. 9가지 강도 상태. 2가지 전략을 병렬로 테스트.
Scalper Vault 는 성공적인 스캘핑에 필요한 모든 것을 제공하는 전문 스캘핑 시스템입니다. 이 표시기는 외환 및 바이너리 옵션 거래자가 사용할 수 있는 완전한 거래 시스템입니다. 권장 시간 프레임은 M5입니다. 시스템은 추세 방향으로 정확한 화살표 신호를 제공합니다. 또한 상단 및 하단 신호와 Gann 시장 수준을 제공합니다.  이 시스템은 사용하기가 매우 쉽습니다. 원하는 시장 지역의 화살표만 따라가면 됩니다. 엑시트는 가격이 적정 수준에 도달하거나 시장의 고점 또는 저점 신호가 나타날 때 수행됩니다.  표시기는 PUSH 알림을 포함한 모든 유형의 경고를 제공합니다. 인디케이터 구매 후 연락주세요. 내 개인 거래 권장 사항과 훌륭한 보너스 지표를 무료로 공유합니다! 나는 당신에게 행복하고 유익한 거래를 기원합니다!
Atomic Analyst MT5
Issam Kassas
4.47 (60)
Atomic Analyst — MetaTrader 5 구매 후 MQL5에서 저에게 메시지를 보내시면 Smart Universal Expert Advisor를 무료로 받으실 수 있으며, 온라인 강좌, PDF 매뉴얼 및 비공개 그룹 이용 권한도 함께 제공됩니다. Atomic Analyst는 가격 움직임 분석, 추세 방향, 진입·청산 신호, 손절 수준, 여러 익절 수준을 차트에 모아 보여줍니다. 신호를 확인하고 매매 상황을 이해하세요 Atomic Analyst는 분석 결과를 명확한 시각 정보로 정리합니다. • 잠재적인 진입 기회를 확인할 수 있는 매수·매도 화살표. • 거래 계획에 도움이 되는 손절 수준과 여러 익절 수준. • 시장 방향을 평가할 수 있는 추세, 강도, 모멘텀 수치. • 더 넓은 시장 맥락을 비교할 수 있는 여러 시간대 분석. • 변화하는 시장 상황을 따라갈 수 있는 색상별 캔들과 알림. 신호와 보조 분석을 함께 검토한 다음, 해당 매매 상황이 자신의 거래 규칙에
FX Power MT5 NG
Daniel Stein
5 (33)
FX Power: 통화 강세 분석으로 더 스마트한 거래 결정을 개요 FX Power 는 어떤 시장 상황에서도 주요 통화와 금의 실제 강세를 이해하기 위한 필수 도구입니다. 강한 통화를 매수하고 약한 통화를 매도함으로써 FX Power 는 거래 결정을 단순화하고 높은 확률의 기회를 발견합니다. 트렌드를 따르거나 극단적인 델타 값을 사용해 반전을 예측하고자 한다면, 이 도구는 귀하의 거래 스타일에 완벽히 적응합니다. 단순히 거래하지 말고, FX Power 로 더 스마트하게 거래하세요. 1. FX Power가 거래자에게 매우 유용한 이유 통화와 금의 실시간 강세 분석 • FX Power 는 주요 통화와 금의 상대적 강세를 계산하고 표시하여 시장 역학에 대한 명확한 통찰력을 제공합니다. • 어떤 자산이 앞서고 있고 어떤 자산이 뒤처지는지 모니터링하여 보다 현명한 거래 결정을 내릴 수 있습니다. 포괄적인 멀티 타임프레임 뷰 • 단기, 중기 및 장기 타임프레임에서 통화와 금의 강세를
Divergence Bomber
Ihor Otkydach
4.89 (94)
이 지표를 구매하신 분께는 다음과 같은 혜택이 무료로 제공됩니다: 각 거래를 자동으로 관리하고, 손절/익절 수준을 설정하며, 전략 규칙에 따라 거래를 종료하는 전용 도우미 툴 "Bomber Utility" 다양한 자산에 맞게 지표를 설정할 수 있는 셋업 파일(Set Files) "최소 위험", "균형 잡힌 위험", "관망 전략" 모드로 설정 가능한 Bomber Utility의 셋업 파일 이 전략을 빠르게 설치, 설정, 시작할 수 있도록 돕는 단계별 영상 매뉴얼 주의: 위의 모든 보너스를 받기 위해서는 MQL5 개인 메시지 시스템을 통해 판매자에게 연락해 주세요. 독창적인 커스텀 지표인 “Divergence Bomber(다이버전스 봄버)”를 소개합니다. 이 지표는 MACD 다이버전스(괴리) 전략을 기반으로 한 올인원(All-in-One) 거래 시스템입니다. 이 기술 지표의 주요 목적은 가격과 MACD 지표 간의 다이버전스를 감지하고, **향후 가격이 어느 방향으로 움직일지를 알려주
Crystal Heikin Ashi Signals
Muhammad Jawad Shabir
5 (4)
Crystal Heikin Ashi Signals—Professional Trend & Signal Detection Indicator Advanced Heikin Ashi Visualization with Intelligent Signal System for Manual & Automated Trading Final Price: $149 ---------> Price goes up $10 after every 10 sales . Limited slots available — act fast . Overview User Guide PDF Crystal Heikin Ashi Signals is a professional-grade MetaTrader 5 indicator that combines pure Heikin Ashi candle visualization with an advanced momentum-shift detection system. Designed for both m
DayTrader PRO
Davit Beridze
5 (4)
DayTrader PRO DayTrader PRO는 존 에러스(John Ehlers)의 Laguerre 필터와 강력한 자동 최적화 엔진을 결합한 고급 트레이딩 지표입니다. 고정된 파라미터를 사용하는 대신, 최근 시장 상황을 바탕으로 최적의 설정을 자동으로 검색하므로 지속적인 수동 조정 없이도 변화하는 시장 변동성에 대응할 수 있습니다. 이 지표는 명확한 매수(BUY) 및 매도(SELL) 신호를 생성하며, 현재 시장 변동성을 기준으로 계산된 적응형 손절매(Stop Loss) 및 익절(Take Profit) 레벨을 제공합니다. 내장된 추세, 효율성 지수(Efficiency Ratio), 변동성 및 캔들 필터 기능은 저품질의 진입 신호를 제거하여 신호의 정확도를 높여줍니다. 실시간 성능 대시보드에서는 현재 최적화된 설정값, 수익 요인(Profit Factor), 승률(Win Rate), 최대 낙폭(Drawdown) 및 기타 트레이딩 통계를 확인할 수 있습니다. 또한 DayTrader PR
Quant Direction MT5
Georgios Kalomoiropoulos
Quant Direction 은 3D 시장 분석 도구입니다. 다양한 매개변수에 걸쳐 정확한 백분율 편차를 계산하면서 완벽하게 객관적인 알고리즘 기반 시장 분석을 제공합니다. 첨단 AI 기반 모델링 도구와 엄격한 테스트를 거쳐 개발된 이 알고리즘은 타의 추종을 불허하는 정확도로 시장을 분석합니다. 플랫폼에서 모든 통화쌍 또는 금융 상품을 분석할 수 있습니다. 단기 거래, 데이 트레이딩, 스윙 트레이딩 등 어떤 유형의 거래를 하든 Quant Direction은 최적의 선택입니다. 운영자가 되는 것의 진정한 이점 퀀트 디렉션의 진정한 장점은 감정, 눈의 피로, 과도한 분석을 완전히 배제한다는 점입니다. 더 이상 수십 개의 차트를 일일이 살펴보며 방향을 찾거나 자신의 판단에 끊임없이 의문을 품을 필요가 없습니다. 이 시스템은 8개의 시간 간격(5개월에서 수개월까지)을 밀리초 단위로 처리합니다. 특정 시점의 주요 시장 참여자를 정확하게 식별하여 항상 성공 확률이 가장 높은 방향으로 거래할
Btmm state engine pro
Garry James Goodchild
5 (4)
BTMM State Engine Pro by G-Labs — Beat The Market Maker indicator for MetaTrader 5. Asian session range, London and New York kill zones, level progression (L1/L2/L3), peak formation detection (PFH/PFL), entry signals, and a multi-pair scanner from one chart. Stop scanning charts one pair at a time. The State Engine tracks the BTMM daily cycle automatically — Asian box, room boundaries, level blocks, peak formations, and filtered entries — while the scanner dashboard shows level, peak status, d
SkyHammer Signal Pro
Shengzu Zhong
5 (4)
SkyHammer Signal Pro Entry, SL, TP 레벨이 고정되는 전문 No-Repaint 추세 신호 인디케이터 SkyHammer Signal Pro는 명확하고 고정되며 검증 가능한 신호를 원하는 트레이더를 위해 설계된 구조적인 추세 및 모멘텀 신호 인디케이터입니다. 특히 M1 및 M5 같은 낮은 시간대에서 가장 효과적으로 작동합니다. 이 인디케이터는 시장의 고점이나 저점을 예측하려고 하지 않습니다. 대신 신호를 생성하기 전에 확인된 시장 구조, 추세 방향, 모멘텀 강도, 건강한 변동성, 그리고 목표까지의 충분한 공간을 기다립니다. 주요 기능 고정 신호 메커니즘 신호가 확인되면 화살표, Entry, Stop Loss, TP1, TP2 레벨이 차트에 영구적으로 고정됩니다. 이후 캔들 움직임 때문에 신호가 사라지거나, 이동하거나, 변경되지 않습니다. 이를 통해 트레이더는 각 신호를 명확하게 검토할 수 있으며, 실시간 시장에서 신호가 사라지는 일반적인 문제를 피할 수 있습니다
ATstrong
Zaha Feiz
5 (1)
ATSTRONG PRO: 시장 구조 및 돌파(Breakout) 지표 돌파 감지 엔진 | 5개의 동적 TP 목표 | 실시간 대시보드 패널 | 리페인팅 없음 출시 기념 가격 현재 가격: $59 — 10개가 판매될 때마다 가격이 $10씩 인상됩니다. ATSTRONG PRO 는 MetaTrader 5 전용으로 설계된 고급 돌파 및 기관 수준의 시장 구조 지표입니다. 높은 확률의 스윙 피벗을 감지하고, 군집된 지지 및 저항 축적 영역을 식별하며, 실시간으로 구조 붕괴(BOS) 및 특성 변화(CHoCH) 신호를 제공합니다. 이 지표는 차트 위에 동적 손절매(Stop Loss)와 5개의 개별 이익 실현 수준(TP1 ~ TP5)을 자동으로 그려주며, 위험 대비 보상 투영 상자, 별점으로 매겨진 신호 품질 등급, 실시간 온차트 성과 분석 대시보드를 함께 제공합니다. 거래 주의 사항: 이 지표는 수동 거래 및 시장 분석용입니다. 캔들이 마감될 때 시각적으로 명확한 신호, 레벨, 알림을 리페인팅
Precision Spike Detector
Francisco Mandomo Simbine
5 (2)
Precision Spike Detector V3 – Institutional-Grade AI Trading System Attention: The price increases by US$50 for every 10 purchases.  Final price: US$599 Precision Spike Detector V3   is a   state-of-the-art, institutional-grade market analysis system   for   MetaTrader 5 , designed to detect   high-probability market movements   in synthetic indices such as   Boom, Crash, GainX, and PainX . After purchase, send me a private message to receive the optimized configuration files,  the installation
UZFX {SSS} 스캘핑 스마트 시그널 v5.0 MT5는 급변하는 시장에서 정확한 실시간 시그널을 필요로 하는 스캘퍼, 데이 트레이더, 스윙 트레이더를 위해 설계된 리페인팅이 없는 고성능 트레이딩 지표입니다. (UZFX-LABS)에서 개발한 이 지표는 가격 움직임 분석, 추세 확인 및 스마트 필터링을 결합하여 모든 통화 쌍과 시간대에서 높은 확률의 매수 및 매도 신호, 경고 신호, 추세 지속 기회를 생성합니다. 거래에 대한 망설임을 멈추고, 명확성, 정밀성, 그리고 규율 있는 시장 실행을 원하는 트레이더를 위해 설계된 체계적인 신호 시스템을 따르기 시작하세요. 제 말을 믿으세요. 이 지표는 MQL5에서 구할 수 있는 최고의 지표 중 하나입니다. 그러니 절대 놓치지 마세요!! “현명한 트레이더를 위한 스마트 신호” 지금 최신 버전 5.0이 출시되었으며, 사전 공지 없이 가격이 최대 $499.99까지 인상될 수 있으니 기회를 놓치기 전에 서둘러 구매하세요!! 최종 구매 전! 무료 체
제작자의 제품 더 보기
Footprint Matrix Pro turns your MetaTrader 5 chart into an order-flow footprint chart . Every column shows who traded at each price: aggressive buyers lifting the ask against aggressive sellers hitting the bid. It is built from the real tick history of your broker, and every number is recorded tick by tick from the market data. You can see absorption, exhaustion, imbalances and real displacement as they happen, inside the candle and not only after it closes. Five footprint modes (one click) Bi
Signal Verdict Pro reads the indicators that are already on your chart, finds the signal that just fired and gives it a verdict : does this signal have substance, or is it noise? Every signal gets a score from 0 to 100 from 17 scenario checks, the indicator's own track record on this chart and a live repaint test. You keep your indicators and your strategy. Signal Verdict Pro adds the second opinion: STRONG , VALID , WEAK or REJECT , with the reasons for and against the trade. Works with the i
Currency Velocity Matrix shows the strength of the 8 major currencies ( EUR, GBP, AUD, NZD, USD, CAD, CHF, JPY ), calculated from all 28 pairs . It also shows the rate of change : which currency is gaining strength the fastest and which one is losing it the fastest. Knowing which currency is strong is not enough. A strong currency may already be losing momentum. The best opportunities usually appear when the currency gaining strength the fastest meets the currency losing strength the fastest . T
Market Maker Cycle Matrix shows the daily market maker cycle on your MetaTrader 5 chart. The Asian session builds a range. The London open often runs the stops on one side of it. Then the real move starts, room after room, until the market maker reaches the target and the cycle turns. The indicator tracks this cycle for you: the Asian range , the kill zones , the level count L1 / L2 / L3+ , the peak formation that turns the cycle, and five M15 entry types with entry, stop loss and two targets. A
Gold Killzone Sweep Matrix trades the most famous ICT idea for gold. Every kill zone (Asia, London, New York) leaves a high and a low . Stop orders sit beyond them, and that is liquidity . Smart money takes this liquidity (the sweep ) and then turns the market (the change of character, CHoCH ). Most kill zone indicators only draw the lines and leave the rest to you. This one does the whole job. It finds the sweep, confirms the CHoCH and prints a buy or sell arrow with entry, stop loss and target
Triple Edge Prop – three rule-based NASDAQ-100 intraday strategies in one Expert Advisor. Each engine has its own logic, its own magic number, its own timeframe and its own trading window. Together they cover three different market situations: a volatility breakout , an institutional VWAP pullback and an overnight bias breakout . Built for prop-firm challenges and funded accounts, with a full challenge guard on board. Why three strategies instead of one? A single strategy goes through losing
Momentum Decoupling Scalper turns a popular 1-minute scalping method for gold into clear, non-repainting signals. A signal on the 15-minute chart arms the setup, the first momentum candle on the 1-minute chart is the entry, and every trade comes with a stop loss, three targets (TP1 / TP2 / TP3) and an automatic break-even . The part most traders skip is the one that matters: the market must move on its own momentum against the US dollar . The indicator measures the dollar for you (the broker's d
Trend Exhaustion Radar answers one question that every trader asks in a strong move: is this trend running out of strength? Instead of watching three oscillators at the same time and missing the moment, the indicator reads DI+ / DI-, ADX and RSI for you, finds the classic warning signs - extreme zones, divergences, ADX hooks - and combines them into one traffic light with a rule score from 0 to 6. You get three windows in one product: the price chart with a 9/21 EMA cloud, warning markers and di
필터:
리뷰 없음
리뷰 답변