Volatility Range Compass

  • Göstergeler
  • Kay Zaremba
    Kay Zaremba
    Trader and MQL4 / MQL5 / Pine Script developer behind trader.lifestyle.
    YouTube: youtube.com/@traderlifestyle
    What I do:
    • Build free indicators and Expert Advisors for MT4, MT5
    • Turn strategies from YouTube videos, TradingView scripts and forum posts into working code
  • Sürüm: 1.0
  • Etkinleştirmeler: 5

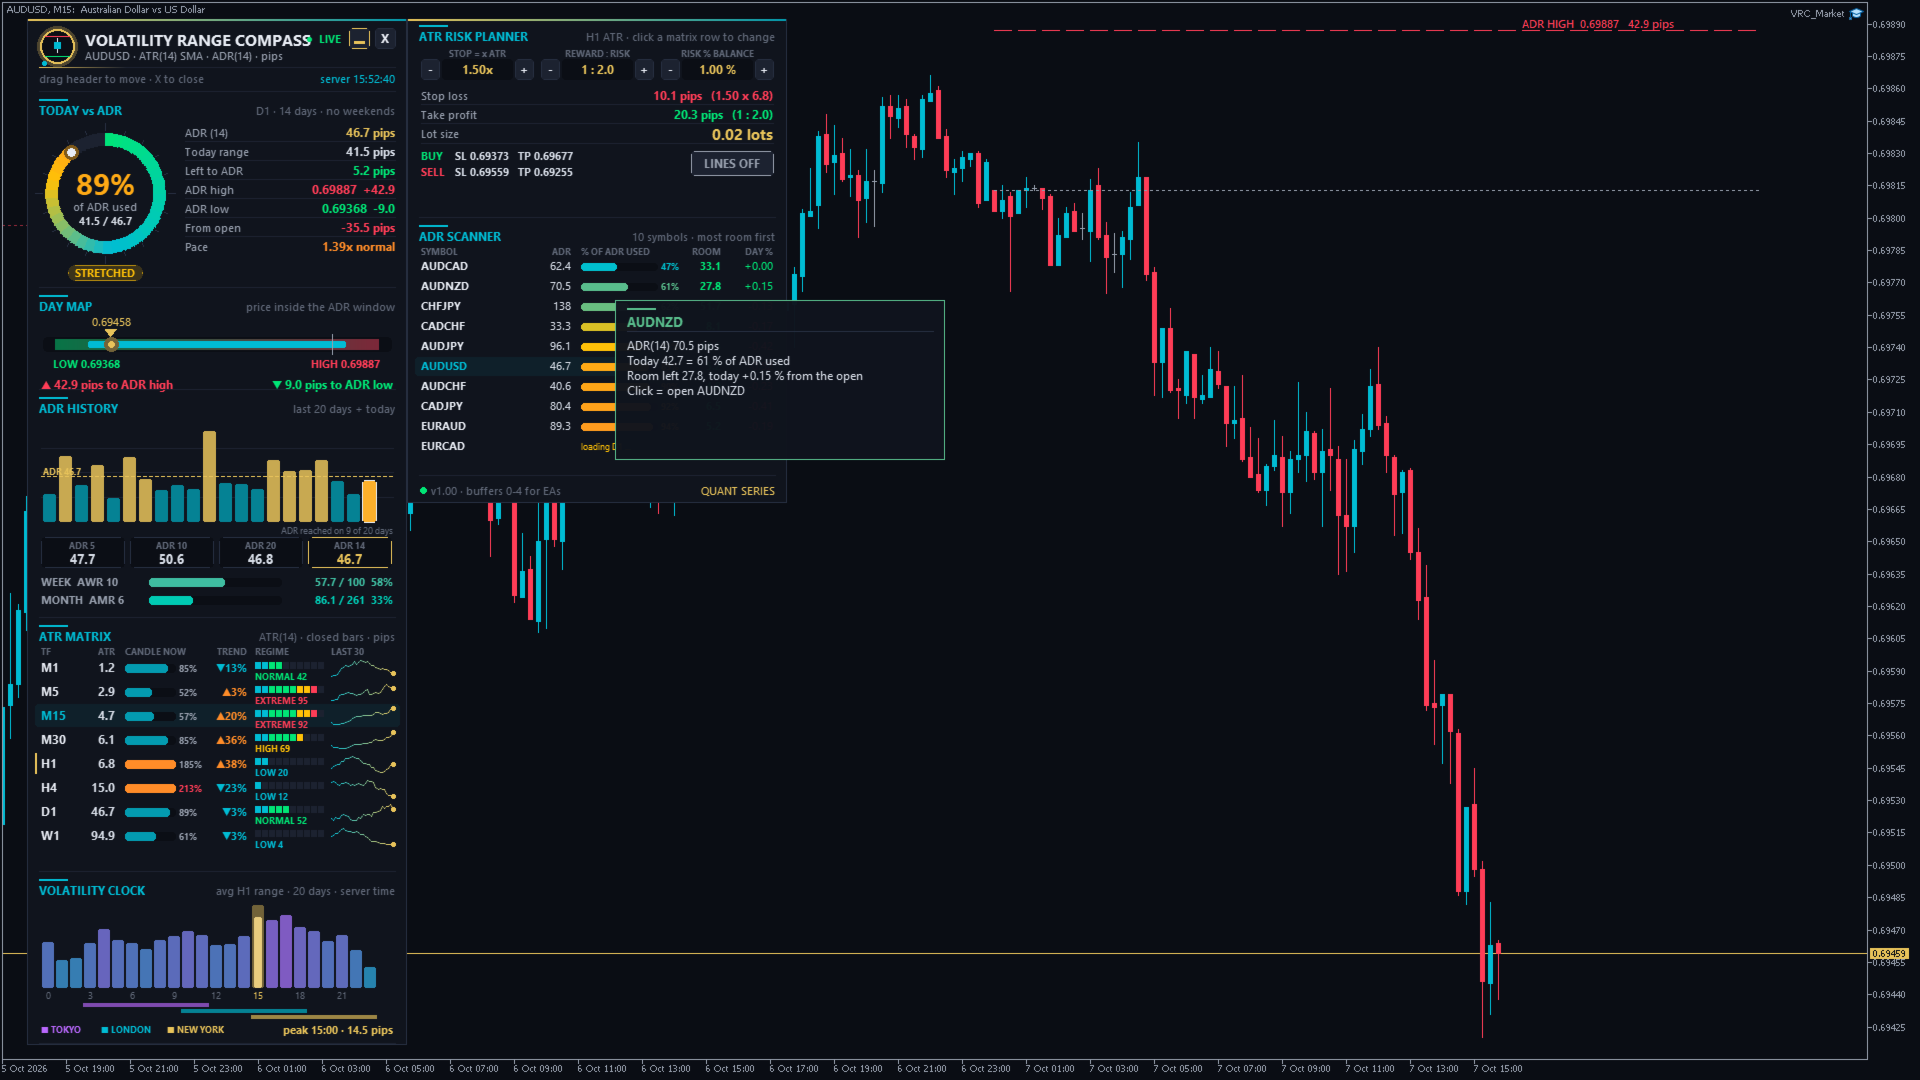
Volatility Range Compass is a volatility dashboard for MetaTrader 5. It answers the questions every trader has before entering a trade:

  • How far does this market normally move in a day, a week, a month? (ADR, AWR, AMR)
  • How much of today's normal move is already done, and is there still room? (% of ADR used, ADR targets)
  • How volatile is each timeframe right now compared with its own history? (ATR matrix M1 to W1 with regime)
  • Which hours of the day move the most? (volatility clock)
  • How big should my stop be, and which lot size keeps my risk at exactly 1 %? (ATR risk planner)
  • Which of my symbols still has the most room today? (ADR scanner)

Everything is calculated from the price history of your broker. There are no external servers, DLLs or internet connections. The indicator never opens or closes trades.

■ The terms in 30 seconds

  • ATR (Average True Range) = the average size of the last N candles (default 14), including gaps. An H1 ATR of 12 pips means an H1 candle is usually about 12 pips tall.
  • ADR (Average Daily Range) = the average distance between the daily high and the daily low over the last N completed days (default 14). Weekend candles are skipped by default.
  • AWR / AMR = the same for weeks (default 10) and months (default 6).
  • ADR high target = today's low + ADR. If price keeps rising, a normal day usually ends around this level.
  • ADR low target = today's high - ADR. If price keeps falling, a normal day usually ends around this level.
  • % of ADR used = today's range (high - low) divided by the ADR. 100 % = today has already moved as much as an average day.

■ Installation and first start

  1. After the purchase, the indicator appears in the MetaTrader 5 Navigator under Indicators > Market.
  2. Drag Volatility Range Compass onto any chart (forex, gold, silver, indices, crypto, any timeframe).
  3. Click OK. The default settings work for every symbol, so you do not need to change anything.
  4. On the first start the indicator loads the history of all timeframes (M1 to W1). Depending on your broker this takes a few seconds. Sections that are still loading show LOADING.
  5. Drag the dashboard by its header to any place on the chart. Position and settings are remembered for each chart.

■ The dashboard, section by section

1. Header
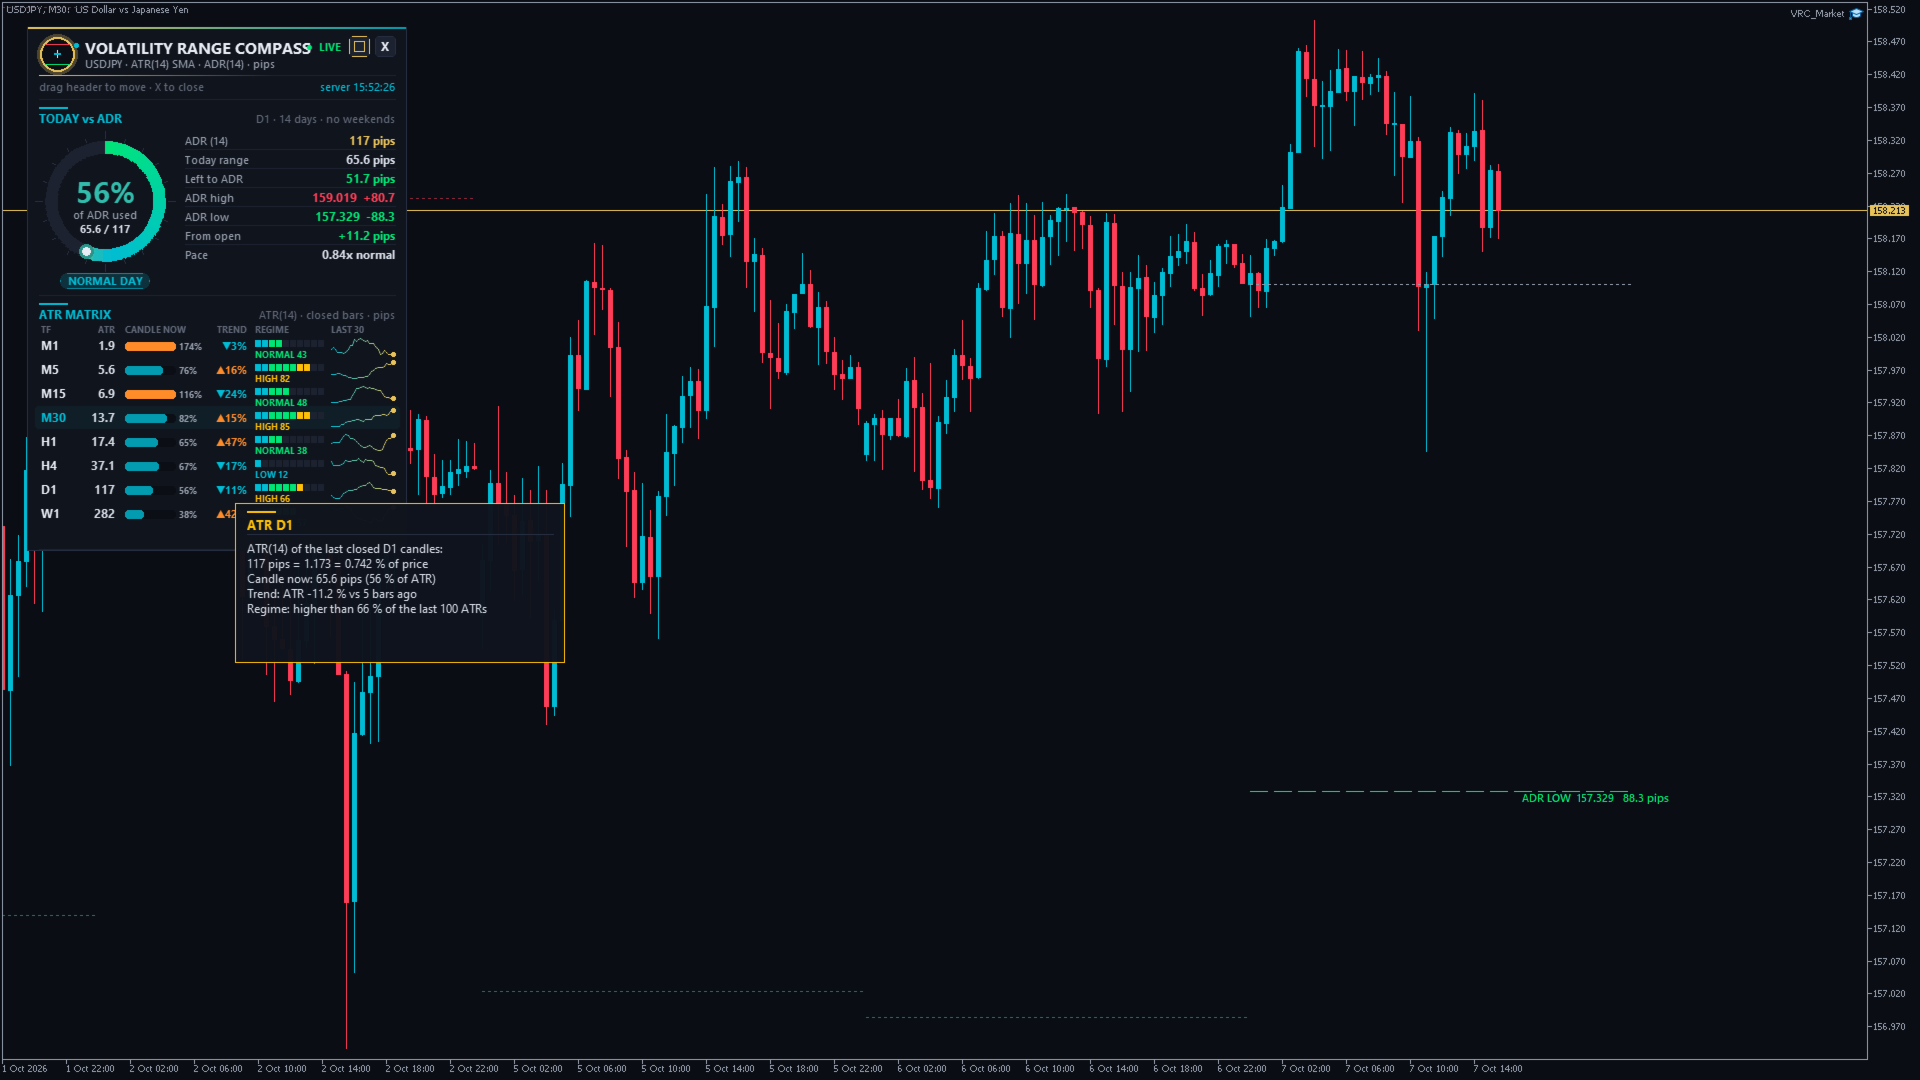
Symbol, ATR period and method, ADR period and the unit used (pips or points). The dot shows LIVE or LOADING and the server time is shown on the right. Buttons: ▭ switches between the full dashboard and the compact panel, and X folds the dashboard into a small pill. Click the pill to open the dashboard again.

2. Today vs ADR
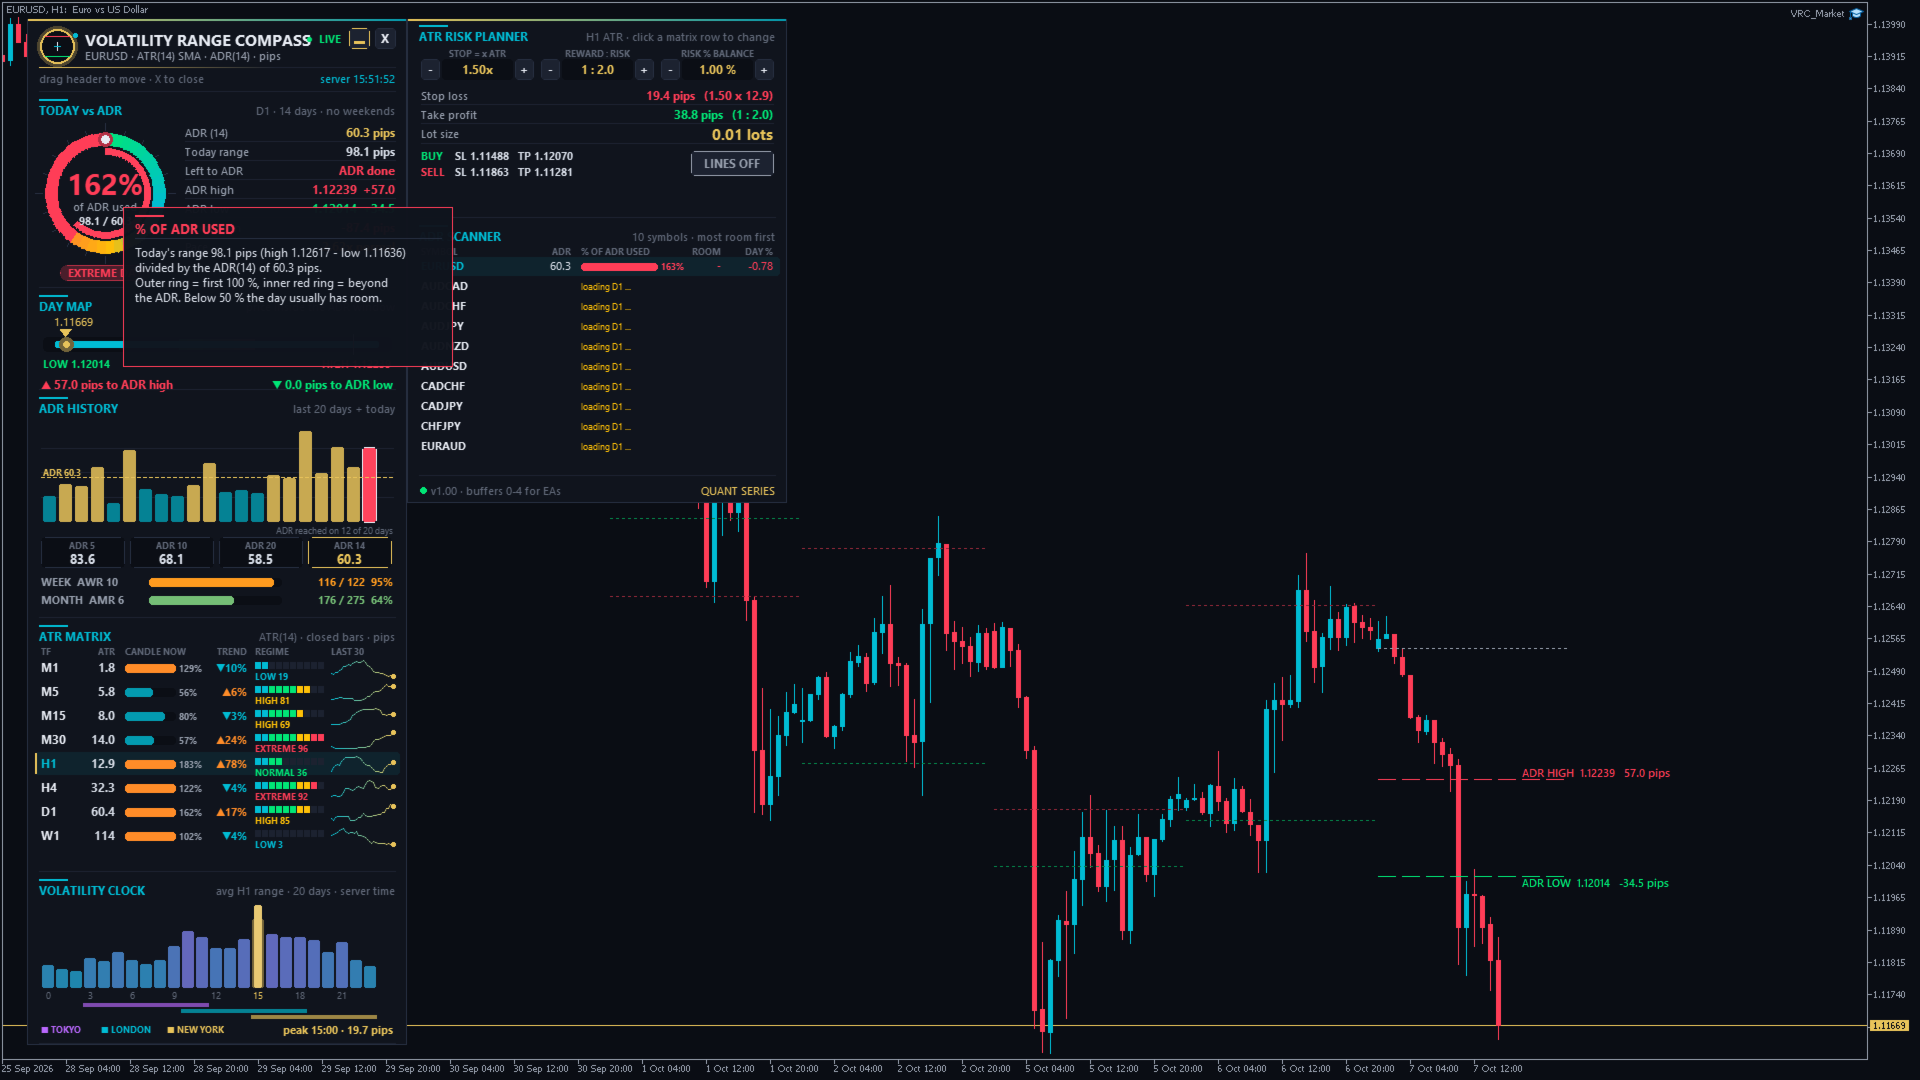
The ring shows how much of today's ADR is already used. The outer ring fills up to 100 %, and a red inner ring shows the part beyond 100 %. Below the ring, the day status:

  • ROOM TO RUN (below 50 %): the day has most of its normal move still ahead.
  • NORMAL DAY (50-80 %)
  • STRETCHED (80-100 %): most of the normal move is done.
  • ADR HIT (100-130 %): an average day would be over.
  • EXTREME DAY (above 130 %): unusually large day, often news or trend days.

On the right: ADR, today's range, range left to the ADR, ADR high and low target with the distance from the current price, distance from the day's open and the pace. The pace compares today's movement with what is normal at this time of the day (from the volatility clock). 1.0x = normal, 1.5x = the day is moving 50 % faster than usual, 0.5x = a slow day. Early in the day (before about 6 % of the normal daily movement) it shows early in day.

3. Day map
A horizontal map of today. The coloured track is the ADR window from the ADR low target (green) to the ADR high target (red). The cyan bar is today's range, the grey tick is the day's open and the gold marker is the current price. Below it you see how many pips are left to each target. The window shrinks as the day range grows, and when the cyan bar fills it, the ADR is done.

4. ADR history
The last 20 days and today as bars. Gold bars reached the ADR that was valid on that day, and cyan bars did not. The dashed line is the current ADR, and the counter shows on how many of the 20 days the ADR was reached. Below: ADR 5 / 10 / 20 / 14 (a short ADR above the long ADR = volatility is rising) and the weekly (AWR) and monthly (AMR) range with the share already used this week and this month.

5. ATR matrix (M1 to W1)
One row per timeframe, always using closed candles:

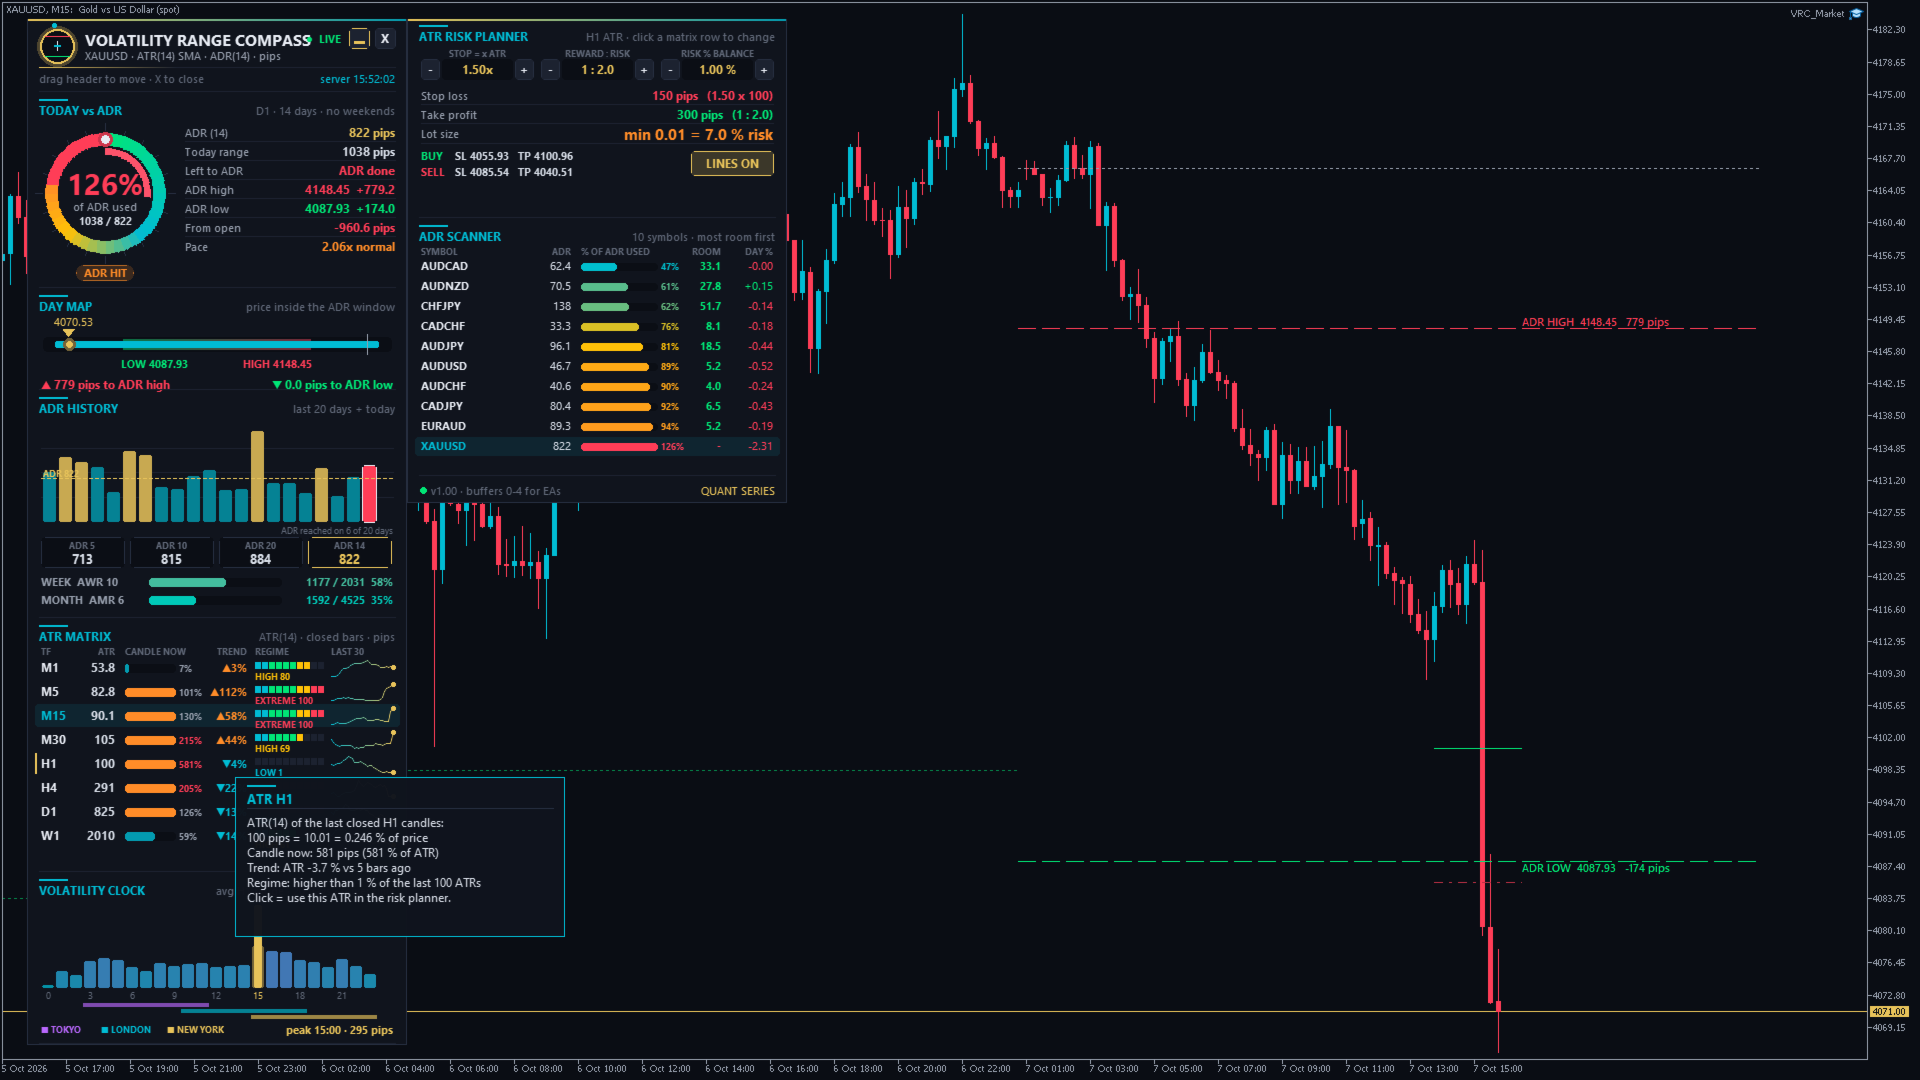
  • ATR in pips (forex), in 0.10 steps (gold, shown as pips) or in points (indices, crypto).
  • Candle now: the current candle's range in % of its ATR. Above 100 % = the candle is already bigger than normal (orange).
  • Trend: ATR now compared with 5 candles ago. ▲ = volatility is rising, ▼ = it is falling.
  • Regime: rank of the current ATR among the last 100 ATR values. LOW (below 20), NORMAL (20-60), HIGH (60-85), EXTREME (above 85).
  • Last 30: sparkline of the last 30 ATR values.

The row of the chart timeframe is highlighted. Click a row to use the ATR of that timeframe in the risk planner (gold marker).

6. Volatility clock
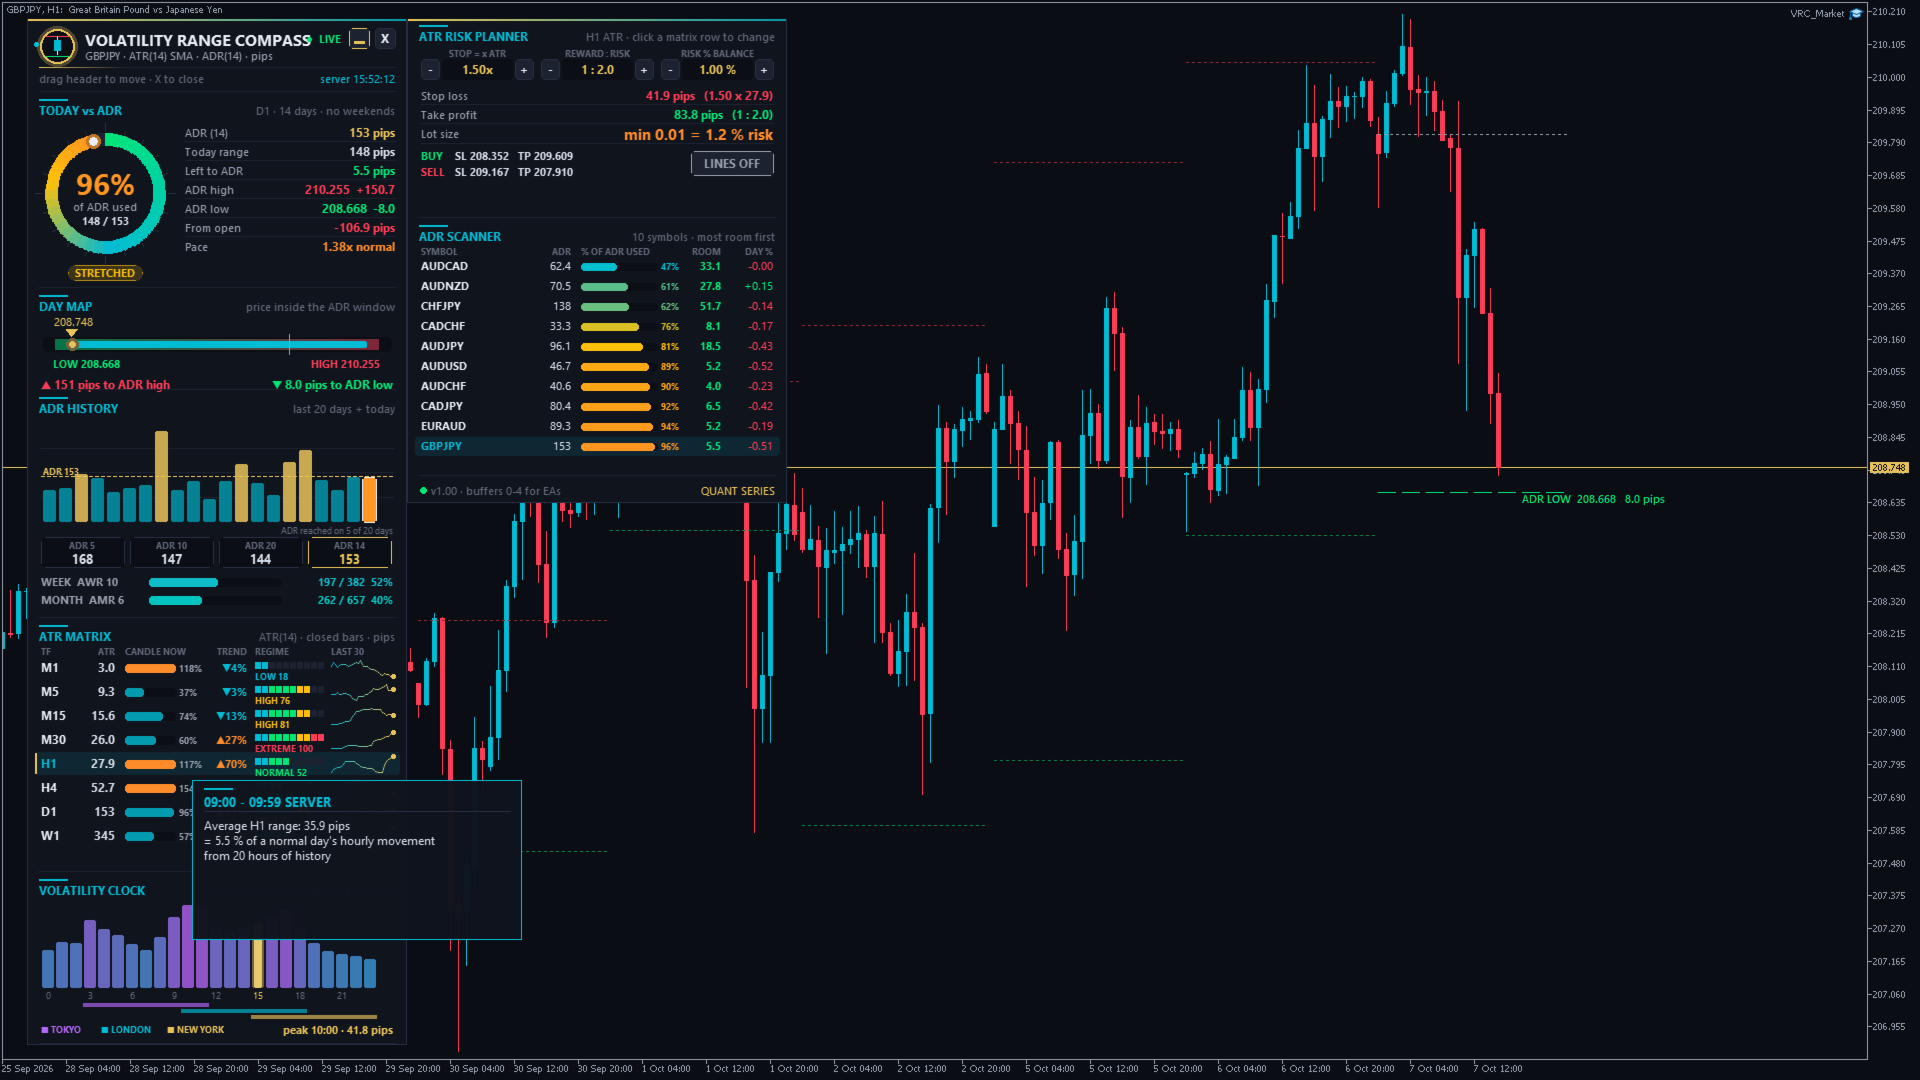
Average H1 range of each hour of the day over the last 20 days, in server time. The gold bar is the current hour and its inner bar shows how much this hour has moved so far. Below the bars are the Tokyo, London and New York sessions shifted to your server time, and the peak hour with its average range.

7. ATR risk planner
Calculates the stop, the target and the lot size from the ATR:

  • STOP = x ATR (0.5 to 3.0), REWARD : RISK (0.5 to 5.0) and RISK % BALANCE (0.25 to 5 %). Change them with the - / + buttons.
  • Stop loss and take profit in pips, plus the exact price levels for a BUY from the ask and a SELL from the bid.
  • Lot size calculated from the tick value of your broker and your balance. It is always rounded down to the lot step, so the real risk is never higher than the chosen %. If even the minimum lot is too large for the chosen risk, the planner shows the real risk of the minimum lot, for example min 0.01 = 7.0 % risk.
  • LINES ON / OFF draws the BUY and SELL stop loss and take profit lines next to the price.

The planner only calculates and never places orders.

8. ADR scanner
Up to 14 symbols (your Market Watch or your own list), sorted with the most room first. Columns: ADR, % of ADR used, room left to the ADR and today's % change. The chart symbol is always included. Click a symbol to open it in this chart or in a new chart (input).

9. ADR targets on the chart
Dashed lines for today's ADR high target (red) and ADR low target (green) with price and distance, a dotted line for the day's open, and dotted lines for the final ADR targets of the last 5 days. The targets move live during the day. Hover any line to see its details.

Tooltips: hover any value, bar or row in the dashboard to see what it means and how it is calculated.

■ How to use it - step by step

Before you enter a trade:

  1. Look at % of ADR used. Below 50 % (ROOM TO RUN), the day usually still has movement left. Above 100 % (ADR HIT), most of the day's normal move is done, so new breakout trades have less room and reversals become more likely.
  2. Check the distance to the ADR target in your trade direction. If you want 40 pips but only 15 pips are left to the ADR high target, the trade needs an above-average day.
  3. Check the pace. A pace above 1.3x early in the session often points to a trend or news day. A pace below 0.7x points to a quiet range day.
  4. Check the regime of your trading timeframe in the ATR matrix. HIGH or EXTREME = wider stops are needed. LOW = expect smaller moves or a coming expansion.
  5. Check the volatility clock. Entries right before the peak hours have the most movement ahead of them.

Plan the trade:

  1. Click the row of your trading timeframe in the ATR matrix.
  2. Set the stop to 1.5x ATR (a common starting value), your reward : risk and your risk %.
  3. Read the lot size and the SL / TP price levels from the planner, or switch LINES ON to see them on the chart.
  4. Enter the trade with your usual order panel. The indicator does not trade.

Example (EURUSD): ADR = 60 pips, today's range = 25 pips (42 % used, ROOM TO RUN), pace = 1.1x, price is 20 pips below the ADR high target. H1 ATR = 13 pips, regime NORMAL. Stop 1.5 x 13 = 19.5 pips, target 1 : 2 = 39 pips. The target lies beyond the ADR high target, so a smaller target (about 20 pips) or a better entry fits a normal day better. With a 10,000 USD balance and 1 % risk the planner shows the lot size for 100 USD at a 19.5 pip stop.

Other typical uses:

  • Take profit at the ADR target: many day traders close at or before the ADR high / low target.
  • Avoid late entries: skip breakout trades on ADR HIT or EXTREME DAY.
  • Fade extremes: when price reaches the ADR target with a falling pace, look for reversal signals from your own strategy.
  • Choose the symbol: the scanner shows which pairs still have room today.
  • Adjust stops to volatility: use ATR-based stops instead of fixed pips, so your stop is wide enough in volatile phases and tight in quiet ones.

■ Alerts

  • ADR levels: an alert when today's range reaches 80 % and 100 % of the ADR (input ADR used levels, comma separated, for example 50,80,100,130). Each level fires once per day. Levels that were already passed when you load the indicator do not fire.
  • Volatility spike: an alert when the current chart candle is at least 2 x ATR big (input spike = candle range >= N x ATR).
  • Delivery as popup, sound, push notification to the MetaTrader app on your phone and / or e-mail. Push and e-mail must be set up in MetaTrader under Tools > Options > Notifications / Email.

■ Inputs - every setting explained

ATR
period (14) number of candles in the ATR
smoothing method (SMA) SMA = MetaTrader's standard ATR (identical values). Wilder / RMA = TradingView standard. EMA = reacts faster.
matrix timeframes (M1,M5,M15,M30,H1,H4,D1,W1) comma separated list, maximum 9. Allowed: M1, M5, M15, M30, H1, H4, D1, W1, MN
regime = rank inside the last N values (100) how many past ATR values are used for LOW / NORMAL / HIGH / EXTREME
ADR
days in the ADR (14) completed days in the average daily range
skip Saturday / Sunday candles (true) ignores the small weekend candles some brokers have, so they do not lower the ADR
weeks in the AWR (10), months in the AMR (6) periods of the weekly and monthly average range
Alerts
ADR used levels in % (80,100) leave empty to switch the ADR alerts off
volatility spike (true), multiplier (2.0) alert when the chart candle reaches N x ATR
popup / sound / push / e-mail how alerts are delivered
Chart
draw ADR high / low targets (true) lines and labels on the chart
ADR targets of the last N days (5) history of the final targets (0 = off)
draw the day open (true) dotted line at today's open
colours ADR high target, ADR low target, day open
Planner (start values, change them later with - / + in the dashboard)
stop loss = N x ATR (1.5), take profit = R x stop (2.0), risk in % of balance (1.0) start values of the planner
Scanner
symbols (empty) your own list, for example EURUSD,GBPUSD,XAUUSD,US30. Empty = the first symbols of the Market Watch. Use the exact symbol names of your broker (with suffix, for example EURUSD.r).
max. symbols (10) 1 to 14
click on a symbol switch this chart / open a new chart / do nothing
Display
volatility clock days (20) days of H1 history for the clock and the pace
pip size (Auto) Auto = forex pips, gold 0.10, silver 0.01, indices / crypto points. Broker points, or a custom pip size in price units.
full dashboard or compact panel start mode (you can switch any time with the button)
move away from other panels (true) if other panels are on the chart, the dashboard moves to a free place, switches to the compact panel or folds to the pill
start X / Y (20 / 30) first position in pixels. After that you can drag the dashboard anywhere.
show tooltips (true) explanations on mouse hover
EA buffers: bars calculated (1500) how many bars the 5 buffers are filled for

■ For Expert Advisors (iCustom)

Buffers: 0 = ADR (price units), 1 = ADR high target, 2 = ADR low target, 3 = ADR used in %, 4 = ATR of the chart timeframe. Buffers 0-3 are empty on D1 and higher timeframes and on days whose first bar is outside the calculated window. The ADR of each day only uses the days before it, so values of closed bars do not repaint.

■ FAQ

Why are the values different from another ADR indicator? Check three things: the number of days, whether weekend candles are skipped, and whether today is included. This indicator uses completed days only and skips weekend candles by default.

Gold shows "pips" - what is a pip on gold? In Auto mode, 1 pip on gold = 0.10 USD of price movement (for example 2350.00 to 2350.10). Choose broker points or a custom pip size if you prefer another unit.

Which timezone is used for days and hours? The server time of your broker, the same as the D1 and H1 candles of your chart.

The dashboard covers my candles. Drag it to another place, click ▭ for the compact panel, or click X to fold it to a small pill.

A section shows LOADING. MetaTrader is still downloading the history of that timeframe. It disappears after a few seconds. If it stays, open a chart of that timeframe once.

Can I use it on several charts? Yes. Every chart keeps its own position and settings.

■ Notes

  • MetaTrader 5 indicator for the main chart window. It works with every broker and symbol: forex, gold, silver, indices, crypto, energies.
  • In the Strategy Tester (visual mode) the full dashboard runs on the tester history. Clicking a scanner symbol does not switch charts there.
  • The indicator does not trade. It is an analysis and planning tool and does not guarantee profits.
Önerilen ürünler
Phoenix Orb Asia
Nigel Nii Darku Narnor Darko
This is a professional-grade institutional toolkit designed for breakout traders and trend followers worldwide. It specializes in the  Opening Range Breakout (ORB)  strategy—one of the most consistent ways to capture intraday volatility during the London and New York opens. This indicator does the heavy lifting for you by automatically mapping out the high and low of the first 15 minutes of any session. It combines this with  Smart Money Concepts (SMC) , identifying structural shifts like  BOS
I recommend you to read the   product's blog  (manual) from start to end so that it is clear from the beginning what the indicactor offers. This multi time frame and multi symbol divergence dashboard indicator sends an alert when one or two different divergences have been identified. It can be used with all time frames from M1 to MN. Maximum 9 time frames can be shown in the dashboard at the same time. It is possible to enable moving average, RSI or Bollinger bands trend filter to filter out on
Wilizard SMC Suite is a complete Smart Money Concepts / ICT toolkit in a single, fast, non-repainting indicator. Instead of loading six separate tools onto one chart, you get every institutional-style concept — market structure, order blocks, fair value gaps, liquidity, premium/discount, killzones, a multi-timeframe dashboard and confluence signals — working together, all confirmed on closed bars. Everything you see is calculated on CLOSED candles only. Nothing shifts, redraws, or disappears a
Arnold Tradenegger
Saiful Izham Bin Hassan
Arnold Tradenegger Elite, modern piyasa koşulları için tasarlanmış dayanıklı bir algoritma üzerine inşa edilmiş profesyonel sınıf bir Uzman Danışmandır. Dinamik piyasa filtrelemesini kurumsal seviyede risk yönetimiyle birleştirir. Sistem, MACD, Hareketli Ortalamalar, RSI, Stokastik ve MFI’yi içeren çoklu gösterge onay matrisini kullanarak girişleri hassas bir şekilde zamanlar. İşlemleri zorlamak yerine uyum sağlamak için inşa edilmiştir; volatil hareketler sırasında pozisyonları korumak için di
Emotions are a weakness. QHO mathematics is the future of your trading! You know what really truly frustrating?  Information garbage and noise. All those legacy, lagging indicators on the charts look like an attempt to steer a rocket ship with a steam engine. They are useless. They look at the past while the market is already flying forward on next-gen tech. We created QHO. This is not just another indicator. This is pure mathematics crushing market chaos right on your chart. Imagine completely
Breakout Entry Signals MT5
Christopher Graham Parish
!! FLASH SALE !!   Over 80% off !!     For ONE week only. Now only $47 - normally $297! >>>      Ends on 30 June 2023 - Don't miss it! Buy and Sell Alerts when price breaks out following strict price action. Sends Alerts – #On MT5 To Your Phone To Your Email Does not repaint . Works on any Forex pair, any timeframe. 10 Activations allowed so you are free from limitations >> MT4 Version Here For spreads from a tiny 0.1pip RAW/ECN Accounts,  click here . Check out my Waka Esque EA signal here
Ultimate Double Top & Bottom (Pro Volume Matrix) Stop trading retail breakouts. Start trading Institutional Traps. The   Ultimate Double Top & Bottom   is not a standard, lagging pattern scanner. It is a highly advanced, non-repainting structural engine equipped with a proprietary   3-Leg Volume Matrix . Designed exclusively for Smart Money Concepts (SMC) and order flow traders, this indicator mathematically dissects the tick volume inside M and W patterns to reveal true institutional intent:  
ToolBox 360 is the swiss knife of all indicators. It is full packed with useful tools to help you with your trading. It can be used to find best entry and exit points and help you to decide if you should open a trade or not. It shows market trends, candlestick formations outside / inside bars and you can sett time based allerts. Main features: Time based Fibonacci lines Choose a start and end time and the indicator shows you Fibonacci lines within the selected time range including range high a
DS 2MV Candles Colors
Herminio Jesus Da Costa Machado
DS 2MV Candles Colors  Created by Hermínio Machado 2025 The DS 2MV Candles Colors indicator visually enhances your chart by coloring candles based on price position relative to two Smoothed Moving Averages (SMMA) . It’s designed to help traders quickly identify the current trend direction and potential neutral zones at a glance. How It Works The indicator plots two Smoothed Moving Averages (SMMA) — one based on the High and another on the Low price. Candle colors change according to wher
Sinir Ağı Göstergesi       Dahili Öğrenme ile. Bu, çok seviyeli özelleştirilebilir bir algılayıcı ve gelecekteki fiyat değişimlerini tahmin etmek için gelişmiş eğitim ayarlarıyla desteklenen gerçek otonom bir yapay zeka sistemidir   . Göstergeyi herhangi bir finansal sembol üzerinde kendiniz eğitebilirsiniz. Makine öğrenimi konusunda özel bir bilgiye ihtiyacınız yoktur. İhtiyacınız olan her şey bu araçta toplanır ve otomatik mod ve ön ayarlarla kolayca uygulanır. Büyük bir v2.0 - 2.5 güncellemes
Monster Breakout Index V2 is a clean, visual momentum indicator engineered to spot potential breakout opportunities by evaluating extreme price extensions against median historical range channels. Overview The indicator continuously monitors the median price across a configurable lookback window and compares it against current high and low extremes. When price expansion breaks out of the established median bounds, MBI V2 immediately plots distinct histogram bars in a separate window, allowing tr
- simple Price Action Indicator - a  3 Candle Pattern (1. Direction-Candle / 2. the TRAP / 3. Trigger-Candle)    BUT every Signal needs ATTENTION to check for a clean Range - NON Lagging ! the Alert shows instantly whats happening - recommended SETUP is: - there is a VOLUME-Filter (in points for the   1. candle ) to avoid alerts with tiny Candles during a NON-VOLUME-Time - 10% off the Boobietrap-Candle as the ALERT-Level --> can easily be adjusted - user defined - recommended Timeframe: M30 (we
ARIPoint is a powerful trading tool designed to generate high-probability entry signals with dynamic TP/SL/DP levels based on price volatility. The integrated performance tracking function displays win/loss statistics, number of PP1/PP2 hits, and success rate, all updated in real time. Key Features: Buy/sell signals with adaptive volatility range Real-time TP/SL/DP levels based on ATR Integrated MA filter with ATR/StdDev volatility option. Performance statistics table (Success, Profit/Loss,
Smart Volatility Squeeze MT5 Smart Volatility Squeeze MT5 is a volatility compression and momentum expansion indicator for MetaTrader 5. It builds on John Carter's Volatility Squeeze framework and extends the usual single-tier squeeze into three compression tiers, so you can see not only whether the market is compressed but how tightly it is compressed before it expands. The indicator opens in a separate window and draws two elements: a linear regression momentum histogram and a row of coloured
In the context of trading, Malaysia SNR (Support and Resistance) refers to the technical analysis of support and resistance levels in financial markets, particularly for stocks, indices, or other assets traded. This is single timeframe version. Multiple timeframe version is avaiable here . There are three type of Malaysia SNR level Classic , GAP and Flipped 1. Classic Support is the price level at which an asset tends to stop falling and may start to rebound. It acts as a "floor" where demand is
Fiyatın likidite arayabileceği bölgeleri anlayın Liquidity Reaction Map MT5, onaylanmış fiyat yapısını kullanarak potansiyel alış ve satış tarafı likidite bölgelerini belirleyen grafik tabanlı bir piyasa analiz göstergesidir. Gösterge; swing noktalarını, eşit zirve ve dipleri, önceki gün ve hafta seviyelerini, seans uç noktalarını ve psikolojik yuvarlak fiyatları düzenli bir likidite haritasında birleştirir. Birbirine yakın seviyeler tek bir bölgede birleştirilebilir ve güç, fiyata yakınlık ve k
Moonshine Pivot Trend is a trend indicator for MT4 and MT5 whose trailing stop sits still for days at a time. On gold H1 it produced 153 signals in four and a half years, about 33 a year. If that sounds low, that's the argument I want to make before you look at a screenshot and decide something is broken. Most ATR trend tools centre their band on the current candle, so every new bar moves the anchor and a quiet stretch nudges you out of a trend that never broke. This one anchors to confirmed swi
Supertrend Volume Confirm
Isaac Alexander Pinero Garcias
DESCRIPTION Supertrend Volume Confirm — Trend Signals Confirmed by Volume and RSI Supertrend Volume Confirm is a buy/sell signal indicator based on the classic Supertrend, with two additional confirmation filters: volume and RSI. Unlike more complex multi-timeframe systems, this indicator works on a single timeframe, designed for traders who want something direct and easy to read. It works on any market symbol (forex, gold, indices, stocks, crypto) thanks to its default use of tick volume, unive
Dorian
Ivan Simonika
The Dorian indicator is an intuitive tool for determining the current market trend. It is based on a simple visualization in the form of two-color lines, which makes it convenient for use by both beginners and experienced traders. This indicator not only helps determine the direction of the trend, but also serves as a valuable advisor for making decisions about entering the market or closing positions. Due to its simplicity and effectiveness, Dorian is recommended for traders of any experience
LZ Session Boxes PRO is a professional-grade tool for day traders, designed to beautifully visualize global trading sessions (Asia, Pacific/Sydney, London, New York) across your entire chart history. It eliminates the confusion of broker time offsets by automatically detecting timezones and adjusting for Daylight Saving Time (DST), ensuring your session boxes always align perfectly with real-market hours. Feature highlights - 4 Major Sessions: highlights Asian, Pacific (Sydney), London, and N
EAAV Visual Position Sizer
Eduardo Alberto Araque Vera
EAAV Visual Position Sizer is an advanced graphical utility for MetaTrader 5 designed to simplify visual trade management and accurately calculate position sizing before executing any order. The tool places interactive levels directly on your chart, allowing traders to quickly and intuitively adjust entry, protective stop, and target levels. Key Features: • Automatic Position Sizing: Automatically calculates the exact volume (lots) based on a fixed account risk percentage or fixed monetary am
LT Support Resistance - Destek ve Direnç Seviyelerini %100 Otomatik Olarak Belirleyin Destek ve direnç çizgilerini manuel olarak çizerek zaman kaybetmekten bıktınız mı? Ya da o önemli seviyeyi her seferinde gözden kaçırdığınız için hayal kırıklığı mı yaşıyorsunuz? LT Support Resistance, bu zahmetli işi ortadan kaldırmak için geliştirilmiştir; birden fazla zaman diliminde (timeframe) eş zamanlı olarak varlığınızın en ilgili bölgelerini otomatik olarak tanımlar ve işaretler. == KRİTİK SEVİYELERİN
Buy Sell Range
Israr Hussain Shah
The Range Filter Buy and Sell indicator is a trend-following technical analysis tool designed to identify optimal entry and exit points in the market. It filters out market noise by creating dynamic bands around price movements, generating clear buy and sell signals when price breaks through these bands. Key Features Dynamic Range Filtering : Uses a sophisticated algorithm to calculate adaptive bands that adjust to market volatility Trend Identification : Clearly visualizes the current trend dir
P A R Intelligence is a multi-strategy trading indicator designed for professional traders who demand precision, flexibility, and advanced market analysis. This powerful tool combines two proven trading methodologies into one seamless interface, providing institutional-grade support/resistance detection with intelligent breakout and pattern recognition systems. Why This Is Your Ultimate Trading Edge DUAL-STRATEGY ARCHITECTURE Choose between - or combine - two powerful trading approaches:
Bu çoklu zaman çerçevesi ve çoklu sembol göstergesi, Pin çubukları, Sabah/akşam yıldızları, Yutma, Cımbız, Üç Çizgi Darbesi, İç çubuklar ve Flamalar ve Üçgenler için tarama yapar.   Gösterge, tekli grafik modunda da kullanılabilir. Lütfen bu seçenek hakkında daha fazla bilgiyi ürünün       blog   .       Kendi kurallarınız ve tekniklerinizle birlikte bu gösterge, kendi güçlü sisteminizi oluşturmanıza (veya geliştirmenize) izin verecektir. Özellikleri Piyasa İzleme pencerenizde görünen tüm sembol
Sonic R Pro Enhanced EA - Sürüm 2025 249$ - Sadece ilk 5 alıcıya özel! Canlı Sinyal Sonic R Pro Enhanced'in canlı performansını kontrol et: Ticaret Stratejisi Sonic R Pro Enhanced, Dragon Band (EMA 34 ve EMA 89) ile otomatik ticaret yapan Sonic R stratejisinin geliştirilmiş bir versiyonudur. Gelişmiş algoritmalarla maksimum performans sağlar. Zaman Dilimleri: M15, M30 Desteklenen Pariteler: XAUUSD, BTCUSD, AUDJPY, USDJPY Ticaret Tarzı: Swing Trading - Geri Çekilme ve Karşı Trend Minimu
Alpha One MT5 - Gelişmiş Trend Algılama Sistemi Alpha One, otomatik Giriş, Zararı Durdur ve doğrudan grafiğinize çizilen üç Kar Al seviyesi ile net AL ve SAT sinyalleri veren profesyonel bir trend takip göstergesidir. Gösterge, gerçek zamanlı trend gücünü ve yönünü yansıtmak için yeşil ve kırmızı arasında değişen 15 dinamik çizgiden oluşan benzersiz bir Enerji Alanı görselleştirmesine sahiptir. Yeşil enerji yükseliş eğilimini, kırmızı enerji ise düşüş baskısını gösterir ve size piyasa momentum
【Super Scanner】Indicator Introduction : The color of the Super Scanner which is green and climbing up means that the price trend is going up.The color of the Super Scanner is red and going down means that the price trend is going down. It is very simple to use it to judge the market trend! What's even better is that the open parameters of the indicators allow investors to adjust. You can adjust【Super Scanner】according to your needs. Adjust it faster to be closer to short-term market fluctuatio
Paid release: Lorentzian ML Classifier Signals MT5 is a paid MetaCoderStore indicator. Use the product comments for setup questions, feature requests, and feedback for future updates. Lorentzian ML Classifier Signals MT5 is a closed-bar signal indicator inspired by the high-demand Lorentzian distance classification approach used by many TradingView traders. It compares the current market state against similar historical states using Lorentzian distance, then confirms the result with trend, kerne
The indicator is based on the two-buffer scheme and does not require any additional settings. It can be used on any financial instrument without any restrictions. The indicator is a known ZigZag, but it does not redraw . The indicator allows to easily detect significant levels on the price chart, as well as demonstrates the ability to determine the probable direction of a price movement. The calculations are based on the candles' Close prices, thus improving the reliability of the levels. Param
Bu ürünün alıcıları ayrıca şunları da satın alıyor
Trend Sniper X
Sarvarbek Abduvoxobov
4.9 (40)
Trend Sniper X , tüccarların trend yönünü ve olası dönüş noktalarını netlik ve hassasiyetle belirlemelerine yardımcı olan MetaTrader 5 için çoklu zaman dilimli bir trend takip göstergesidir. MT4 için: https://www.mql5.com/en/market/product/193245 Fiyat Bilgisi: Mevcut fiyat tanıtım amaçlıdır ve gelecek güncellemeler ile yeni özellikler yayınlandıkça değişebilir. Bonus Fırsatı: Bu indikatör için ÜCRETSİZ Oto-Trade Assistant EA'yı almak için lütfen satın aldıktan sonra yazara mesaj gönderin. Code
Smart Trend Trading System — MetaTrader 5 Satın aldıktan sonra Smart Universal Expert Advisor'ı ÜCRETSİZ edinmek ve beraberinde çevrimiçi kurs, PDF kılavuzu ve özel gruba erişim almak için MQL5 üzerinden bana mesaj gönderin. STTS; trend yönünü, giriş ve çıkış sinyallerini, dönüş bölgelerini ve önemli fiyat seviyelerini doğrudan grafiğinizde bir araya getirir. Sistemi manuel işlemler için kullanabilir veya ayrı bir uyumlu EA’yı bağlayarak seçtiğiniz ayarlarla otomatik işlem gerçekleştirebilirsini
SuperScalp Pro
Van Minh Nguyen
4.66 (35)
SuperScalp Pro - Professional Multi-Layer Confluence Scalping System SuperScalp Pro, klasik Supertrend'i birden fazla akıllı doğrulama filtresiyle geliştiren gelişmiş bir scalping göstergesidir. Daha yüksek olasılığa sahip Buy/Sell fırsatlarını belirlemenize yardımcı olurken yanlış sinyalleri önemli ölçüde azaltır. Net Buy ve Sell okları doğrudan grafik üzerinde görüntülenir ve ATR tabanlı Stop Loss ile Take Profit seviyeleri gerçek zamanlı olarak otomatik şekilde hesaplanır. Satın aldıktan sonr
SMC Intraday Formula
VividMind Digital Solutions
5 (26)
Önce dürüst olalım. Hiçbir gösterge tek başına sizi kârlı yapmaz. Eğer biri size aksini söylüyorsa, size bir hayal satıyordur. Mükemmel al/sat okları gösteren her gösterge, kusursuzmuş gibi görünecek şekilde yapılabilir — sadece geçmişin doğru bir bölümünü yakınlaştırıp kazanan işlemleri ekran görüntüsü almanız yeterlidir. Biz bunu yapmıyoruz.  SMC Intraday Formula bir araçtır. Piyasa yapısını sizin için okur, en yüksek olasılıklı fiyat bölgelerini belirler ve şu anda akıllı paranın izinin nası
Gann Made Easy , bay teorisini kullanarak ticaretin en iyi ilkelerine dayanan, profesyonel ve kullanımı kolay bir Forex ticaret sistemidir. WD Gann. Gösterge, Zararı Durdur ve Kâr Al Seviyeleri dahil olmak üzere doğru SATIN AL ve SAT sinyalleri sağlar. PUSH bildirimlerini kullanarak hareket halindeyken bile işlem yapabilirsiniz. Satın alma işleminden sonra, alım satım talimatlarını ve harika ek göstergeleri ücretsiz olarak almak için lütfen benimle iletişime geçin! Muhtemelen Gann ticaret yöntem
Şehre yeni bir Kral geldi - Gösterge + Emir Yönetimi göstergeleri (TP1 + TP2 + TP3) + Opsiyonel Telegram Sinyal Gönderici DAHİL (ÜCRETSİZ) (TAM TRADING ve SİNYAL SİSTEMİ) Altın için en iyi EA’mız: Gold Slayer Bu gösterge; gelişmiş bir strateji, özelleştirilebilir emir yönetimine sahip bir trading sistemi ve envelope uzantılarını birleştiren bir mean reversion sistemi içerir. Ayrıca RSI gibi birçok akıllı onay filtresiyle desteklenerek yüksek olasılıklı dönüş girişlerini AL ve SAT sinyalleriyle y
ARIPoint
Temirlan Kdyrkhan
1 (4)
ARIPoint is a powerful trading companion designed to generate high-probability entry signals with dynamic TP/SL/DP levels based on volatility. Built-in performance tracking shows win/loss stats, PP1/PP2 hits, and success rates all updated live. Key Features: Buy/Sell signals with adaptive volatility bands Real-time TP/SL/DP levels based on ATR Built-in MA Filter with optional ATR/StdDev volatility Performance stats panel (Success, Profit/Loss, PP1/PP2) Alerts via popup, sound, push, or email Cu
Auto Optimized SpeedAngle , sürekli İleriye Dönük Optimizasyon (Walk-Forward Optimization, WFO) yoluyla eğri uydurmayı (curve-fitting) ortadan kaldıran kurumsal düzeyde bir momentum vektörleme sistemidir. Piyasa rejimleri değiştiğinde etkinliğini yitiren statik girdilere güvenmek yerine, gösterge, örneklem dışı (Out-of-Sample, OOS) doğrulama kullanarak parametrelerini dinamik olarak yeniden kalibre eder ve böylece gösterilen sinyallerin geçmişteki rastgele anomalileri değil, gerçek bir istatisti
Neuro Poseidon MT5
Daria Rezueva
4.75 (52)
Neuro Poseidon is a new indicator by Daria Rezueva. It combines precise trading signals with adaptive TP/SL levels - creating best possible trades as a result! Message me and get  Neuro Poseidon Assistant  as a gift to automize your trading process! What makes it stand out? 1. Proven profitability on all assets and timeframes 2. Only confirmed BUY and SELL signals present on the chart 3. Adaptive TP & SL levels generated by the software for each trade 4. Easy to understand - suitable for al
Efsane geri dönüyor: Entry Points Pro 10. MQL5 Market'te 3 yıl boyunca ilk 3'te kalan efsanevi indikatörün yeniden lansmanı. Yüzlerce övgü dolu yorum (iki sürümde toplam 589), her gün binlerce trader onunla işlem yapıyor, 31.000+ demo indirmesi   MT4+MT5 . Beş yıl boyunca yazdığınız her yorumu okudum — ve söz vermek yerine yanıtları 10. sürümün içine işledim. 1999'dan beri piyasada olan ve dürüstlüğe, itibarına ve müşterilerine değer veren bir yazardan. Entry Points Pro, işleme giriş sinyallerin
FiboSniper Pro
Van Minh Nguyen
5 (3)
FiboSniper Pro – Multi-Filter Fibonacci System with Auto SL/TP and Control Panel FiboSniper Pro, seçilmiş Buy ve Sell sinyalleri üretmek için dinamik Fibonacci Envelopes ile birden fazla doğrulama filtresini birleştiren teknik bir göstergedir. Fibonacci seviyeleri Moving Average ve ATR temel alınarak hesaplanır ve ardından ADX, EMA, RSI, ATR, Volume, Time ve Candle yapısı ile filtrelenir. Gösterge, ATR tabanlı otomatik Stop Loss ve Take Profit seviyelerini doğrudan grafik üzerinde görüntüler ve
Welcome to ENTRY IN THE ZONE AND SMC MULTI TIMEFRAME SPECIAL BENEFIT / FOR OUR MQL5 CUSTOMERS FREE ACCESS TO THE NEW TOOL  — COMING SOON — Learn more on our official website  : https://www.fableedge.net Entry In The Zone and SMC Multi Timeframe is a real-time market analysis tool based on Smart Money Concepts (SMC), designed to analyze market structure, price direction, and key trading zones. It supports both Single-Timeframe Analysis and Multi-Timeframe Analysis, providing a clearer view of the
Unix Scalper
Issam Kassas
4 (4)
Unix Scalper — MetaTrader 5 Satın aldıktan sonra Smart Universal Expert Advisor'ı ÜCRETSİZ edinmek ve beraberinde çevrimiçi kurs, PDF kılavuzu ve özel gruba erişim almak için MQL5 üzerinden bana mesaj gönderin. İşlem fırsatını belirleyin. Planı görün. Nasıl işlem yapacağınıza karar verin. UNIX Scalper; piyasa analizini, BUY/SELL/WAIT kararlarını ve Entry, Stop Loss, TP1 ve TP2 seviyelerini düzenli bir panelde bir araya getirir. SİNYALİ VE PLANI GÖRÜN • Net kararlar: BUY, SELL veya WAIT. • Belir
M1 Sniper MT5
Oleg Rodin
5 (7)
M1 SNIPER   kullanımı kolay bir işlem göstergesi sistemidir. M1 zaman dilimi için tasarlanmış bir ok göstergesidir. Gösterge, M1 zaman diliminde scalping için bağımsız bir sistem olarak kullanılabilir ve mevcut işlem sisteminizin bir parçası olarak kullanılabilir. Bu işlem sistemi özellikle M1'de işlem yapmak için tasarlanmış olsa da, diğer zaman dilimleriyle de kullanılabilir. Başlangıçta bu yöntemi XAUUSD ve BTCUSD ticareti için tasarladım. Ancak bu yöntemi diğer piyasalarda işlem yaparken de
Tokyo mt5 Indicator
Vasiliy Strukov
5 (7)
Tokyo Indicator; trend yönü, potansiyel işlem sinyalleri ve piyasa koşulları hakkında net ve görsel bir genel bakış sunar. Renk kodlu ve kademeli trend çizgisi, yükseliş evrelerini (mavi) düşüş evrelerinden (macenta) ayırt eder. Trend değiştiğinde, buna karşılık gelen yön okları potansiyel alım ve satım fırsatlarını vurgular. Entegre bir panel; mevcut sinyali, piyasa eğilimini, momentumu, volatiliteyi ve sinyal kalitesini tek bir kullanışlı görünümde bir araya getirir. Bu sayede yatırımcılar, fa
FX Trend MT5 NG
Daniel Stein
5 (6)
FX Trend NG: Yeni Nesil Çoklu Piyasa Trend Zekâsı Genel Bakış FX Trend NG , çoklu zaman dilimlerinde çalışan profesyonel bir trend analiz ve piyasa izleme aracıdır. Piyasanın yapısını saniyeler içinde anlamanızı sağlar. Birden fazla grafik arasında geçiş yapmak yerine, hangi enstrümanların trendde olduğunu, momentumun nerede zayıfladığını ve hangi zaman dilimlerinin uyumlu olduğunu anında görebilirsiniz. Lansman Teklifi – FX Trend NG sadece $30 (6 Ay) veya $80 Ömür Boyu Lisans ile edinin. Zate
Adaptive Price Action Engine Göstergeyi al, EA'sı (Uzman Danışman) bedava gelsin Kendi Kendini Optimize Eden Multi-Timeframe Trend ve Mum Formasyonu Analizi Piyasalar sürekli değişir ve her Price Action formasyonu her piyasa koşulunda aynı değere sahip değildir. Adaptive Price Action Engine , değişen piyasa koşullarına uyum sağlamak amacıyla trend yapısını, Multi-Timeframe analizini, mum formasyonlarını ve istatistiksel optimizasyonu tek bir analiz sistemi içerisinde birleştirir. İki Adaptif Mod
Power Candles MT5
Daniel Stein
4.58 (12)
Power Candles V3 - Kendi Kendini Optimize Eden Güç Göstergesi Power Candles V3, döviz ve enstrüman gücünü, eklendiği her grafikte eyleme geçirilebilir bir ticaret planına dönüştürür. Sadece mumları renklendirmek yerine, arka planda canlı bir otomatik optimizasyon çalıştırır ve önünüzdeki sembol için en iyi Stop Loss, Take Profit ve sinyal eşiğini size sunar. Tek bir tıklama ile canlı ticarete uyarlanır - giriş, Stop Loss ve Take Profit ışınları grafikte tam fiyatlarla görünür ve uyarılar yön bil
Scalper Vault , başarılı bir scalping için ihtiyacınız olan her şeyi size sağlayan profesyonel bir scalping sistemidir. Bu gösterge, forex ve ikili opsiyon tüccarları tarafından kullanılabilecek eksiksiz bir ticaret sistemidir. Önerilen zaman çerçevesi M5'tir. Sistem size trend yönünde doğru ok sinyalleri sağlar. Ayrıca size üst ve alt sinyaller ve Gann piyasa seviyeleri sağlar. Göstergeler, PUSH bildirimleri dahil her türlü uyarıyı sağlar. Göstergeyi satın aldıktan sonra lütfen benimle iletişim
Atomic Analyst MT5
Issam Kassas
4.47 (60)
Atomic Analyst — MetaTrader 5 Satın aldıktan sonra Smart Universal Expert Advisor'ı ÜCRETSİZ edinmek ve beraberinde çevrimiçi kurs, PDF kılavuzu ve özel gruba erişim almak için MQL5 üzerinden bana mesaj gönderin. Atomic Analyst; fiyat hareketini, trend yönünü, giriş ve çıkış sinyallerini, Stop Loss ve birden fazla Take Profit seviyesini doğrudan grafiğinizde bir araya getirir. SİNYALİ GÖRÜN. İŞLEM KOŞULLARINI ANLAYIN. Atomic Analyst, analizini anlaşılır görsel bilgiler halinde sunar: • Olası gir
FX Power MT5 NG
Daniel Stein
5 (33)
FX Power: Daha Akıllı Ticaret Kararları için Para Birimlerinin Gücünü Analiz Edin Genel Bakış FX Power , her piyasa koşulunda başlıca para birimlerinin ve altının gerçek gücünü anlamak için vazgeçilmez bir araçtır. Güçlü para birimlerini alıp zayıf olanları satarak, FX Power ticaret kararlarınızı basitleştirir ve yüksek olasılıklı fırsatları ortaya çıkarır. İster trendlere sadık kalın ister Delta'nın aşırı değerlerini kullanarak tersine dönüşleri öngörün, bu araç ticaret tarzınıza mükemmel bir
Divergence Bomber
Ihor Otkydach
4.89 (94)
Bu göstergeyi satın alan herkese aşağıdaki ekstra içerikler ücretsiz olarak sunulmaktadır: Her işlemi otomatik olarak yöneten, Stop Loss ve Take Profit seviyelerini ayarlayan ve işlemleri strateji kurallarına göre kapatan özel yardımcı araç: "Bomber Utility" Göstergenin farklı varlıklar üzerinde kullanılmasına yönelik ayar dosyaları (set dosyaları) Bomber Utility için 3 farklı modda kullanım sunan ayar dosyaları: "Minimum Risk", "Dengeli Risk" ve "Bekle-Gör Stratejisi" Bu ticaret stratejisini
Crystal Heikin Ashi Signals
Muhammad Jawad Shabir
5 (4)
Crystal Heikin Ashi Signals—Professional Trend & Signal Detection Indicator Advanced Heikin Ashi Visualization with Intelligent Signal System for Manual & Automated Trading Final Price: $149 ---------> Price goes up $10 after every 10 sales . Limited slots available — act fast . Overview User Guide PDF Crystal Heikin Ashi Signals is a professional-grade MetaTrader 5 indicator that combines pure Heikin Ashi candle visualization with an advanced momentum-shift detection system. Designed for both m
DayTrader PRO
Davit Beridze
5 (4)
DayTrader PRO DayTrader PRO, John Ehlers'in Laguerre filtresini güçlü bir otomatik optimizasyon motoruyla birleştiren gelişmiş bir alım satım indikatörüdür. Sabit parametreler kullanmak yerine, indikatör yakın piyasa koşullarına göre en iyi ayarları otomatik olarak arar ve sürekli manuel ayarlamalar yapmadan değişen piyasa volatilitesine uyum sağlamanıza yardımcı olur. İndikatör, net ALIM (BUY) ve SATIM (SELL) sinyallerinin yanı sıra mevcut piyasa volatilitesinden hesaplanan adaptif Stop Loss ve
Quant Direction MT5
Georgios Kalomoiropoulos
Quant Direction, 3 boyutlu bir piyasa analiz aracıdır. Çeşitli parametrelerdeki yüzdesel sapmaları hassas bir şekilde hesaplayan, tamamen objektif, algoritma tabanlı piyasa analizi sunar. Gelişmiş yapay zeka tabanlı modelleme araçları kullanılarak geliştirilen ve titizlikle test edilen bu algoritma, piyasayı benzersiz bir hassasiyetle analiz eder. Platformda herhangi bir döviz çiftini veya finansal enstrümanı analiz edebilirsiniz. İster kısa vadeli, ister günlük, isterse swing trading yapın, Qua
Btmm state engine pro
Garry James Goodchild
5 (4)
BTMM State Engine Pro by G-Labs — Beat The Market Maker indicator for MetaTrader 5. Asian session range, London and New York kill zones, level progression (L1/L2/L3), peak formation detection (PFH/PFL), entry signals, and a multi-pair scanner from one chart. Stop scanning charts one pair at a time. The State Engine tracks the BTMM daily cycle automatically — Asian box, room boundaries, level blocks, peak formations, and filtered entries — while the scanner dashboard shows level, peak status, d
SkyHammer Signal Pro Entry, SL ve TP seviyeleri kilitlenen profesyonel no-repaint trend sinyal indikatörü SkyHammer Signal Pro, net, sabit ve doğrulanabilir sinyaller isteyen yatırımcılar için tasarlanmış yapılandırılmış bir trend ve momentum sinyal indikatörüdür. En iyi M1 ve M5 gibi düşük zaman dilimlerinde çalışır. İndikatör piyasanın tepe veya dip noktalarını tahmin etmeye çalışmaz. Bunun yerine sinyal üretmeden önce onaylanmış piyasa yapısı, trend yönü, momentum gücü, sağlıklı volatilite ve
ATstrong
Zaha Feiz
5 (1)
ATSTRONG PRO: Piyasa Yapısı ve Kırılım (Breakout) Göstergesi Kırılım Algılama Motoru | 5 Dinamik TP Hedefi | Canlı Gösterge Paneli | Yeniden Boyama Yok (Non-Repainting) Lansman Fiyatı Mevcut Fiyat: 59 $ — Her 10 satıştan sonra fiyat 10 $ artar. ATSTRONG PRO , MetaTrader 5 için tasarlanmış gelişmiş bir kırılım (breakout) ve kurumsal piyasa yapısı göstergesidir. Yüksek olasılıklı swing pivot noktalarını tespit eder, kümelenmiş destek ve direnç birikim bölgelerini belirler ve gerçek zamanlı olar
Precision Spike Detector
Francisco Mandomo Simbine
5 (2)
Precision Spike Detector V3 – Institutional-Grade AI Trading System Attention: The price increases by US$50 for every 10 purchases.  Final price: US$599 Precision Spike Detector V3   is a   state-of-the-art, institutional-grade market analysis system   for   MetaTrader 5 , designed to detect   high-probability market movements   in synthetic indices such as   Boom, Crash, GainX, and PainX . After purchase, send me a private message to receive the optimized configuration files,  the installation
UZFX {SSS} Scalping Smart Signals v5.0 MT5, hızlı hareket eden piyasalarda doğru ve gerçek zamanlı sinyaller bekleyen scalperlar, günlük işlemciler ve swing işlemciler için tasarlanmış, yeniden çizilmeyen yüksek performanslı bir işlem göstergesidir. (UZFX-LABS) tarafından geliştirilen bu gösterge, fiyat hareketi analizi, trend teyidi ve akıllı filtrelemeyi bir araya getirerek tüm döviz çiftleri ve zaman dilimlerinde yüksek olasılıklı alım ve satım sinyalleri, Uyarı Sinyalleri ve Trend Devam Fırs
Yazarın diğer ürünleri
Footprint Matrix Pro turns your MetaTrader 5 chart into an order-flow footprint chart . Every column shows who traded at each price: aggressive buyers lifting the ask against aggressive sellers hitting the bid. It is built from the real tick history of your broker, and every number is recorded tick by tick from the market data. You can see absorption, exhaustion, imbalances and real displacement as they happen, inside the candle and not only after it closes. Five footprint modes (one click) Bi
Signal Verdict Pro reads the indicators that are already on your chart, finds the signal that just fired and gives it a verdict : does this signal have substance, or is it noise? Every signal gets a score from 0 to 100 from 17 scenario checks, the indicator's own track record on this chart and a live repaint test. You keep your indicators and your strategy. Signal Verdict Pro adds the second opinion: STRONG , VALID , WEAK or REJECT , with the reasons for and against the trade. Works with the i
Currency Velocity Matrix shows the strength of the 8 major currencies ( EUR, GBP, AUD, NZD, USD, CAD, CHF, JPY ), calculated from all 28 pairs . It also shows the rate of change : which currency is gaining strength the fastest and which one is losing it the fastest. Knowing which currency is strong is not enough. A strong currency may already be losing momentum. The best opportunities usually appear when the currency gaining strength the fastest meets the currency losing strength the fastest . T
Market Maker Cycle Matrix shows the daily market maker cycle on your MetaTrader 5 chart. The Asian session builds a range. The London open often runs the stops on one side of it. Then the real move starts, room after room, until the market maker reaches the target and the cycle turns. The indicator tracks this cycle for you: the Asian range , the kill zones , the level count L1 / L2 / L3+ , the peak formation that turns the cycle, and five M15 entry types with entry, stop loss and two targets. A
Gold Killzone Sweep Matrix trades the most famous ICT idea for gold. Every kill zone (Asia, London, New York) leaves a high and a low . Stop orders sit beyond them, and that is liquidity . Smart money takes this liquidity (the sweep ) and then turns the market (the change of character, CHoCH ). Most kill zone indicators only draw the lines and leave the rest to you. This one does the whole job. It finds the sweep, confirms the CHoCH and prints a buy or sell arrow with entry, stop loss and target
Triple Edge Prop – three rule-based NASDAQ-100 intraday strategies in one Expert Advisor. Each engine has its own logic, its own magic number, its own timeframe and its own trading window. Together they cover three different market situations: a volatility breakout , an institutional VWAP pullback and an overnight bias breakout . Built for prop-firm challenges and funded accounts, with a full challenge guard on board. Why three strategies instead of one? A single strategy goes through losing
Momentum Decoupling Scalper turns a popular 1-minute scalping method for gold into clear, non-repainting signals. A signal on the 15-minute chart arms the setup, the first momentum candle on the 1-minute chart is the entry, and every trade comes with a stop loss, three targets (TP1 / TP2 / TP3) and an automatic break-even . The part most traders skip is the one that matters: the market must move on its own momentum against the US dollar . The indicator measures the dollar for you (the broker's d
Trend Exhaustion Radar answers one question that every trader asks in a strong move: is this trend running out of strength? Instead of watching three oscillators at the same time and missing the moment, the indicator reads DI+ / DI-, ADX and RSI for you, finds the classic warning signs - extreme zones, divergences, ADX hooks - and combines them into one traffic light with a rule score from 0 to 6. You get three windows in one product: the price chart with a 9/21 EMA cloud, warning markers and di
Filtrele:
Değerlendirme yok
Değerlendirmeye yanıt