Volatility Range Compass

  • Indicadores
  • Kay Zaremba
    Kay Zaremba
    Trader and MQL4 / MQL5 / Pine Script developer behind trader.lifestyle.
    YouTube: youtube.com/@traderlifestyle
    What I do:
    • Build free indicators and Expert Advisors for MT4, MT5
    • Turn strategies from YouTube videos, TradingView scripts and forum posts into working code
  • Versão: 1.0
  • Ativações: 5

Volatility Range Compass is a volatility dashboard for MetaTrader 5. It answers the questions every trader has before entering a trade:

  • How far does this market normally move in a day, a week, a month? (ADR, AWR, AMR)
  • How much of today's normal move is already done, and is there still room? (% of ADR used, ADR targets)
  • How volatile is each timeframe right now compared with its own history? (ATR matrix M1 to W1 with regime)
  • Which hours of the day move the most? (volatility clock)
  • How big should my stop be, and which lot size keeps my risk at exactly 1 %? (ATR risk planner)
  • Which of my symbols still has the most room today? (ADR scanner)

Everything is calculated from the price history of your broker. There are no external servers, DLLs or internet connections. The indicator never opens or closes trades.

■ The terms in 30 seconds

  • ATR (Average True Range) = the average size of the last N candles (default 14), including gaps. An H1 ATR of 12 pips means an H1 candle is usually about 12 pips tall.
  • ADR (Average Daily Range) = the average distance between the daily high and the daily low over the last N completed days (default 14). Weekend candles are skipped by default.
  • AWR / AMR = the same for weeks (default 10) and months (default 6).
  • ADR high target = today's low + ADR. If price keeps rising, a normal day usually ends around this level.
  • ADR low target = today's high - ADR. If price keeps falling, a normal day usually ends around this level.
  • % of ADR used = today's range (high - low) divided by the ADR. 100 % = today has already moved as much as an average day.

■ Installation and first start

  1. After the purchase, the indicator appears in the MetaTrader 5 Navigator under Indicators > Market.
  2. Drag Volatility Range Compass onto any chart (forex, gold, silver, indices, crypto, any timeframe).
  3. Click OK. The default settings work for every symbol, so you do not need to change anything.
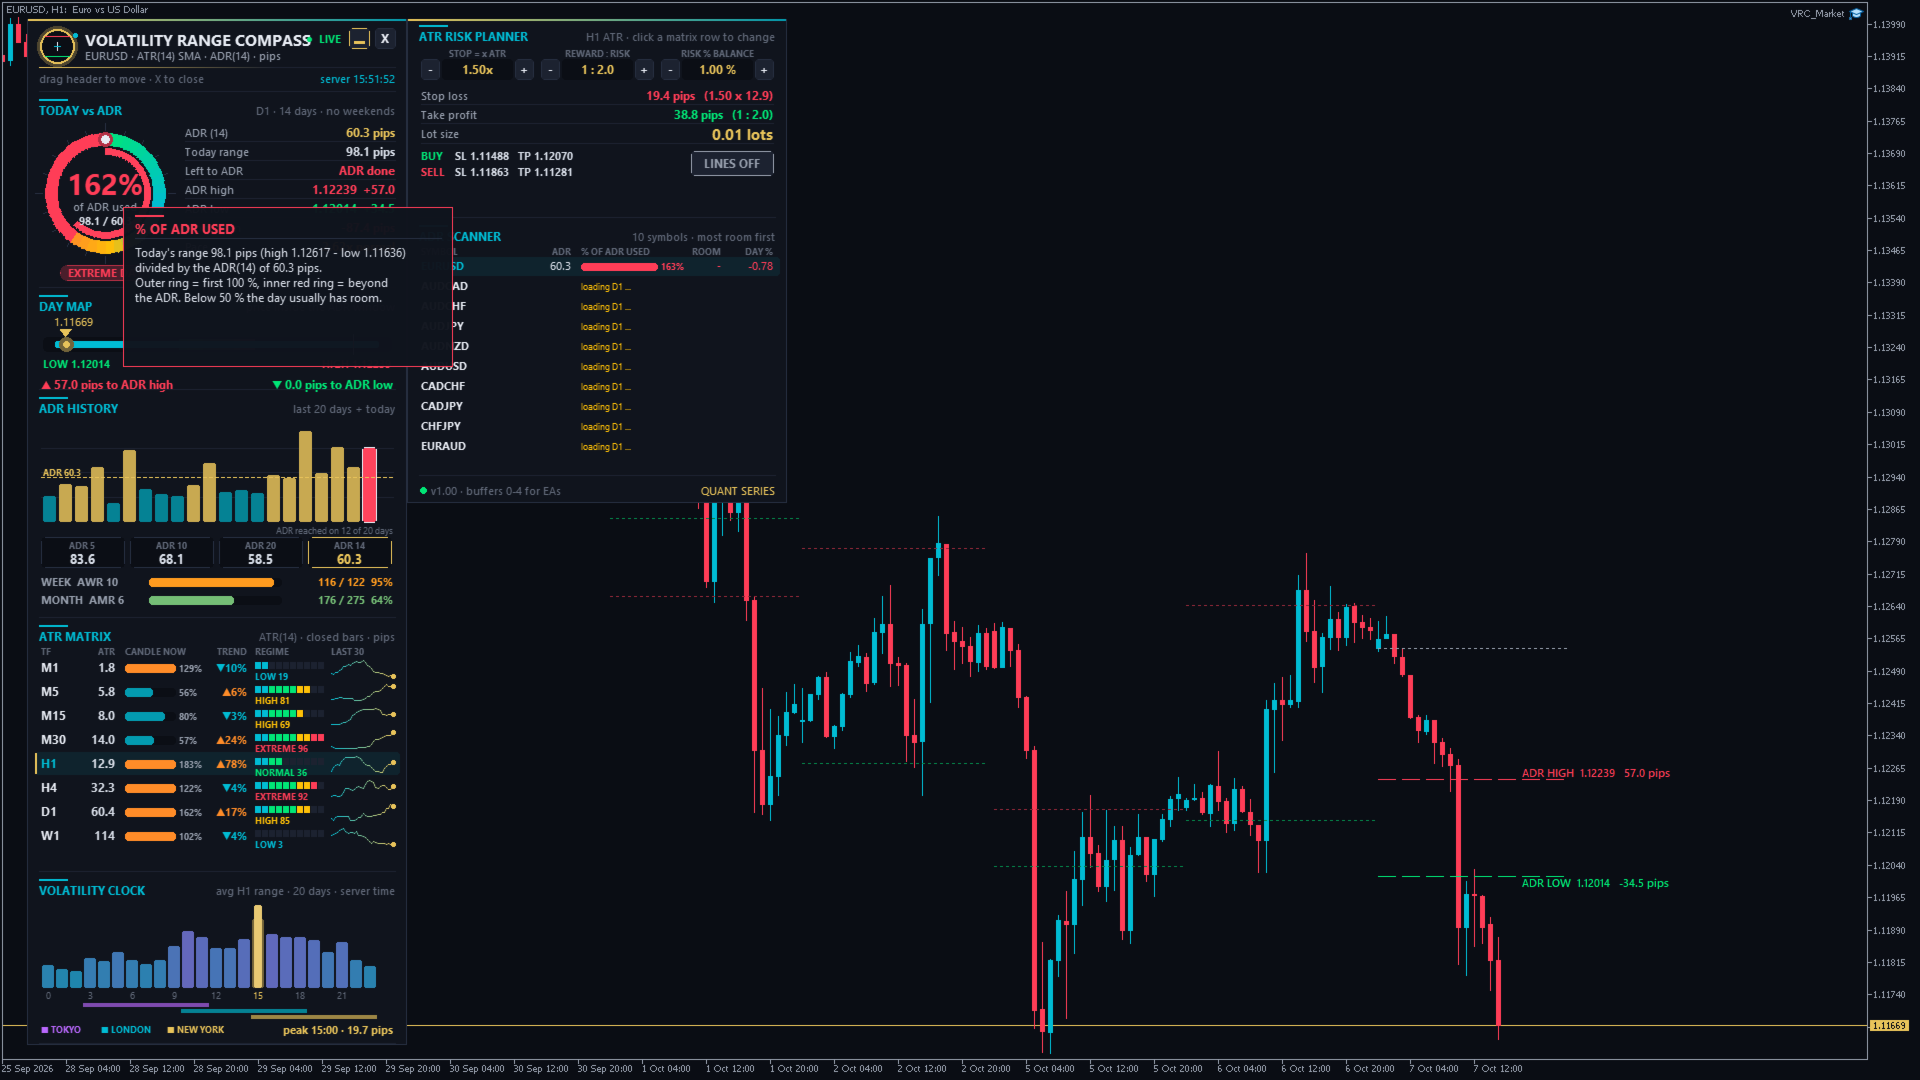
  4. On the first start the indicator loads the history of all timeframes (M1 to W1). Depending on your broker this takes a few seconds. Sections that are still loading show LOADING.
  5. Drag the dashboard by its header to any place on the chart. Position and settings are remembered for each chart.

■ The dashboard, section by section

1. Header
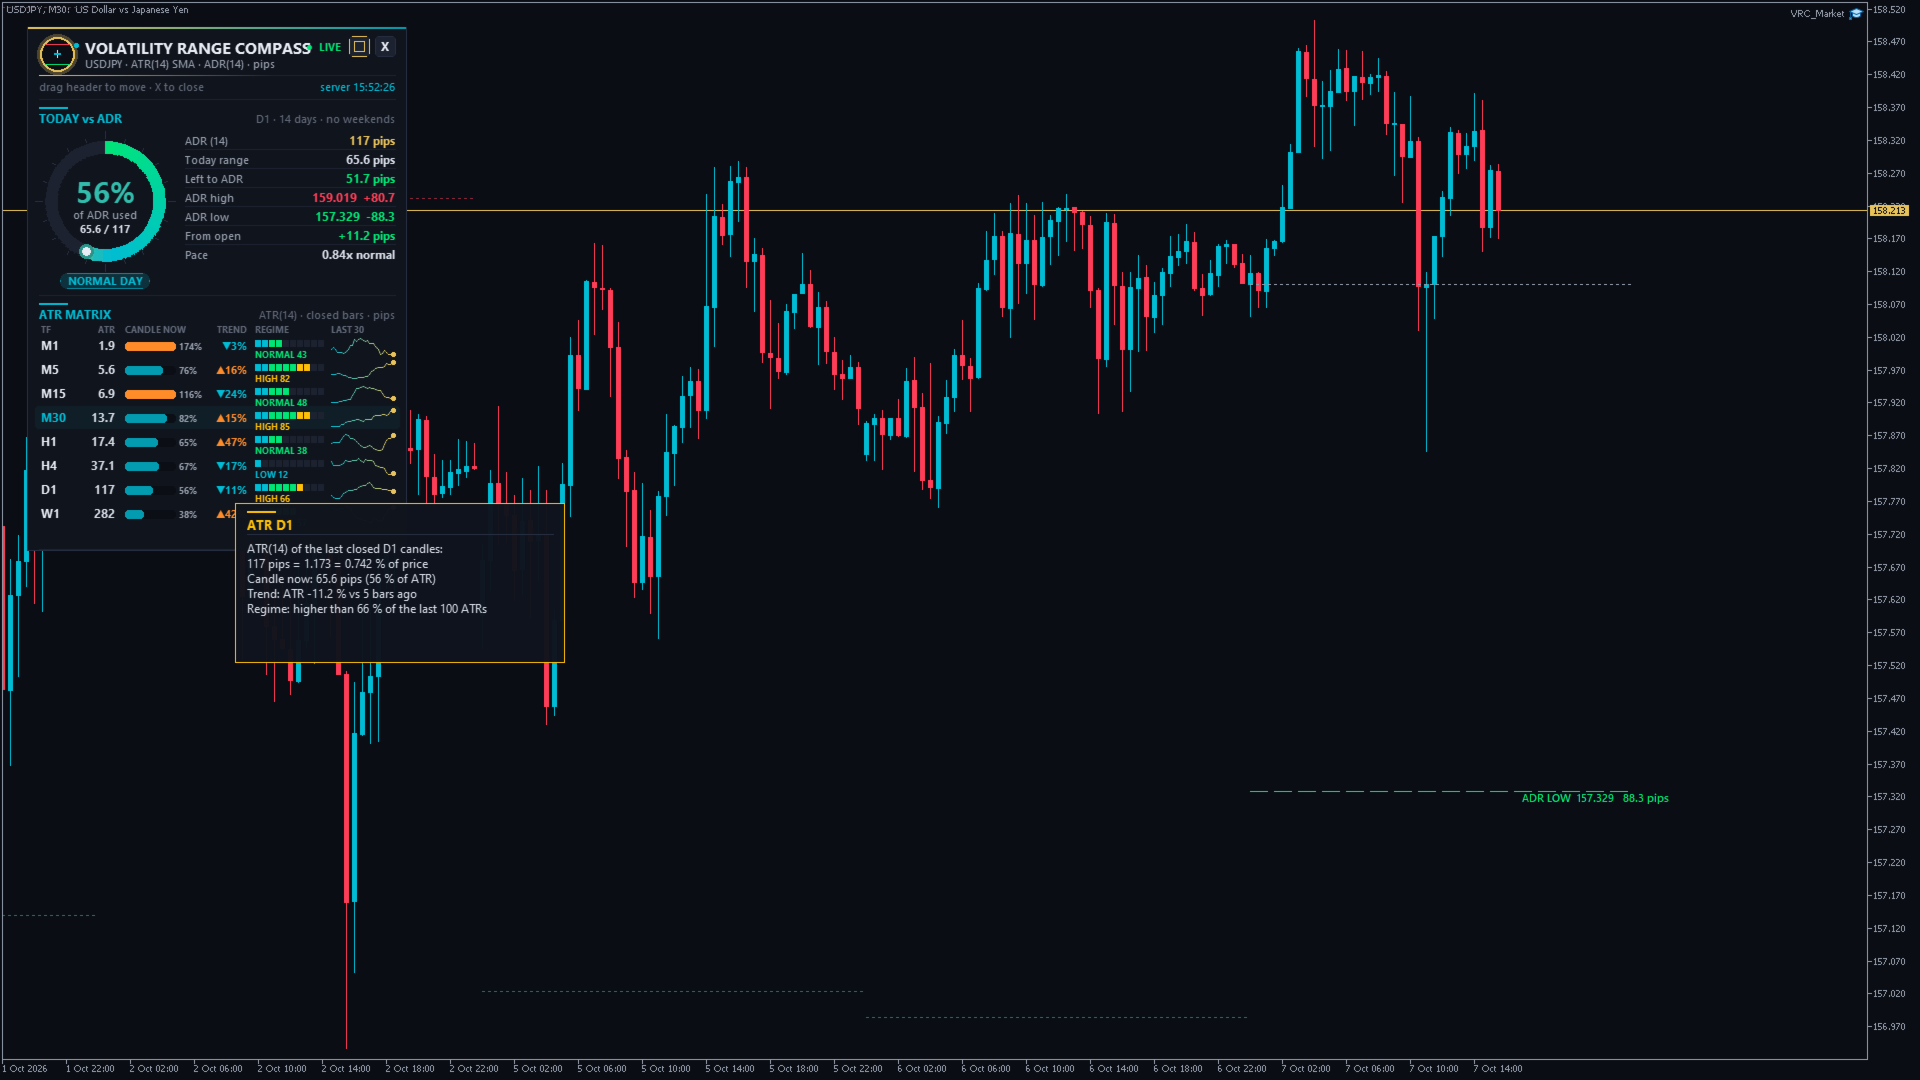
Symbol, ATR period and method, ADR period and the unit used (pips or points). The dot shows LIVE or LOADING and the server time is shown on the right. Buttons: ▭ switches between the full dashboard and the compact panel, and X folds the dashboard into a small pill. Click the pill to open the dashboard again.

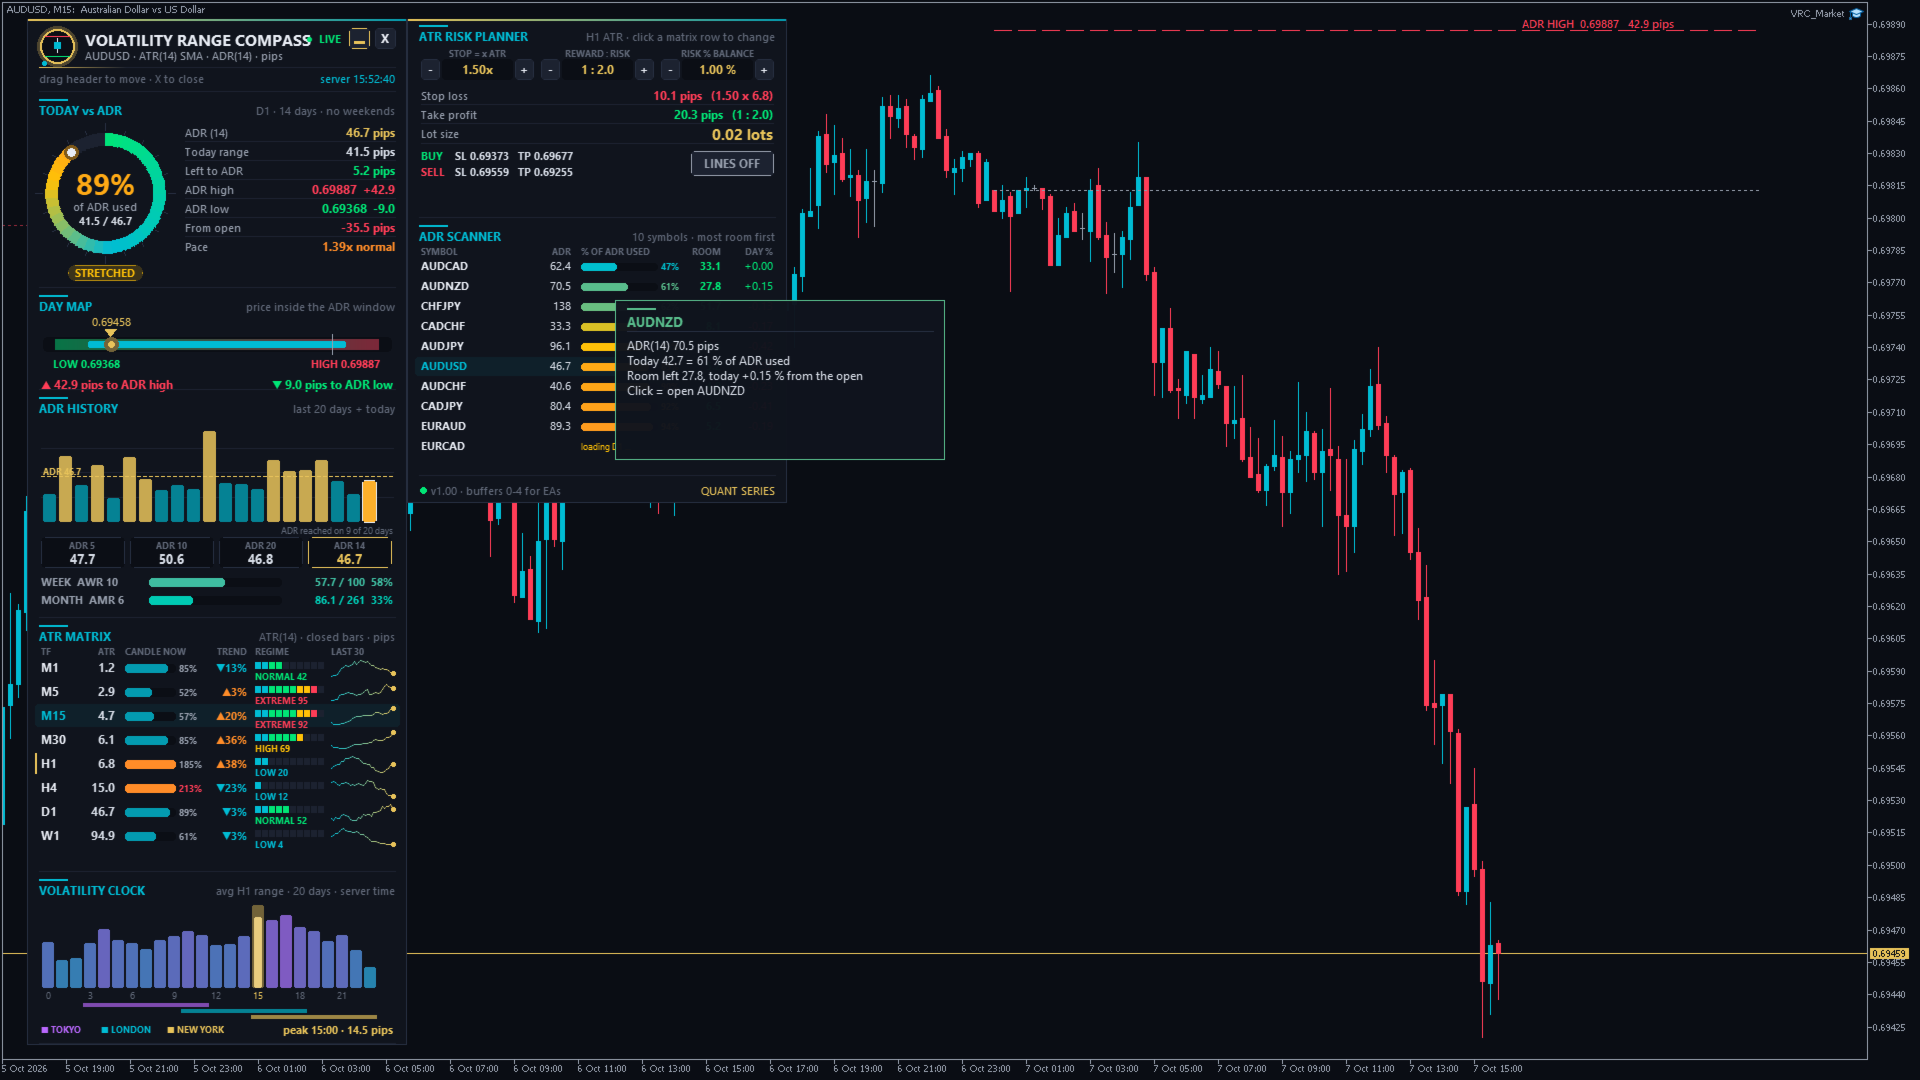
2. Today vs ADR
The ring shows how much of today's ADR is already used. The outer ring fills up to 100 %, and a red inner ring shows the part beyond 100 %. Below the ring, the day status:

  • ROOM TO RUN (below 50 %): the day has most of its normal move still ahead.
  • NORMAL DAY (50-80 %)
  • STRETCHED (80-100 %): most of the normal move is done.
  • ADR HIT (100-130 %): an average day would be over.
  • EXTREME DAY (above 130 %): unusually large day, often news or trend days.

On the right: ADR, today's range, range left to the ADR, ADR high and low target with the distance from the current price, distance from the day's open and the pace. The pace compares today's movement with what is normal at this time of the day (from the volatility clock). 1.0x = normal, 1.5x = the day is moving 50 % faster than usual, 0.5x = a slow day. Early in the day (before about 6 % of the normal daily movement) it shows early in day.

3. Day map
A horizontal map of today. The coloured track is the ADR window from the ADR low target (green) to the ADR high target (red). The cyan bar is today's range, the grey tick is the day's open and the gold marker is the current price. Below it you see how many pips are left to each target. The window shrinks as the day range grows, and when the cyan bar fills it, the ADR is done.

4. ADR history
The last 20 days and today as bars. Gold bars reached the ADR that was valid on that day, and cyan bars did not. The dashed line is the current ADR, and the counter shows on how many of the 20 days the ADR was reached. Below: ADR 5 / 10 / 20 / 14 (a short ADR above the long ADR = volatility is rising) and the weekly (AWR) and monthly (AMR) range with the share already used this week and this month.

5. ATR matrix (M1 to W1)
One row per timeframe, always using closed candles:

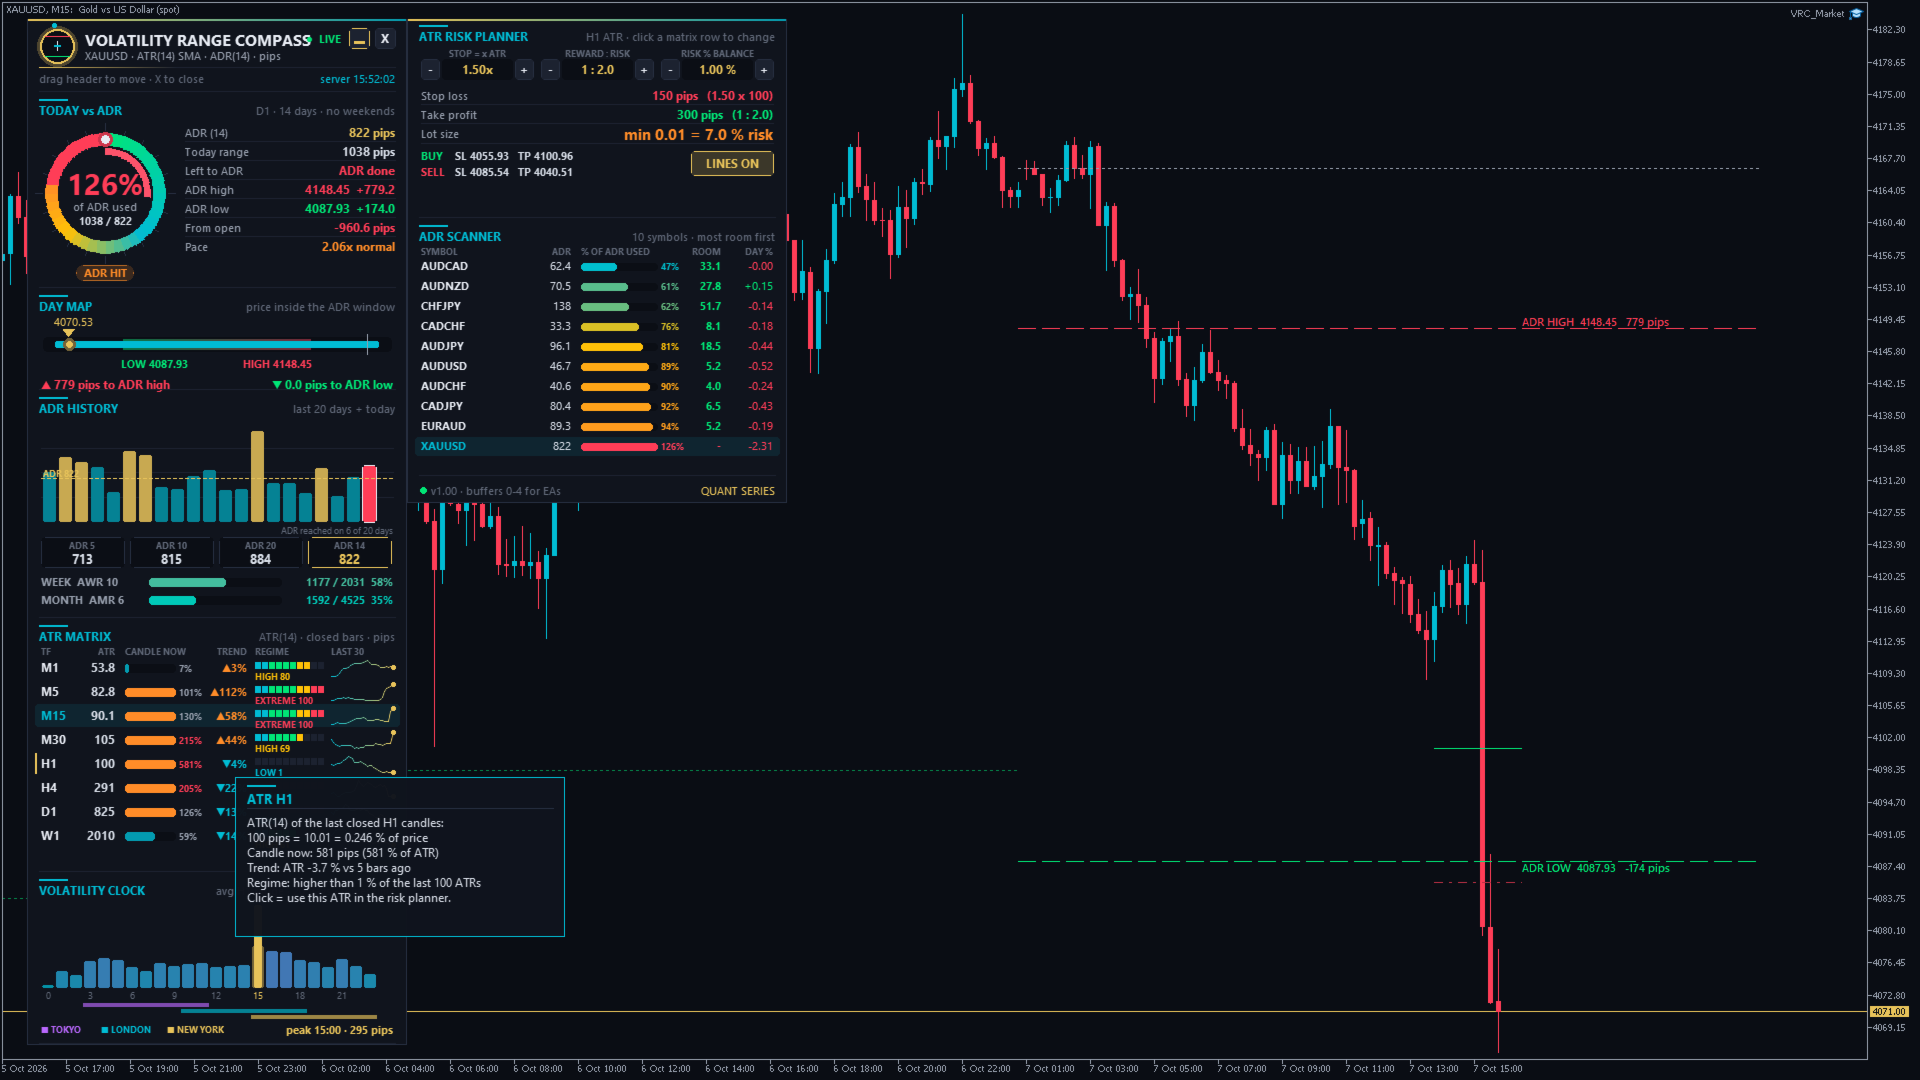
  • ATR in pips (forex), in 0.10 steps (gold, shown as pips) or in points (indices, crypto).
  • Candle now: the current candle's range in % of its ATR. Above 100 % = the candle is already bigger than normal (orange).
  • Trend: ATR now compared with 5 candles ago. ▲ = volatility is rising, ▼ = it is falling.
  • Regime: rank of the current ATR among the last 100 ATR values. LOW (below 20), NORMAL (20-60), HIGH (60-85), EXTREME (above 85).
  • Last 30: sparkline of the last 30 ATR values.

The row of the chart timeframe is highlighted. Click a row to use the ATR of that timeframe in the risk planner (gold marker).

6. Volatility clock
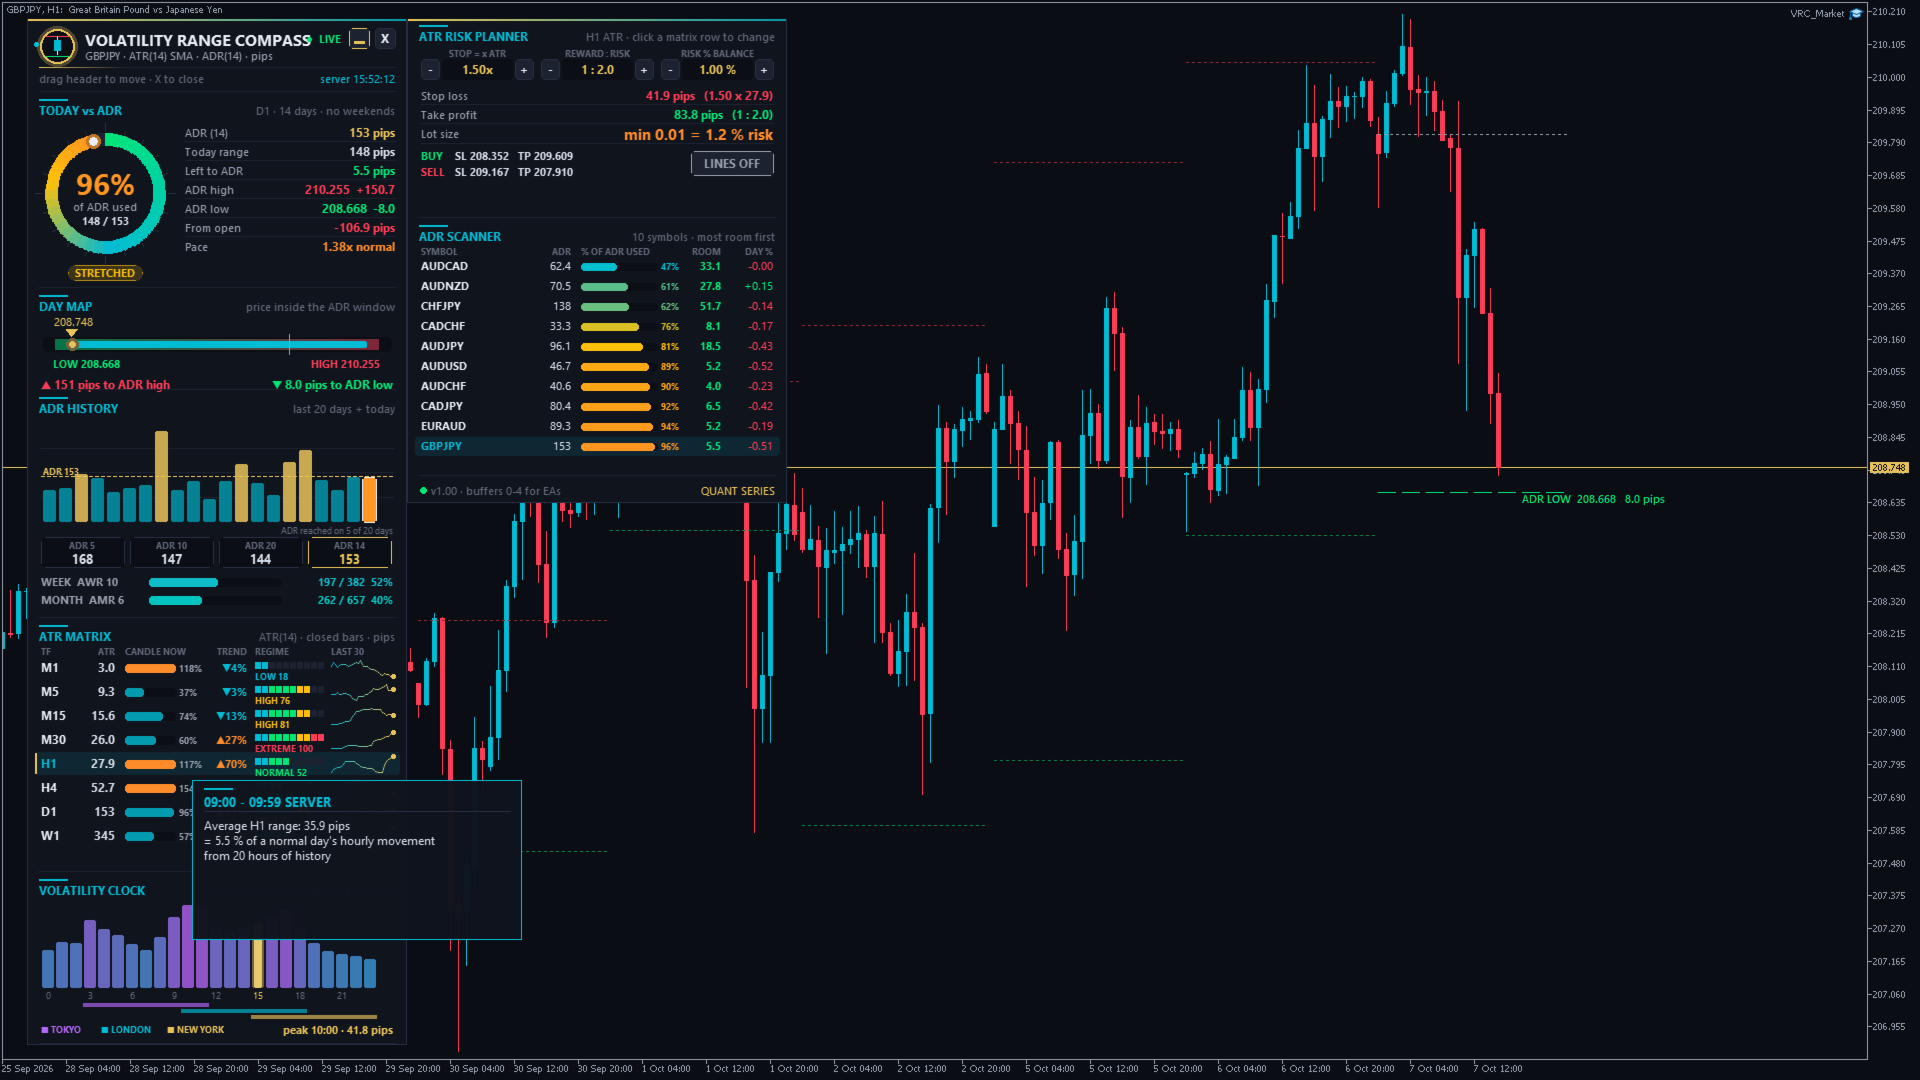
Average H1 range of each hour of the day over the last 20 days, in server time. The gold bar is the current hour and its inner bar shows how much this hour has moved so far. Below the bars are the Tokyo, London and New York sessions shifted to your server time, and the peak hour with its average range.

7. ATR risk planner
Calculates the stop, the target and the lot size from the ATR:

  • STOP = x ATR (0.5 to 3.0), REWARD : RISK (0.5 to 5.0) and RISK % BALANCE (0.25 to 5 %). Change them with the - / + buttons.
  • Stop loss and take profit in pips, plus the exact price levels for a BUY from the ask and a SELL from the bid.
  • Lot size calculated from the tick value of your broker and your balance. It is always rounded down to the lot step, so the real risk is never higher than the chosen %. If even the minimum lot is too large for the chosen risk, the planner shows the real risk of the minimum lot, for example min 0.01 = 7.0 % risk.
  • LINES ON / OFF draws the BUY and SELL stop loss and take profit lines next to the price.

The planner only calculates and never places orders.

8. ADR scanner
Up to 14 symbols (your Market Watch or your own list), sorted with the most room first. Columns: ADR, % of ADR used, room left to the ADR and today's % change. The chart symbol is always included. Click a symbol to open it in this chart or in a new chart (input).

9. ADR targets on the chart
Dashed lines for today's ADR high target (red) and ADR low target (green) with price and distance, a dotted line for the day's open, and dotted lines for the final ADR targets of the last 5 days. The targets move live during the day. Hover any line to see its details.

Tooltips: hover any value, bar or row in the dashboard to see what it means and how it is calculated.

■ How to use it - step by step

Before you enter a trade:

  1. Look at % of ADR used. Below 50 % (ROOM TO RUN), the day usually still has movement left. Above 100 % (ADR HIT), most of the day's normal move is done, so new breakout trades have less room and reversals become more likely.
  2. Check the distance to the ADR target in your trade direction. If you want 40 pips but only 15 pips are left to the ADR high target, the trade needs an above-average day.
  3. Check the pace. A pace above 1.3x early in the session often points to a trend or news day. A pace below 0.7x points to a quiet range day.
  4. Check the regime of your trading timeframe in the ATR matrix. HIGH or EXTREME = wider stops are needed. LOW = expect smaller moves or a coming expansion.
  5. Check the volatility clock. Entries right before the peak hours have the most movement ahead of them.

Plan the trade:

  1. Click the row of your trading timeframe in the ATR matrix.
  2. Set the stop to 1.5x ATR (a common starting value), your reward : risk and your risk %.
  3. Read the lot size and the SL / TP price levels from the planner, or switch LINES ON to see them on the chart.
  4. Enter the trade with your usual order panel. The indicator does not trade.

Example (EURUSD): ADR = 60 pips, today's range = 25 pips (42 % used, ROOM TO RUN), pace = 1.1x, price is 20 pips below the ADR high target. H1 ATR = 13 pips, regime NORMAL. Stop 1.5 x 13 = 19.5 pips, target 1 : 2 = 39 pips. The target lies beyond the ADR high target, so a smaller target (about 20 pips) or a better entry fits a normal day better. With a 10,000 USD balance and 1 % risk the planner shows the lot size for 100 USD at a 19.5 pip stop.

Other typical uses:

  • Take profit at the ADR target: many day traders close at or before the ADR high / low target.
  • Avoid late entries: skip breakout trades on ADR HIT or EXTREME DAY.
  • Fade extremes: when price reaches the ADR target with a falling pace, look for reversal signals from your own strategy.
  • Choose the symbol: the scanner shows which pairs still have room today.
  • Adjust stops to volatility: use ATR-based stops instead of fixed pips, so your stop is wide enough in volatile phases and tight in quiet ones.

■ Alerts

  • ADR levels: an alert when today's range reaches 80 % and 100 % of the ADR (input ADR used levels, comma separated, for example 50,80,100,130). Each level fires once per day. Levels that were already passed when you load the indicator do not fire.
  • Volatility spike: an alert when the current chart candle is at least 2 x ATR big (input spike = candle range >= N x ATR).
  • Delivery as popup, sound, push notification to the MetaTrader app on your phone and / or e-mail. Push and e-mail must be set up in MetaTrader under Tools > Options > Notifications / Email.

■ Inputs - every setting explained

ATR
period (14) number of candles in the ATR
smoothing method (SMA) SMA = MetaTrader's standard ATR (identical values). Wilder / RMA = TradingView standard. EMA = reacts faster.
matrix timeframes (M1,M5,M15,M30,H1,H4,D1,W1) comma separated list, maximum 9. Allowed: M1, M5, M15, M30, H1, H4, D1, W1, MN
regime = rank inside the last N values (100) how many past ATR values are used for LOW / NORMAL / HIGH / EXTREME
ADR
days in the ADR (14) completed days in the average daily range
skip Saturday / Sunday candles (true) ignores the small weekend candles some brokers have, so they do not lower the ADR
weeks in the AWR (10), months in the AMR (6) periods of the weekly and monthly average range
Alerts
ADR used levels in % (80,100) leave empty to switch the ADR alerts off
volatility spike (true), multiplier (2.0) alert when the chart candle reaches N x ATR
popup / sound / push / e-mail how alerts are delivered
Chart
draw ADR high / low targets (true) lines and labels on the chart
ADR targets of the last N days (5) history of the final targets (0 = off)
draw the day open (true) dotted line at today's open
colours ADR high target, ADR low target, day open
Planner (start values, change them later with - / + in the dashboard)
stop loss = N x ATR (1.5), take profit = R x stop (2.0), risk in % of balance (1.0) start values of the planner
Scanner
symbols (empty) your own list, for example EURUSD,GBPUSD,XAUUSD,US30. Empty = the first symbols of the Market Watch. Use the exact symbol names of your broker (with suffix, for example EURUSD.r).
max. symbols (10) 1 to 14
click on a symbol switch this chart / open a new chart / do nothing
Display
volatility clock days (20) days of H1 history for the clock and the pace
pip size (Auto) Auto = forex pips, gold 0.10, silver 0.01, indices / crypto points. Broker points, or a custom pip size in price units.
full dashboard or compact panel start mode (you can switch any time with the button)
move away from other panels (true) if other panels are on the chart, the dashboard moves to a free place, switches to the compact panel or folds to the pill
start X / Y (20 / 30) first position in pixels. After that you can drag the dashboard anywhere.
show tooltips (true) explanations on mouse hover
EA buffers: bars calculated (1500) how many bars the 5 buffers are filled for

■ For Expert Advisors (iCustom)

Buffers: 0 = ADR (price units), 1 = ADR high target, 2 = ADR low target, 3 = ADR used in %, 4 = ATR of the chart timeframe. Buffers 0-3 are empty on D1 and higher timeframes and on days whose first bar is outside the calculated window. The ADR of each day only uses the days before it, so values of closed bars do not repaint.

■ FAQ

Why are the values different from another ADR indicator? Check three things: the number of days, whether weekend candles are skipped, and whether today is included. This indicator uses completed days only and skips weekend candles by default.

Gold shows "pips" - what is a pip on gold? In Auto mode, 1 pip on gold = 0.10 USD of price movement (for example 2350.00 to 2350.10). Choose broker points or a custom pip size if you prefer another unit.

Which timezone is used for days and hours? The server time of your broker, the same as the D1 and H1 candles of your chart.

The dashboard covers my candles. Drag it to another place, click ▭ for the compact panel, or click X to fold it to a small pill.

A section shows LOADING. MetaTrader is still downloading the history of that timeframe. It disappears after a few seconds. If it stays, open a chart of that timeframe once.

Can I use it on several charts? Yes. Every chart keeps its own position and settings.

■ Notes

  • MetaTrader 5 indicator for the main chart window. It works with every broker and symbol: forex, gold, silver, indices, crypto, energies.
  • In the Strategy Tester (visual mode) the full dashboard runs on the tester history. Clicking a scanner symbol does not switch charts there.
  • The indicator does not trade. It is an analysis and planning tool and does not guarantee profits.
Produtos recomendados
Phoenix Orb Asia
Nigel Nii Darku Narnor Darko
This is a professional-grade institutional toolkit designed for breakout traders and trend followers worldwide. It specializes in the  Opening Range Breakout (ORB)  strategy—one of the most consistent ways to capture intraday volatility during the London and New York opens. This indicator does the heavy lifting for you by automatically mapping out the high and low of the first 15 minutes of any session. It combines this with  Smart Money Concepts (SMC) , identifying structural shifts like  BOS
Este indicador de painel de divergência de vários períodos de tempo e vários símbolos envia um alerta quando uma ou duas divergências diferentes foram identificadas em vários intervalos de tempo e não em divergências únicas. Ele pode ser usado com todos os intervalos de tempo de M1 a MN. No máximo 9 períodos de tempo podem ser mostrados no painel ao mesmo tempo. É possível habilitar o filtro de tendência de média móvel, RSI ou bandas de Bollinger para filtrar apenas as configurações mais fortes.
Wilizard SMC Suite is a complete Smart Money Concepts / ICT toolkit in a single, fast, non-repainting indicator. Instead of loading six separate tools onto one chart, you get every institutional-style concept — market structure, order blocks, fair value gaps, liquidity, premium/discount, killzones, a multi-timeframe dashboard and confluence signals — working together, all confirmed on closed bars. Everything you see is calculated on CLOSED candles only. Nothing shifts, redraws, or disappears a
Arnold Tradenegger
Saiful Izham Bin Hassan
Arnold Tradenegger Elite é um consultor especialista de nível profissional construído sobre um algoritmo resiliente projetado para as condições modernas do mercado. Ele combina filtragem dinâmica de mercado com gerenciamento de risco de nível institucional. O sistema usa uma matriz de confirmação multi-indicadores apresentando MACD, Médias Móveis, RSI, Estocástico e MFI para cronometrar as entradas com precisão. Ele é construído para se adaptar, em vez de forçar negociações, utilizando um trail
Emotions are a weakness. QHO mathematics is the future of your trading! You know what really truly frustrating?  Information garbage and noise. All those legacy, lagging indicators on the charts look like an attempt to steer a rocket ship with a steam engine. They are useless. They look at the past while the market is already flying forward on next-gen tech. We created QHO. This is not just another indicator. This is pure mathematics crushing market chaos right on your chart. Imagine completely
Breakout Entry Signals MT5
Christopher Graham Parish
!! FLASH SALE !!   Over 80% off !!     For ONE week only. Now only $47 - normally $297! >>>      Ends on 30 June 2023 - Don't miss it! Buy and Sell Alerts when price breaks out following strict price action. Sends Alerts – #On MT5 To Your Phone To Your Email Does not repaint . Works on any Forex pair, any timeframe. 10 Activations allowed so you are free from limitations >> MT4 Version Here For spreads from a tiny 0.1pip RAW/ECN Accounts,  click here . Check out my Waka Esque EA signal here
Ultimate Double Top & Bottom (Pro Volume Matrix) Stop trading retail breakouts. Start trading Institutional Traps. The   Ultimate Double Top & Bottom   is not a standard, lagging pattern scanner. It is a highly advanced, non-repainting structural engine equipped with a proprietary   3-Leg Volume Matrix . Designed exclusively for Smart Money Concepts (SMC) and order flow traders, this indicator mathematically dissects the tick volume inside M and W patterns to reveal true institutional intent:  
ToolBox 360 is the swiss knife of all indicators. It is full packed with useful tools to help you with your trading. It can be used to find best entry and exit points and help you to decide if you should open a trade or not. It shows market trends, candlestick formations outside / inside bars and you can sett time based allerts. Main features: Time based Fibonacci lines Choose a start and end time and the indicator shows you Fibonacci lines within the selected time range including range high a
DS 2MV Candles Colors
Herminio Jesus Da Costa Machado
DS 2MV Candles Colors  Created by Hermínio Machado 2025 The DS 2MV Candles Colors indicator visually enhances your chart by coloring candles based on price position relative to two Smoothed Moving Averages (SMMA) . It’s designed to help traders quickly identify the current trend direction and potential neutral zones at a glance. How It Works The indicator plots two Smoothed Moving Averages (SMMA) — one based on the High and another on the Low price. Candle colors change according to wher
Indicador de Rede Neural       com Aprendizado Integrado. Este é um sistema de inteligência artificial autônomo real,   alimentado por um perceptron personalizável de vários níveis e configurações avançadas de treinamento para prever futuras variações de preços. Você pode treinar o indicador em qualquer símbolo financeiro, sem precisar de nenhum conhecimento especial em aprendizado de máquina. Tudo o que você precisa está reunido nesta ferramenta e implementado convenientemente com modo automáti
Monster Breakout Index V2 is a clean, visual momentum indicator engineered to spot potential breakout opportunities by evaluating extreme price extensions against median historical range channels. Overview The indicator continuously monitors the median price across a configurable lookback window and compares it against current high and low extremes. When price expansion breaks out of the established median bounds, MBI V2 immediately plots distinct histogram bars in a separate window, allowing tr
- simple Price Action Indicator - a  3 Candle Pattern (1. Direction-Candle / 2. the TRAP / 3. Trigger-Candle)    BUT every Signal needs ATTENTION to check for a clean Range - NON Lagging ! the Alert shows instantly whats happening - recommended SETUP is: - there is a VOLUME-Filter (in points for the   1. candle ) to avoid alerts with tiny Candles during a NON-VOLUME-Time - 10% off the Boobietrap-Candle as the ALERT-Level --> can easily be adjusted - user defined - recommended Timeframe: M30 (we
ARIPoint is a powerful trading tool designed to generate high-probability entry signals with dynamic TP/SL/DP levels based on price volatility. The integrated performance tracking function displays win/loss statistics, number of PP1/PP2 hits, and success rate, all updated in real time. Key Features: Buy/sell signals with adaptive volatility range Real-time TP/SL/DP levels based on ATR Integrated MA filter with ATR/StdDev volatility option. Performance statistics table (Success, Profit/Loss,
Smart Volatility Squeeze MT5 Smart Volatility Squeeze MT5 is a volatility compression and momentum expansion indicator for MetaTrader 5. It builds on John Carter's Volatility Squeeze framework and extends the usual single-tier squeeze into three compression tiers, so you can see not only whether the market is compressed but how tightly it is compressed before it expands. The indicator opens in a separate window and draws two elements: a linear regression momentum histogram and a row of coloured
In the context of trading, Malaysia SNR (Support and Resistance) refers to the technical analysis of support and resistance levels in financial markets, particularly for stocks, indices, or other assets traded. This is single timeframe version. Multiple timeframe version is avaiable here . There are three type of Malaysia SNR level Classic , GAP and Flipped 1. Classic Support is the price level at which an asset tends to stop falling and may start to rebound. It acts as a "floor" where demand is
Entenda onde o preço pode procurar liquidez Liquidity Reaction Map MT5 é um indicador de análise de mercado aplicado diretamente ao gráfico. Ele identifica possíveis áreas de liquidez do lado comprador e vendedor com base em estruturas de preço confirmadas. O indicador reúne pontos de swing, máximas e mínimas iguais, níveis do dia e da semana anteriores, extremos de sessões e preços psicológicos em um mapa de liquidez organizado. Níveis próximos podem ser combinados e classificados de acordo com
Moonshine Pivot Trend is a trend indicator for MT4 and MT5 whose trailing stop sits still for days at a time. On gold H1 it produced 153 signals in four and a half years, about 33 a year. If that sounds low, that's the argument I want to make before you look at a screenshot and decide something is broken. Most ATR trend tools centre their band on the current candle, so every new bar moves the anchor and a quiet stretch nudges you out of a trend that never broke. This one anchors to confirmed swi
Supertrend Volume Confirm
Isaac Alexander Pinero Garcias
DESCRIPTION Supertrend Volume Confirm — Trend Signals Confirmed by Volume and RSI Supertrend Volume Confirm is a buy/sell signal indicator based on the classic Supertrend, with two additional confirmation filters: volume and RSI. Unlike more complex multi-timeframe systems, this indicator works on a single timeframe, designed for traders who want something direct and easy to read. It works on any market symbol (forex, gold, indices, stocks, crypto) thanks to its default use of tick volume, unive
Dorian
Ivan Simonika
The Dorian indicator is an intuitive tool for determining the current market trend. It is based on a simple visualization in the form of two-color lines, which makes it convenient for use by both beginners and experienced traders. This indicator not only helps determine the direction of the trend, but also serves as a valuable advisor for making decisions about entering the market or closing positions. Due to its simplicity and effectiveness, Dorian is recommended for traders of any experience
LZ Session Boxes PRO
Lukasz Tomasz Zychal
LZ Session Boxes PRO is a professional-grade tool for day traders, designed to beautifully visualize global trading sessions (Asia, Pacific/Sydney, London, New York) across your entire chart history. It eliminates the confusion of broker time offsets by automatically detecting timezones and adjusting for Daylight Saving Time (DST), ensuring your session boxes always align perfectly with real-market hours. Feature highlights - 4 Major Sessions: highlights Asian, Pacific (Sydney), London, and N
EAAV Visual Position Sizer
Eduardo Alberto Araque Vera
EAAV Visual Position Sizer is an advanced graphical utility for MetaTrader 5 designed to simplify visual trade management and accurately calculate position sizing before executing any order. The tool places interactive levels directly on your chart, allowing traders to quickly and intuitively adjust entry, protective stop, and target levels. Key Features: • Automatic Position Sizing: Automatically calculates the exact volume (lots) based on a fixed account risk percentage or fixed monetary am
LT Support Resistance - Identifique Suportes e Resistências de Forma 100% Automática Você cansa de perder tempo traçando linhas de suporte e resistência manualmente? Ou se frustra porque sempre deixa passar aquele nível importante? O LT Support Resistance foi desenvolvido para eliminar esse trabalho, identificando e marcando automaticamente as zonas mais relevantes do seu ativo em múltiplos timeframes simultâneos. == A AUTOMAÇÃO INTELIGENTE DE NÍVEIS CRÍTICOS == Em vez de desenhar linhas manual
Buy Sell Range
Israr Hussain Shah
The Range Filter Buy and Sell indicator is a trend-following technical analysis tool designed to identify optimal entry and exit points in the market. It filters out market noise by creating dynamic bands around price movements, generating clear buy and sell signals when price breaks through these bands. Key Features Dynamic Range Filtering : Uses a sophisticated algorithm to calculate adaptive bands that adjust to market volatility Trend Identification : Clearly visualizes the current trend dir
P A R Intelligence is a multi-strategy trading indicator designed for professional traders who demand precision, flexibility, and advanced market analysis. This powerful tool combines two proven trading methodologies into one seamless interface, providing institutional-grade support/resistance detection with intelligent breakout and pattern recognition systems. Why This Is Your Ultimate Trading Edge DUAL-STRATEGY ARCHITECTURE Choose between - or combine - two powerful trading approaches:
Este quadro de tempo múltiplo e indicador de vários símbolos procura barras de pinos, estrelas da manhã / noite, engolfamentos, pinças, três linhas de ataque, barras internas e flâmulas e triângulos.   O indicador também pode ser usado no modo de gráfico único. Por favor, leia mais sobre esta opção no produto   blog .   Combinado com suas próprias regras e técnicas, este indicador permitirá que você crie (ou aprimore) seu próprio sistema poderoso. Recursos Pode monitorar todos os símbolos visíve
Sonic R Pro Enhanced EA - Versão 2025 249$ Apenas para os primeiros 5 compradores! Sinal ao Vivo Verifique o desempenho ao vivo do Sonic R Pro Enhanced: Estratégia de Trading Sonic R Pro Enhanced é uma versão aprimorada da estratégia Sonic R, automatizando operações com base na Dragon Band (EMA 34 e EMA 89) e incorporando algoritmos avançados para maximizar o desempenho. Timeframes: M15, M30 Pares suportados: XAUUSD, BTCUSD, AUDJPY, USDJPY Estilo de Trading: Swing Trading - Retrações e
Alpha One MT5 - Sistema avançado de deteção de tendências O Alpha One é um indicador profissional de acompanhamento de tendências que fornece sinais claros de COMPRA e VENDA com entrada automática, Stop Loss e três níveis de Take Profit desenhados diretamente no seu gráfico. O indicador apresenta uma visualização exclusiva do Campo de Energia, composta por 15 linhas dinâmicas que alternam entre verde e vermelho para refletir a força e a direção da tendência em tempo real. A energia verde indic
【Super Scanner】Indicator Introduction : The color of the Super Scanner which is green and climbing up means that the price trend is going up.The color of the Super Scanner is red and going down means that the price trend is going down. It is very simple to use it to judge the market trend! What's even better is that the open parameters of the indicators allow investors to adjust. You can adjust【Super Scanner】according to your needs. Adjust it faster to be closer to short-term market fluctuatio
Paid release: Lorentzian ML Classifier Signals MT5 is a paid MetaCoderStore indicator. Use the product comments for setup questions, feature requests, and feedback for future updates. Lorentzian ML Classifier Signals MT5 is a closed-bar signal indicator inspired by the high-demand Lorentzian distance classification approach used by many TradingView traders. It compares the current market state against similar historical states using Lorentzian distance, then confirms the result with trend, kerne
The indicator is based on the two-buffer scheme and does not require any additional settings. It can be used on any financial instrument without any restrictions. The indicator is a known ZigZag, but it does not redraw . The indicator allows to easily detect significant levels on the price chart, as well as demonstrates the ability to determine the probable direction of a price movement. The calculations are based on the candles' Close prices, thus improving the reliability of the levels. Param
Os compradores deste produto também adquirem
Trend Sniper X
Sarvarbek Abduvoxobov
4.9 (40)
Trend Sniper X é um indicador de acompanhamento de tendência para múltiplos tempos gráficos no MetaTrader 5 que ajuda os traders a identificar a direção da tendência e potenciais pontos de reversão com clareza e precisão. para MT4: https://www.mql5.com/en/market/product/193245 Informações sobre o preço: O preço atual é promocional e está sujeito a alterações à medida que novas atualizações e funcionalidades forem lançadas. Oferta Bônus: Para obter o Auto-Trade Assistant EA GRATUITO para este in
Smart Trend Trading System — MetaTrader 5 Após a compra, envie-me uma mensagem no MQL5 para receber Smart Universal Expert Advisor GRÁTIS, além do curso online, do manual em PDF e do acesso ao grupo privado. O STTS reúne a direção da tendência, sinais de entrada e saída, zonas de reversão e níveis de preço importantes diretamente no seu gráfico. Siga o sistema manualmente ou conecte um EA compatível separado para executar operações automaticamente com as configurações que você escolher. UM SISTE
SuperScalp Pro
Van Minh Nguyen
4.66 (35)
SuperScalp Pro - Professional Multi-Layer Confluence Scalping System SuperScalp Pro é um indicador avançado de scalping que aprimora o Supertrend clássico com vários filtros inteligentes de confirmação. Ele ajuda a identificar oportunidades de Buy/Sell com maior probabilidade, reduzindo significativamente os sinais falsos. Setas claras de Buy e Sell aparecem diretamente no gráfico, enquanto os níveis de Stop Loss e Take Profit baseados em ATR são calculados automaticamente em tempo real. Após a
SMC Intraday Formula
VividMind Digital Solutions
5 (26)
Vamos ser honestos primeiro. Nenhum indicador sozinho vai te tornar lucrativo. Se alguém te disser o contrário, está te vendendo um sonho. Qualquer indicador que mostre setas perfeitas de compra/venda pode ser feito para parecer impecável — basta dar zoom na parte certa da história e tirar um print das operações vencedoras. Nós não fazemos isso.  SMC Intraday Formula é uma ferramenta. Ela lê a estrutura do mercado para você, identifica as zonas de maior probabilidade de preço e mostra exatament
Gann Made Easy   é um sistema de negociação Forex profissional e fácil de usar, baseado nos melhores princípios de negociação usando a teoria do sr. W. D. Gann. O indicador fornece sinais precisos de COMPRA e VENDA, incluindo níveis de Stop Loss e Take Profit. Você pode negociar mesmo em movimento usando notificações PUSH. Entre em contato comigo após a compra para receber instruções de negociação e ótimos indicadores extras gratuitamente! Provavelmente você já ouviu muitas vezes sobre os método
Um novo Rei chegou à cidade - Indicador + Gestão de Ordens (TP1 + TP2 + TP3) + Enviador opcional de sinais para Telegram INCLUÍDO (GRÁTIS) (SISTEMA COMPLETO DE TRADING e SINAIS) Nosso melhor EA para Ouro: Gold Slayer Este indicador inclui uma estratégia avançada, um sistema de trading com gestão de ordens personalizável e um sistema de reversão à média que combina extensões de envelopes, apoiado por múltiplos filtros inteligentes de confirmação, como o RSI, para capturar entradas de reversão de
ARIPoint
Temirlan Kdyrkhan
1 (4)
ARIPoint is a powerful trading companion designed to generate high-probability entry signals with dynamic TP/SL/DP levels based on volatility. Built-in performance tracking shows win/loss stats, PP1/PP2 hits, and success rates all updated live. Key Features: Buy/Sell signals with adaptive volatility bands Real-time TP/SL/DP levels based on ATR Built-in MA Filter with optional ATR/StdDev volatility Performance stats panel (Success, Profit/Loss, PP1/PP2) Alerts via popup, sound, push, or email Cu
Auto Optimized SpeedAngle é um sistema de vetorização de momentum de nível institucional que elimina o sobreajuste ( curve-fitting ) por meio da otimização contínua de avanço ( Walk-Forward Optimization , WFO). Em vez de depender de entradas estáticas que se degradam quando os regimes de mercado mudam, o indicador recalibra dinamicamente seus parâmetros utilizando validação fora de amostra ( Out-of-Sample , OOS), garantindo que os sinais exibidos representem vantagens estatísticas genuínas e não
Neuro Poseidon MT5
Daria Rezueva
4.75 (52)
Neuro Poseidon is a new indicator by Daria Rezueva. It combines precise trading signals with adaptive TP/SL levels - creating best possible trades as a result! Message me and get  Neuro Poseidon Assistant  as a gift to automize your trading process! What makes it stand out? 1. Proven profitability on all assets and timeframes 2. Only confirmed BUY and SELL signals present on the chart 3. Adaptive TP & SL levels generated by the software for each trade 4. Easy to understand - suitable for al
A lenda está de volta: Entry Points Pro 10. O relançamento do lendário indicador que se manteve por 3 anos no Top-3 do MQL5 Market. Centenas de avaliações entusiasmadas (589 nas duas versões), milhares de traders operam com ele todos os dias, 31.000+ downloads da versão demo   MT4+MT5 . Li cada avaliação de vocês ao longo de cinco anos — e, em vez de promessas, coloquei as respostas dentro da versão 10. Do autor que está no mercado desde 1999 e valoriza a honestidade, a própria reputação e os se
FiboSniper Pro
Van Minh Nguyen
5 (3)
FiboSniper Pro – Multi-Filter Fibonacci System with Auto SL/TP and Control Panel FiboSniper Pro é um indicador técnico que combina Fibonacci Envelopes dinâmicos com vários filtros de confirmação para gerar sinais seletivos de Buy e Sell. Os níveis de Fibonacci são calculados com base em Moving Average e ATR e, em seguida, filtrados por ADX, EMA, RSI, ATR, Volume, Time e estrutura das velas. O indicador exibe diretamente no gráfico os níveis automáticos de Stop Loss e Take Profit baseados em ATR,
Welcome to ENTRY IN THE ZONE AND SMC MULTI TIMEFRAME SPECIAL BENEFIT / FOR OUR MQL5 CUSTOMERS FREE ACCESS TO THE NEW TOOL  — COMING SOON — Learn more on our official website  : https://www.fableedge.net Entry In The Zone and SMC Multi Timeframe is a real-time market analysis tool based on Smart Money Concepts (SMC), designed to analyze market structure, price direction, and key trading zones. It supports both Single-Timeframe Analysis and Multi-Timeframe Analysis, providing a clearer view of the
Unix Scalper
Issam Kassas
4 (4)
Unix Scalper — MetaTrader 5 Após a compra, envie-me uma mensagem no MQL5 para receber Smart Universal Expert Advisor GRÁTIS, além do curso online, do manual em PDF e do acesso ao grupo privado. Identifique a oportunidade. Veja o plano. Escolha como operar. O UNIX Scalper reúne análise de mercado, decisões BUY/SELL/WAIT e níveis de Entry, Stop Loss, TP1 e TP2 em um painel organizado. VEJA O SINAL E O PLANO • Decisões claras: BUY, SELL ou WAIT. • Níveis definidos: Entry, Stop Loss, TP1 e TP2. •
M1 Sniper MT5
Oleg Rodin
5 (7)
O   M1 SNIPER   é um sistema indicador de negociação fácil de usar. É um indicador de seta projetado para o período M1. O indicador pode ser usado como um sistema independente para scalping no período M1 e pode ser usado como parte do seu sistema de negociação existente. Embora este sistema de negociação tenha sido projetado especificamente para negociação no M1, ele também pode ser usado em outros períodos. Originalmente, desenvolvi este método para negociar XAUUSD e BTCUSD. Mas considero-o úti
Tokyo mt5 Indicator
Vasiliy Strukov
5 (7)
O Tokyo Indicator oferece uma visão geral visual clara da direção da tendência, de possíveis sinais de negociação e das condições de mercado. Sua linha de tendência em degraus e codificada por cores distingue as fases de alta (azul) das fases de baixa (magenta). Setas direcionais correspondentes destacam possíveis oportunidades de compra e venda quando a tendência exibida muda. Um painel integrado reúne o sinal atual, o viés de mercado, o momentum, a volatilidade e a qualidade do sinal em uma v
FX Trend MT5 NG
Daniel Stein
5 (6)
FX Trend NG: A Nova Geração de Inteligência de Tendência Multi-Mercado Visão Geral FX Trend NG é uma ferramenta profissional de análise de tendências e monitoramento de mercado em múltiplos períodos de tempo. Permite compreender a estrutura completa do mercado em segundos. Em vez de alternar entre vários gráficos, você visualiza instantaneamente quais ativos estão em tendência, onde o momentum está enfraquecendo e onde existe alinhamento forte entre diferentes timeframes. Oferta de Lançamento
Adaptive Price Action Engine Compre um indicador, ganhe o EA de graça Análise Auto-Otimizada de Tendências e Padrões de Candlestick em Múltiplos Timeframes Os mercados estão em constante mudança, e nem todos os padrões de Price Action têm o mesmo valor em todas as condições de mercado. O Adaptive Price Action Engine foi desenvolvido para se adaptar às mudanças nas condições do mercado, combinando estrutura de tendência, análise Multi-Timeframe, padrões de candlestick e otimização estatística em
Power Candles MT5
Daniel Stein
4.58 (12)
Power Candles V3 - Indicador de força com auto-otimização O Power Candles V3 transforma a força da moeda e do instrumento num plano de negociação prático em todos os gráficos aos quais está associado. Em vez de se limitar a colorir as velas, executa uma otimização automática em tempo real em segundo plano e apresenta-lhe os melhores valores de Stop Loss, Take Profit e limiar de sinal para o símbolo em questão. Basta um clique para o adotar na negociação em tempo real — as linhas de entrada, Stop
Scalper Vault   é um sistema profissional de escalpelamento que fornece tudo o que você precisa para um escalpelamento bem-sucedido. Este indicador é um sistema de negociação completo que pode ser usado por comerciantes de forex e opções binárias. O período de tempo recomendado é M5. O sistema fornece sinais de seta precisos na direção da tendência. Ele também fornece sinais superiores e inferiores e níveis de mercado Gann. Os indicadores fornecem todos os tipos de alertas, incluindo notificaçõe
Atomic Analyst MT5
Issam Kassas
4.47 (60)
Atomic Analyst — MetaTrader 5 Após a compra, envie-me uma mensagem no MQL5 para receber Smart Universal Expert Advisor GRÁTIS, além do curso online, do manual em PDF e do acesso ao grupo privado. O Atomic Analyst reúne a ação do preço, a direção da tendência, sinais de entrada e saída, Stop Loss e vários níveis de Take Profit diretamente no seu gráfico. VEJA O SINAL. ENTENDA O CENÁRIO. O Atomic Analyst organiza sua análise em informações visuais claras: • Setas de compra e venda para identificar
FX Power MT5 NG
Daniel Stein
5 (33)
FX Power: Analise a Força das Moedas para Decisões de Negociação Mais Inteligentes Visão Geral FX Power é a sua ferramenta essencial para compreender a força real das principais moedas e do ouro em quaisquer condições de mercado. Identificando moedas fortes para comprar e fracas para vender, FX Power simplifica as decisões de negociação e revela oportunidades de alta probabilidade. Quer você prefira seguir tendências ou antecipar reversões usando valores extremos de Delta, esta ferramenta adap
Divergence Bomber
Ihor Otkydach
4.89 (94)
Cada comprador deste indicador recebe adicionalmente, e de forma gratuita: A ferramenta exclusiva "Bomber Utility", que acompanha automaticamente cada operação, define os níveis de Stop Loss e Take Profit e fecha operações de acordo com as regras da estratégia; Arquivos de configuração (set files) para ajustar o indicador em diferentes ativos; Set files para configurar o Bomber Utility nos modos: "Risco Mínimo", "Risco Balanceado" e "Estratégia de Espera"; Um vídeo tutorial passo a passo que a
Crystal Heikin Ashi Signals
Muhammad Jawad Shabir
5 (4)
Crystal Heikin Ashi Signals—Professional Trend & Signal Detection Indicator Advanced Heikin Ashi Visualization with Intelligent Signal System for Manual & Automated Trading Final Price: $149 ---------> Price goes up $10 after every 10 sales . Limited slots available — act fast . Overview User Guide PDF Crystal Heikin Ashi Signals is a professional-grade MetaTrader 5 indicator that combines pure Heikin Ashi candle visualization with an advanced momentum-shift detection system. Designed for both m
DayTrader PRO
Davit Beridze
5 (4)
DayTrader PRO O DayTrader PRO é um indicador de trading avançado que combina o Filtro de Laguerre de John Ehlers com um potente motor de otimização automática. Em vez de utilizar parâmetros fixos, o indicador procura automaticamente as melhores definições com base nas condições recentes do mercado, ajudando-o a adaptar-se à volatilidade variável sem necessidade de ajustes manuais constantes. O indicador gera sinais claros de COMPRA (BUY) e VENDA (SELL), juntamente com níveis adaptativos de Stop
Quant Direction MT5
Georgios Kalomoiropoulos
Quant Direction é uma ferramenta de análise de mercado tridimensional. Ela oferece uma análise de mercado totalmente objetiva, baseada em algoritmos, que calcula simultaneamente desvios percentuais precisos em diversos parâmetros. Desenvolvido com ferramentas avançadas de modelagem com inteligência artificial e rigorosamente testado, o algoritmo foi projetado para interpretar o mercado com precisão sem precedentes. Você pode analisar qualquer par de moedas ou instrumento financeiro em sua plataf
Btmm state engine pro
Garry James Goodchild
5 (4)
BTMM State Engine Pro by G-Labs — Beat The Market Maker indicator for MetaTrader 5. Asian session range, London and New York kill zones, level progression (L1/L2/L3), peak formation detection (PFH/PFL), entry signals, and a multi-pair scanner from one chart. Stop scanning charts one pair at a time. The State Engine tracks the BTMM daily cycle automatically — Asian box, room boundaries, level blocks, peak formations, and filtered entries — while the scanner dashboard shows level, peak status, d
SkyHammer Signal Pro Indicador profissional de sinais de tendência sem repaint, com níveis Entry, SL e TP bloqueados SkyHammer Signal Pro é um indicador estruturado de tendência e momentum, desenvolvido para traders que procuram sinais claros, fixos e verificáveis. Funciona melhor em timeframes baixos, como M1 e M5 . O indicador não tenta prever topos ou fundos do mercado. Em vez disso, ele aguarda estrutura de mercado confirmada, direção de tendência, força de momentum, volatilidade saudável e
ATstrong
Zaha Feiz
5 (1)
ATSTRONG PRO: Indicador de Estrutura de Mercado e Rompimento Motor de Detecção de Rompimento | 5 Alvos TP Dinâmicos | Painel de Controle ao Vivo | Sem Repintura Preço de Lançamento Preço Atual: $59 — O preço aumenta em $10 após cada 10 vendas. ATSTRONG PRO é um indicador avançado de rompimento e estrutura de mercado institucional projetado para MetaTrader 5. Ele detecta pivôs de swing de alta probabilidade, identifica zonas agrupadas de acúmulo de suporte e resistência, e sinaliza Quebra de E
Precision Spike Detector
Francisco Mandomo Simbine
5 (2)
Precision Spike Detector V3 – Institutional-Grade AI Trading System Attention: The price increases by US$50 for every 10 purchases.  Final price: US$599 Precision Spike Detector V3   is a   state-of-the-art, institutional-grade market analysis system   for   MetaTrader 5 , designed to detect   high-probability market movements   in synthetic indices such as   Boom, Crash, GainX, and PainX . After purchase, send me a private message to receive the optimized configuration files,  the installation
O UZFX {SSS} Scalping Smart Signals v5.0 MT5 é um indicador de negociação de alto desempenho, sem repintura, concebido para scalpers, day traders e swing traders que exigem sinais precisos e em tempo real em mercados em rápida evolução. Desenvolvido pela (UZFX-LABS), este indicador combina a análise da ação do preço, a confirmação de tendências e a filtragem inteligente para gerar sinais de compra e venda de alta probabilidade, sinais de alerta e oportunidades de continuação de tendências em tod
Mais do autor
Footprint Matrix Pro turns your MetaTrader 5 chart into an order-flow footprint chart . Every column shows who traded at each price: aggressive buyers lifting the ask against aggressive sellers hitting the bid. It is built from the real tick history of your broker, and every number is recorded tick by tick from the market data. You can see absorption, exhaustion, imbalances and real displacement as they happen, inside the candle and not only after it closes. Five footprint modes (one click) Bi
Signal Verdict Pro reads the indicators that are already on your chart, finds the signal that just fired and gives it a verdict : does this signal have substance, or is it noise? Every signal gets a score from 0 to 100 from 17 scenario checks, the indicator's own track record on this chart and a live repaint test. You keep your indicators and your strategy. Signal Verdict Pro adds the second opinion: STRONG , VALID , WEAK or REJECT , with the reasons for and against the trade. Works with the i
Currency Velocity Matrix shows the strength of the 8 major currencies ( EUR, GBP, AUD, NZD, USD, CAD, CHF, JPY ), calculated from all 28 pairs . It also shows the rate of change : which currency is gaining strength the fastest and which one is losing it the fastest. Knowing which currency is strong is not enough. A strong currency may already be losing momentum. The best opportunities usually appear when the currency gaining strength the fastest meets the currency losing strength the fastest . T
Market Maker Cycle Matrix shows the daily market maker cycle on your MetaTrader 5 chart. The Asian session builds a range. The London open often runs the stops on one side of it. Then the real move starts, room after room, until the market maker reaches the target and the cycle turns. The indicator tracks this cycle for you: the Asian range , the kill zones , the level count L1 / L2 / L3+ , the peak formation that turns the cycle, and five M15 entry types with entry, stop loss and two targets. A
Gold Killzone Sweep Matrix trades the most famous ICT idea for gold. Every kill zone (Asia, London, New York) leaves a high and a low . Stop orders sit beyond them, and that is liquidity . Smart money takes this liquidity (the sweep ) and then turns the market (the change of character, CHoCH ). Most kill zone indicators only draw the lines and leave the rest to you. This one does the whole job. It finds the sweep, confirms the CHoCH and prints a buy or sell arrow with entry, stop loss and target
Triple Edge Prop – three rule-based NASDAQ-100 intraday strategies in one Expert Advisor. Each engine has its own logic, its own magic number, its own timeframe and its own trading window. Together they cover three different market situations: a volatility breakout , an institutional VWAP pullback and an overnight bias breakout . Built for prop-firm challenges and funded accounts, with a full challenge guard on board. Why three strategies instead of one? A single strategy goes through losing
Momentum Decoupling Scalper turns a popular 1-minute scalping method for gold into clear, non-repainting signals. A signal on the 15-minute chart arms the setup, the first momentum candle on the 1-minute chart is the entry, and every trade comes with a stop loss, three targets (TP1 / TP2 / TP3) and an automatic break-even . The part most traders skip is the one that matters: the market must move on its own momentum against the US dollar . The indicator measures the dollar for you (the broker's d
Trend Exhaustion Radar answers one question that every trader asks in a strong move: is this trend running out of strength? Instead of watching three oscillators at the same time and missing the moment, the indicator reads DI+ / DI-, ADX and RSI for you, finds the classic warning signs - extreme zones, divergences, ADX hooks - and combines them into one traffic light with a rule score from 0 to 6. You get three windows in one product: the price chart with a 9/21 EMA cloud, warning markers and di
Filtro:
Sem comentários
Responder ao comentário