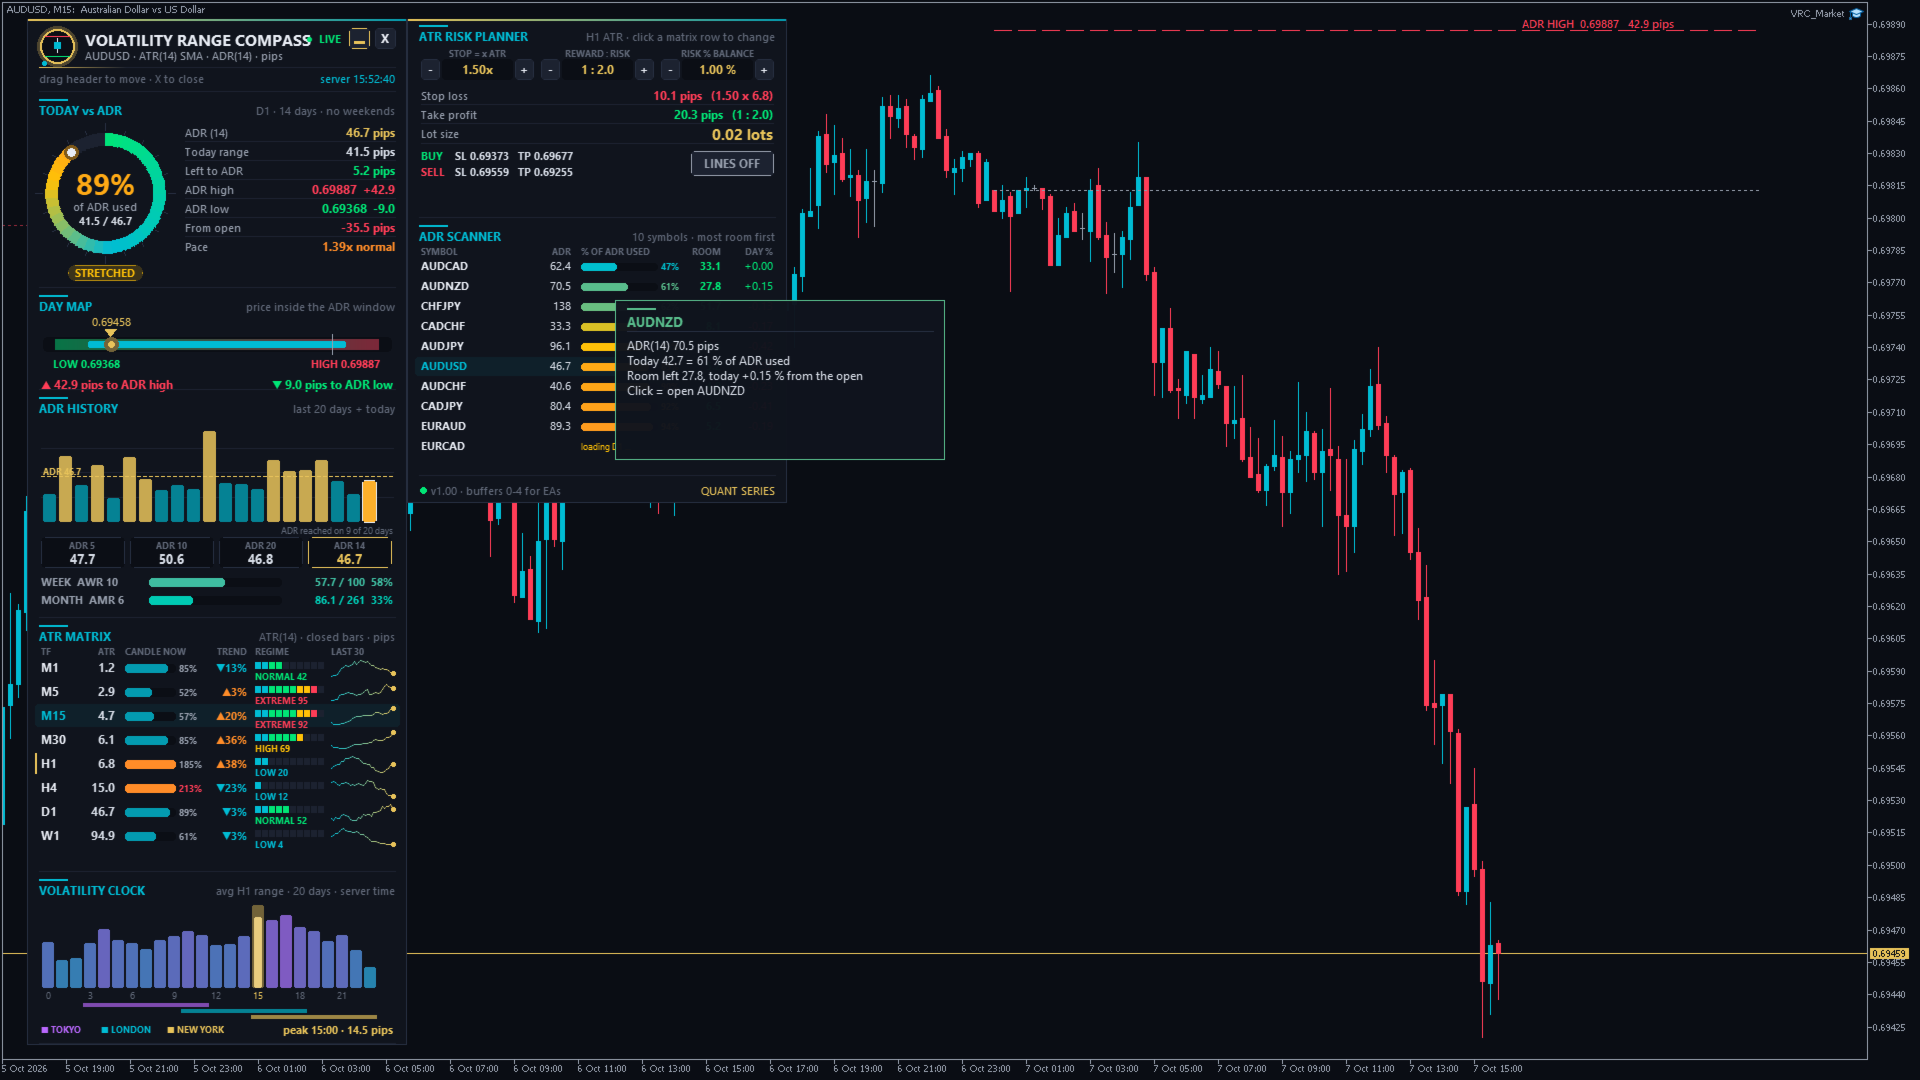
Volatility Range Compass

Volatility Range Compass is a volatility dashboard for MetaTrader 5. It answers the questions every trader has before entering a trade:

  • How far does this market normally move in a day, a week, a month? (ADR, AWR, AMR)
  • How much of today's normal move is already done, and is there still room? (% of ADR used, ADR targets)
  • How volatile is each timeframe right now compared with its own history? (ATR matrix M1 to W1 with regime)
  • Which hours of the day move the most? (volatility clock)
  • How big should my stop be, and which lot size keeps my risk at exactly 1 %? (ATR risk planner)
  • Which of my symbols still has the most room today? (ADR scanner)

Everything is calculated from the price history of your broker. There are no external servers, DLLs or internet connections. The indicator never opens or closes trades.

■ The terms in 30 seconds

  • ATR (Average True Range) = the average size of the last N candles (default 14), including gaps. An H1 ATR of 12 pips means an H1 candle is usually about 12 pips tall.
  • ADR (Average Daily Range) = the average distance between the daily high and the daily low over the last N completed days (default 14). Weekend candles are skipped by default.
  • AWR / AMR = the same for weeks (default 10) and months (default 6).
  • ADR high target = today's low + ADR. If price keeps rising, a normal day usually ends around this level.
  • ADR low target = today's high - ADR. If price keeps falling, a normal day usually ends around this level.
  • % of ADR used = today's range (high - low) divided by the ADR. 100 % = today has already moved as much as an average day.

■ Installation and first start

  1. After the purchase, the indicator appears in the MetaTrader 5 Navigator under Indicators > Market.
  2. Drag Volatility Range Compass onto any chart (forex, gold, silver, indices, crypto, any timeframe).
  3. Click OK. The default settings work for every symbol, so you do not need to change anything.
  4. On the first start the indicator loads the history of all timeframes (M1 to W1). Depending on your broker this takes a few seconds. Sections that are still loading show LOADING.
  5. Drag the dashboard by its header to any place on the chart. Position and settings are remembered for each chart.

■ The dashboard, section by section

1. Header
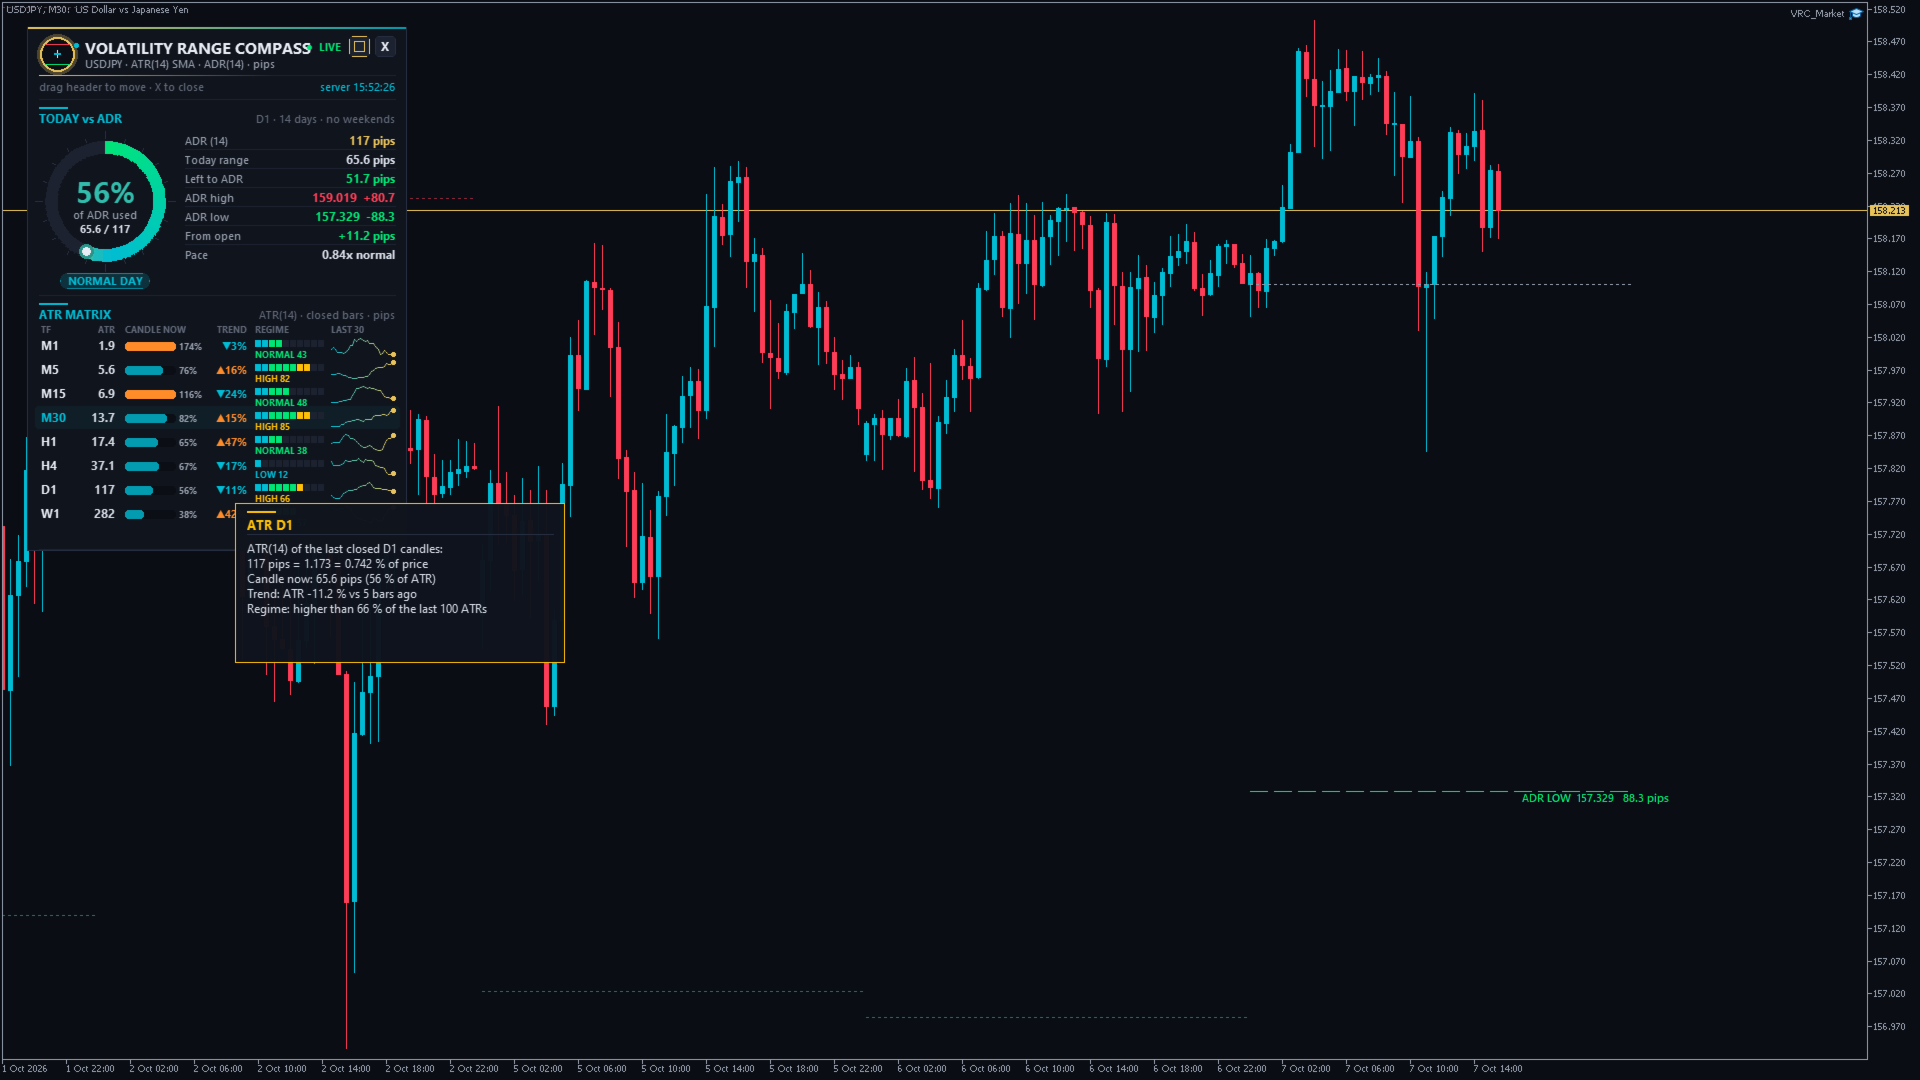
Symbol, ATR period and method, ADR period and the unit used (pips or points). The dot shows LIVE or LOADING and the server time is shown on the right. Buttons: ▭ switches between the full dashboard and the compact panel, and X folds the dashboard into a small pill. Click the pill to open the dashboard again.

2. Today vs ADR
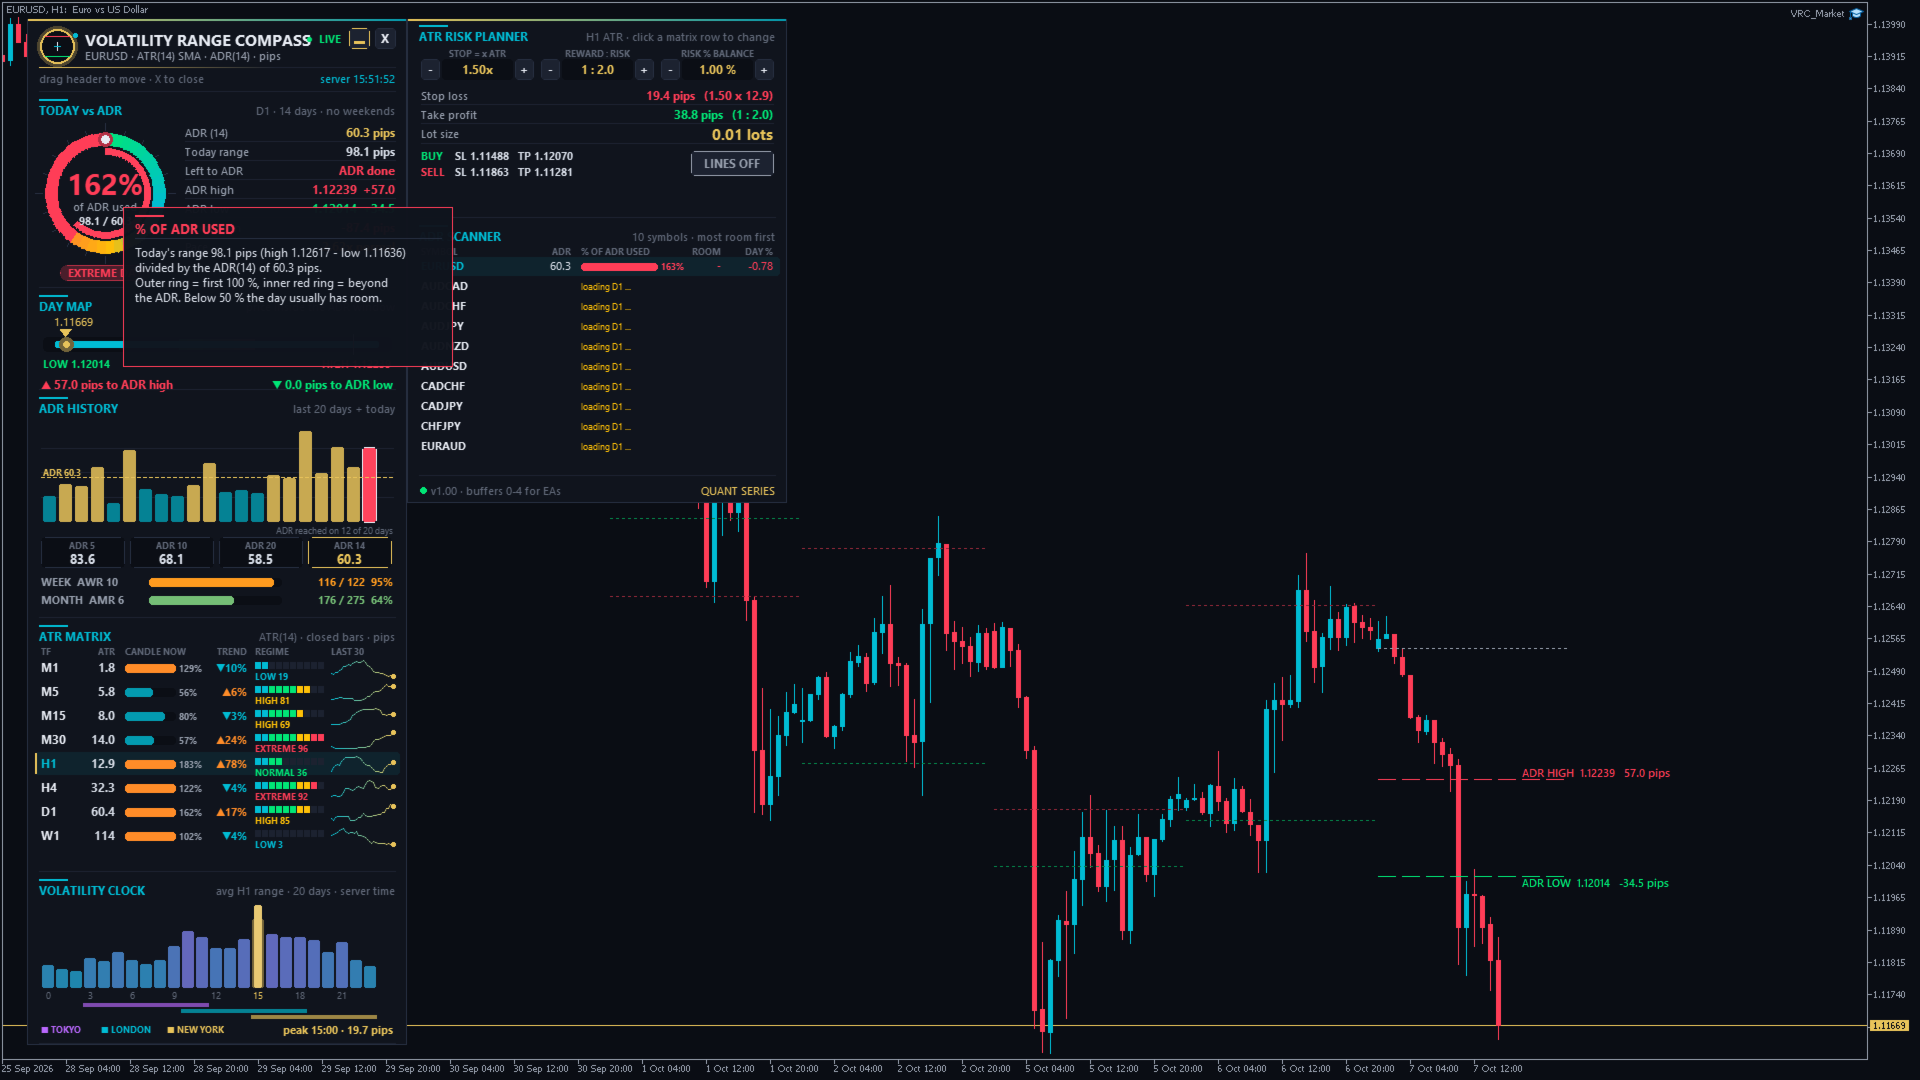
The ring shows how much of today's ADR is already used. The outer ring fills up to 100 %, and a red inner ring shows the part beyond 100 %. Below the ring, the day status:

  • ROOM TO RUN (below 50 %): the day has most of its normal move still ahead.
  • NORMAL DAY (50-80 %)
  • STRETCHED (80-100 %): most of the normal move is done.
  • ADR HIT (100-130 %): an average day would be over.
  • EXTREME DAY (above 130 %): unusually large day, often news or trend days.

On the right: ADR, today's range, range left to the ADR, ADR high and low target with the distance from the current price, distance from the day's open and the pace. The pace compares today's movement with what is normal at this time of the day (from the volatility clock). 1.0x = normal, 1.5x = the day is moving 50 % faster than usual, 0.5x = a slow day. Early in the day (before about 6 % of the normal daily movement) it shows early in day.

3. Day map
A horizontal map of today. The coloured track is the ADR window from the ADR low target (green) to the ADR high target (red). The cyan bar is today's range, the grey tick is the day's open and the gold marker is the current price. Below it you see how many pips are left to each target. The window shrinks as the day range grows, and when the cyan bar fills it, the ADR is done.

4. ADR history
The last 20 days and today as bars. Gold bars reached the ADR that was valid on that day, and cyan bars did not. The dashed line is the current ADR, and the counter shows on how many of the 20 days the ADR was reached. Below: ADR 5 / 10 / 20 / 14 (a short ADR above the long ADR = volatility is rising) and the weekly (AWR) and monthly (AMR) range with the share already used this week and this month.

5. ATR matrix (M1 to W1)
One row per timeframe, always using closed candles:

  • ATR in pips (forex), in 0.10 steps (gold, shown as pips) or in points (indices, crypto).
  • Candle now: the current candle's range in % of its ATR. Above 100 % = the candle is already bigger than normal (orange).
  • Trend: ATR now compared with 5 candles ago. ▲ = volatility is rising, ▼ = it is falling.
  • Regime: rank of the current ATR among the last 100 ATR values. LOW (below 20), NORMAL (20-60), HIGH (60-85), EXTREME (above 85).
  • Last 30: sparkline of the last 30 ATR values.

The row of the chart timeframe is highlighted. Click a row to use the ATR of that timeframe in the risk planner (gold marker).

6. Volatility clock
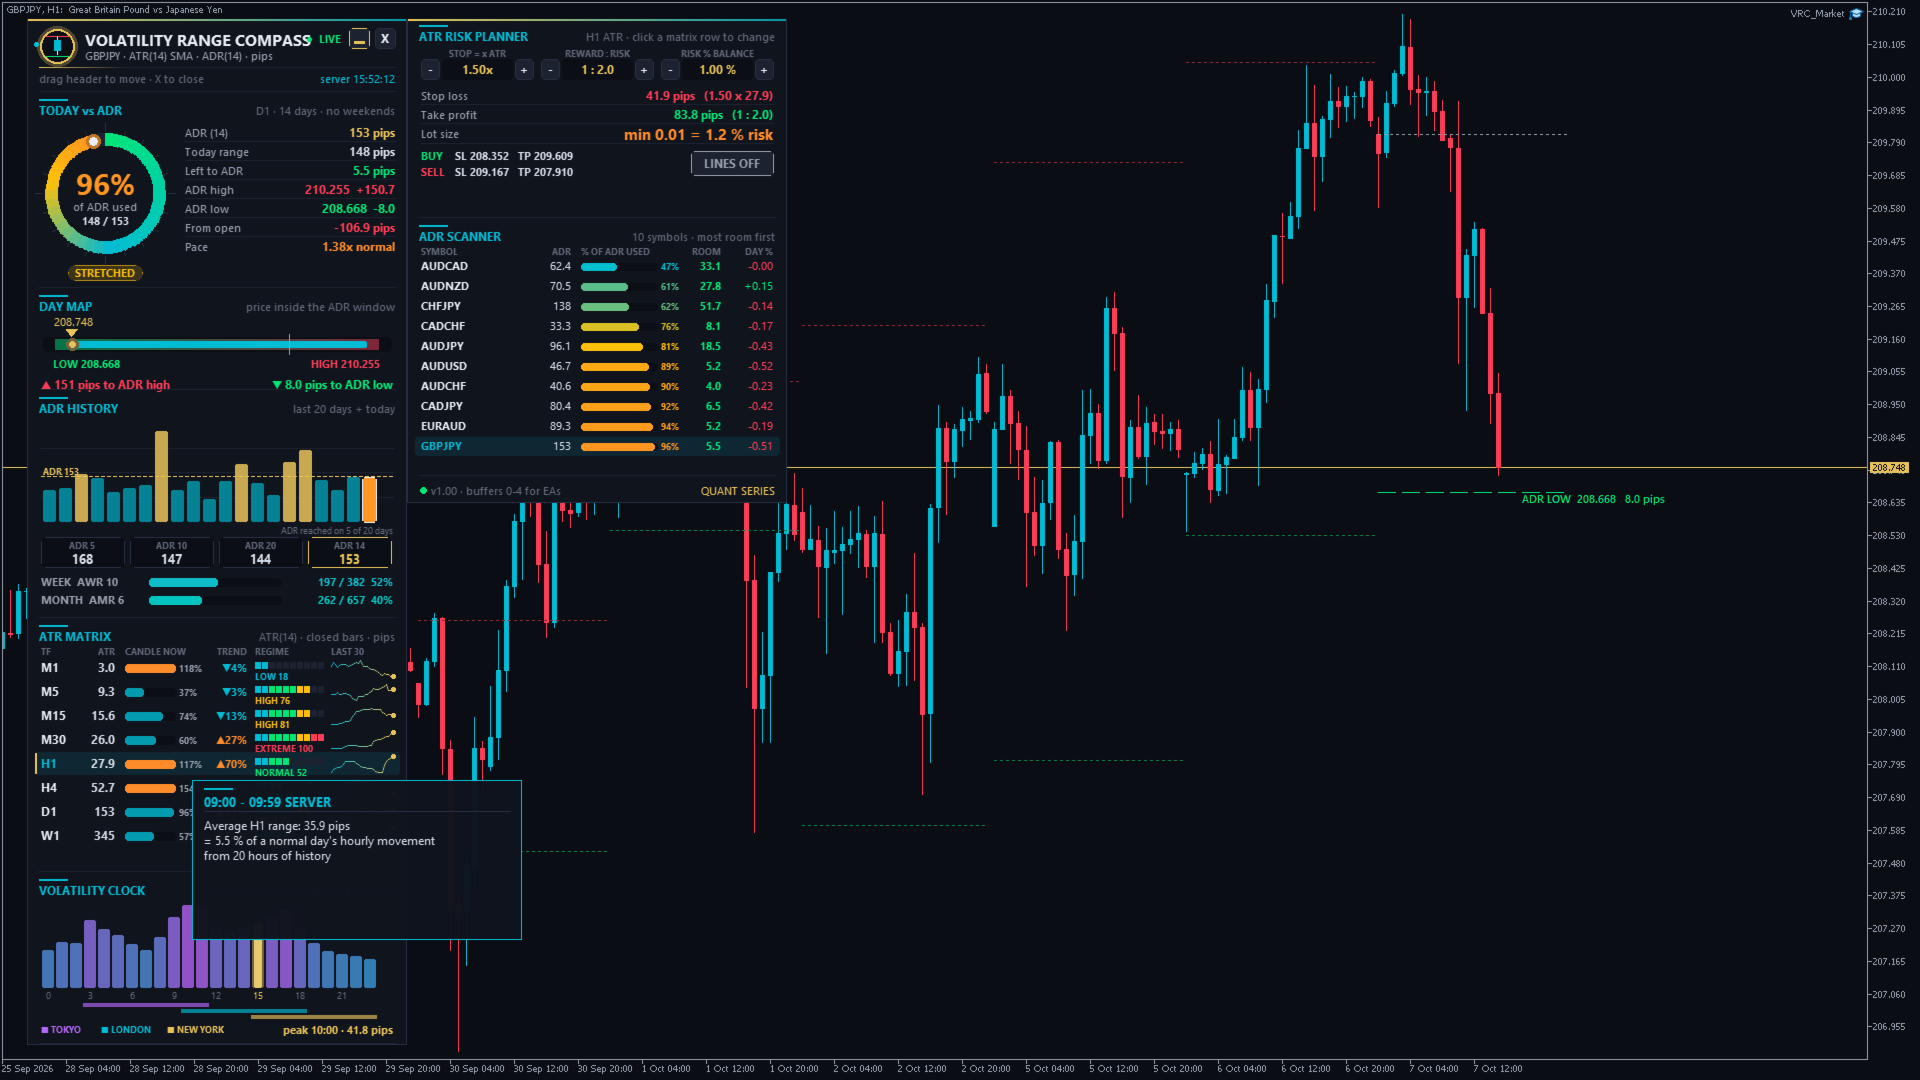
Average H1 range of each hour of the day over the last 20 days, in server time. The gold bar is the current hour and its inner bar shows how much this hour has moved so far. Below the bars are the Tokyo, London and New York sessions shifted to your server time, and the peak hour with its average range.

7. ATR risk planner
Calculates the stop, the target and the lot size from the ATR:

  • STOP = x ATR (0.5 to 3.0), REWARD : RISK (0.5 to 5.0) and RISK % BALANCE (0.25 to 5 %). Change them with the - / + buttons.
  • Stop loss and take profit in pips, plus the exact price levels for a BUY from the ask and a SELL from the bid.
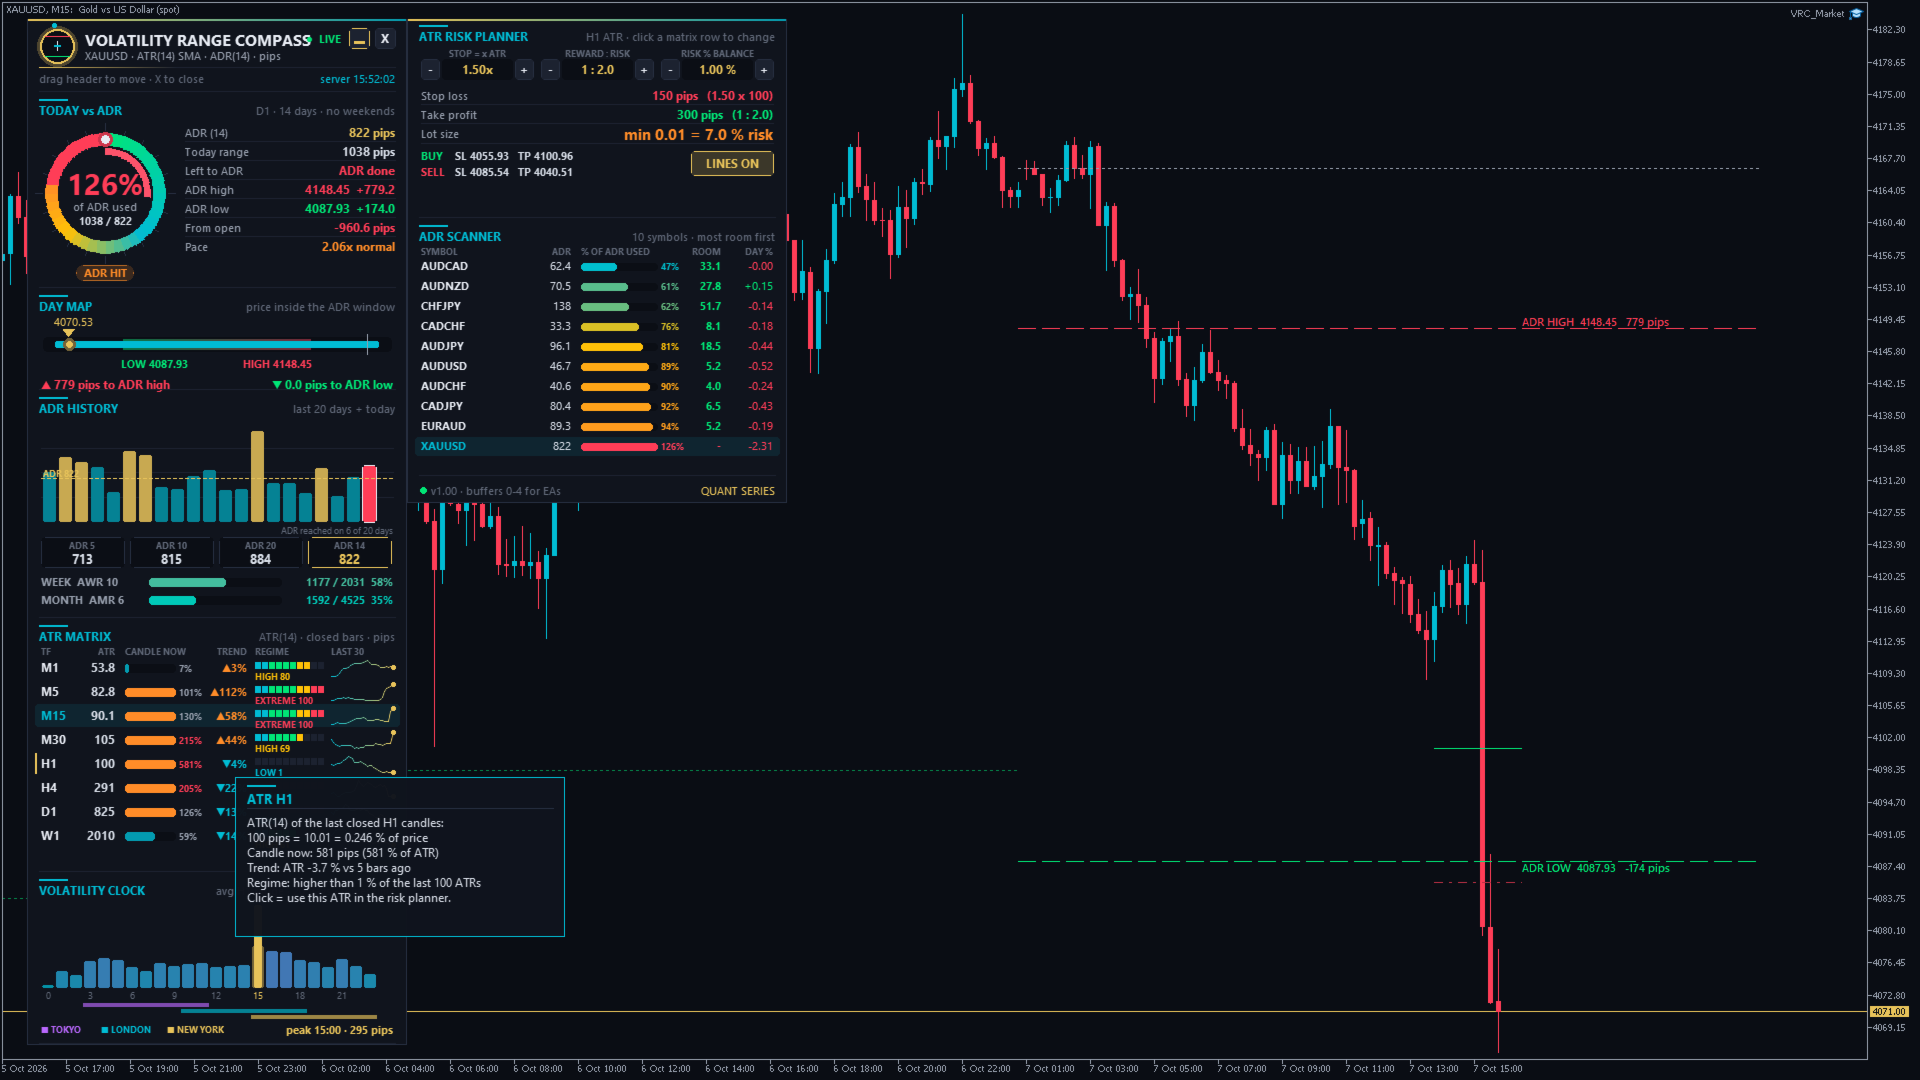
  • Lot size calculated from the tick value of your broker and your balance. It is always rounded down to the lot step, so the real risk is never higher than the chosen %. If even the minimum lot is too large for the chosen risk, the planner shows the real risk of the minimum lot, for example min 0.01 = 7.0 % risk.
  • LINES ON / OFF draws the BUY and SELL stop loss and take profit lines next to the price.

The planner only calculates and never places orders.

8. ADR scanner
Up to 14 symbols (your Market Watch or your own list), sorted with the most room first. Columns: ADR, % of ADR used, room left to the ADR and today's % change. The chart symbol is always included. Click a symbol to open it in this chart or in a new chart (input).

9. ADR targets on the chart
Dashed lines for today's ADR high target (red) and ADR low target (green) with price and distance, a dotted line for the day's open, and dotted lines for the final ADR targets of the last 5 days. The targets move live during the day. Hover any line to see its details.

Tooltips: hover any value, bar or row in the dashboard to see what it means and how it is calculated.

■ How to use it - step by step

Before you enter a trade:

  1. Look at % of ADR used. Below 50 % (ROOM TO RUN), the day usually still has movement left. Above 100 % (ADR HIT), most of the day's normal move is done, so new breakout trades have less room and reversals become more likely.
  2. Check the distance to the ADR target in your trade direction. If you want 40 pips but only 15 pips are left to the ADR high target, the trade needs an above-average day.
  3. Check the pace. A pace above 1.3x early in the session often points to a trend or news day. A pace below 0.7x points to a quiet range day.
  4. Check the regime of your trading timeframe in the ATR matrix. HIGH or EXTREME = wider stops are needed. LOW = expect smaller moves or a coming expansion.
  5. Check the volatility clock. Entries right before the peak hours have the most movement ahead of them.

Plan the trade:

  1. Click the row of your trading timeframe in the ATR matrix.
  2. Set the stop to 1.5x ATR (a common starting value), your reward : risk and your risk %.
  3. Read the lot size and the SL / TP price levels from the planner, or switch LINES ON to see them on the chart.
  4. Enter the trade with your usual order panel. The indicator does not trade.

Example (EURUSD): ADR = 60 pips, today's range = 25 pips (42 % used, ROOM TO RUN), pace = 1.1x, price is 20 pips below the ADR high target. H1 ATR = 13 pips, regime NORMAL. Stop 1.5 x 13 = 19.5 pips, target 1 : 2 = 39 pips. The target lies beyond the ADR high target, so a smaller target (about 20 pips) or a better entry fits a normal day better. With a 10,000 USD balance and 1 % risk the planner shows the lot size for 100 USD at a 19.5 pip stop.

Other typical uses:

  • Take profit at the ADR target: many day traders close at or before the ADR high / low target.
  • Avoid late entries: skip breakout trades on ADR HIT or EXTREME DAY.
  • Fade extremes: when price reaches the ADR target with a falling pace, look for reversal signals from your own strategy.
  • Choose the symbol: the scanner shows which pairs still have room today.
  • Adjust stops to volatility: use ATR-based stops instead of fixed pips, so your stop is wide enough in volatile phases and tight in quiet ones.

■ Alerts

  • ADR levels: an alert when today's range reaches 80 % and 100 % of the ADR (input ADR used levels, comma separated, for example 50,80,100,130). Each level fires once per day. Levels that were already passed when you load the indicator do not fire.
  • Volatility spike: an alert when the current chart candle is at least 2 x ATR big (input spike = candle range >= N x ATR).
  • Delivery as popup, sound, push notification to the MetaTrader app on your phone and / or e-mail. Push and e-mail must be set up in MetaTrader under Tools > Options > Notifications / Email.

■ Inputs - every setting explained

ATR
period (14) number of candles in the ATR
smoothing method (SMA) SMA = MetaTrader's standard ATR (identical values). Wilder / RMA = TradingView standard. EMA = reacts faster.
matrix timeframes (M1,M5,M15,M30,H1,H4,D1,W1) comma separated list, maximum 9. Allowed: M1, M5, M15, M30, H1, H4, D1, W1, MN
regime = rank inside the last N values (100) how many past ATR values are used for LOW / NORMAL / HIGH / EXTREME
ADR
days in the ADR (14) completed days in the average daily range
skip Saturday / Sunday candles (true) ignores the small weekend candles some brokers have, so they do not lower the ADR
weeks in the AWR (10), months in the AMR (6) periods of the weekly and monthly average range
Alerts
ADR used levels in % (80,100) leave empty to switch the ADR alerts off
volatility spike (true), multiplier (2.0) alert when the chart candle reaches N x ATR
popup / sound / push / e-mail how alerts are delivered
Chart
draw ADR high / low targets (true) lines and labels on the chart
ADR targets of the last N days (5) history of the final targets (0 = off)
draw the day open (true) dotted line at today's open
colours ADR high target, ADR low target, day open
Planner (start values, change them later with - / + in the dashboard)
stop loss = N x ATR (1.5), take profit = R x stop (2.0), risk in % of balance (1.0) start values of the planner
Scanner
symbols (empty) your own list, for example EURUSD,GBPUSD,XAUUSD,US30. Empty = the first symbols of the Market Watch. Use the exact symbol names of your broker (with suffix, for example EURUSD.r).
max. symbols (10) 1 to 14
click on a symbol switch this chart / open a new chart / do nothing
Display
volatility clock days (20) days of H1 history for the clock and the pace
pip size (Auto) Auto = forex pips, gold 0.10, silver 0.01, indices / crypto points. Broker points, or a custom pip size in price units.
full dashboard or compact panel start mode (you can switch any time with the button)
move away from other panels (true) if other panels are on the chart, the dashboard moves to a free place, switches to the compact panel or folds to the pill
start X / Y (20 / 30) first position in pixels. After that you can drag the dashboard anywhere.
show tooltips (true) explanations on mouse hover
EA buffers: bars calculated (1500) how many bars the 5 buffers are filled for

■ For Expert Advisors (iCustom)

Buffers: 0 = ADR (price units), 1 = ADR high target, 2 = ADR low target, 3 = ADR used in %, 4 = ATR of the chart timeframe. Buffers 0-3 are empty on D1 and higher timeframes and on days whose first bar is outside the calculated window. The ADR of each day only uses the days before it, so values of closed bars do not repaint.

■ FAQ

Why are the values different from another ADR indicator? Check three things: the number of days, whether weekend candles are skipped, and whether today is included. This indicator uses completed days only and skips weekend candles by default.

Gold shows "pips" - what is a pip on gold? In Auto mode, 1 pip on gold = 0.10 USD of price movement (for example 2350.00 to 2350.10). Choose broker points or a custom pip size if you prefer another unit.

Which timezone is used for days and hours? The server time of your broker, the same as the D1 and H1 candles of your chart.

The dashboard covers my candles. Drag it to another place, click ▭ for the compact panel, or click X to fold it to a small pill.

A section shows LOADING. MetaTrader is still downloading the history of that timeframe. It disappears after a few seconds. If it stays, open a chart of that timeframe once.

Can I use it on several charts? Yes. Every chart keeps its own position and settings.

■ Notes

  • MetaTrader 5 indicator for the main chart window. It works with every broker and symbol: forex, gold, silver, indices, crypto, energies.
  • In the Strategy Tester (visual mode) the full dashboard runs on the tester history. Clicking a scanner symbol does not switch charts there.
  • The indicator does not trade. It is an analysis and planning tool and does not guarantee profits.
Рекомендуем также
Phoenix Orb Asia
Nigel Nii Darku Narnor Darko
This is a professional-grade institutional toolkit designed for breakout traders and trend followers worldwide. It specializes in the  Opening Range Breakout (ORB)  strategy—one of the most consistent ways to capture intraday volatility during the London and New York opens. This indicator does the heavy lifting for you by automatically mapping out the high and low of the first 15 minutes of any session. It combines this with  Smart Money Concepts (SMC) , identifying structural shifts like  BOS
Этот индикатор на панели инструментов мульти-таймфрейма и мультисимвольного расхождения отправляет предупреждение, когда одно или два разных расхождения были обнаружены на нескольких таймфреймах, а не на отдельных расхождениях. Его можно использовать на всех таймфреймах от M1 до MN. Одновременно на панели управления может отображаться максимум 9 таймфреймов. Можно включить фильтр тренда скользящего среднего, RSI или полос Боллинджера, чтобы отфильтровать только самые сильные настройки. В сочетан
Wilizard SMC Suite — это полный набор инструментов Smart Money Concepts / ICT в одном быстром индикаторе без перерисовки. Вместо того чтобы загружать на график шесть отдельных инструментов, вы получаете все институциональные концепции — структуру рынка, ордер-блоки, имбалансы (FVG), ликвидность, премиум/дискаунт, киллзоны, мультитаймфреймовую панель и сигналы конфлюенса — которые работают вместе и подтверждаются только на закрытых барах. Всё, что вы видите, рассчитывается ТОЛЬКО по закрытым св
Arnold Tradenegger
Saiful Izham Bin Hassan
Арнольд Трейденеггер Элит — это профессиональный советник, построенный на устойчивом алгоритме, предназначенном для современных рыночных условий. Он сочетает динамическую фильтрацию рынка с институциональным управлением рисками. Система использует мультииндикаторную матрицу подтверждения, включающую MACD, скользящие средние, RSI, стохастик и MFI для точного выбора момента входа. Советник адаптируется к рынку, а не принуждает сделки, применяя динамический трейлинг-стоп на основе ATR для удержани
Emotions are a weakness. QHO mathematics is the future of your trading! You know what really truly frustrating?  Information garbage and noise. All those legacy, lagging indicators on the charts look like an attempt to steer a rocket ship with a steam engine. They are useless. They look at the past while the market is already flying forward on next-gen tech. We created QHO. This is not just another indicator. This is pure mathematics crushing market chaos right on your chart. Imagine completely
!! FLASH SALE !!   Over 80% off !!     For ONE week only. Now only $47 - normally $297! >>>      Ends on 30 June 2023 - Don't miss it! Buy and Sell Alerts when price breaks out following strict price action. Sends Alerts – #On MT5 To Your Phone To Your Email Does not repaint . Works on any Forex pair, any timeframe. 10 Activations allowed so you are free from limitations >> MT4 Version Here For spreads from a tiny 0.1pip RAW/ECN Accounts,  click here . Check out my Waka Esque EA signal here
Ultimate Double Top & Bottom (Pro Volume Matrix) Stop trading retail breakouts. Start trading Institutional Traps. The   Ultimate Double Top & Bottom   is not a standard, lagging pattern scanner. It is a highly advanced, non-repainting structural engine equipped with a proprietary   3-Leg Volume Matrix . Designed exclusively for Smart Money Concepts (SMC) and order flow traders, this indicator mathematically dissects the tick volume inside M and W patterns to reveal true institutional intent:  
ToolBox 360 is the swiss knife of all indicators. It is full packed with useful tools to help you with your trading. It can be used to find best entry and exit points and help you to decide if you should open a trade or not. It shows market trends, candlestick formations outside / inside bars and you can sett time based allerts. Main features: Time based Fibonacci lines Choose a start and end time and the indicator shows you Fibonacci lines within the selected time range including range high a
DS 2MV Candles Colors
Herminio Jesus Da Costa Machado
DS 2MV Candles Colors  Created by Hermínio Machado 2025 The DS 2MV Candles Colors indicator visually enhances your chart by coloring candles based on price position relative to two Smoothed Moving Averages (SMMA) . It’s designed to help traders quickly identify the current trend direction and potential neutral zones at a glance. How It Works The indicator plots two Smoothed Moving Averages (SMMA) — one based on the High and another on the Low price. Candle colors change according to wher
Нейросетевой индикатор со встроенной функцией обучения. Это настоящая автономная система искусственного интеллекта, использующая многоуровневый настраиваемый персептрон и расширенные настройки обучения для прогнозирования будущих изменений цен. Вы самостоятельно можете обучить индикатор на любом финансовом инструменте, все необходимое собрано в этом инструменте и удобно реализовано с автоматическим режимом и пресетами. Вышло крупное обновление v2.0 - 2.5. Расширенные возможности ввода: Добавлена
Monster Breakout Index V2 is a clean, visual momentum indicator engineered to spot potential breakout opportunities by evaluating extreme price extensions against median historical range channels. Overview The indicator continuously monitors the median price across a configurable lookback window and compares it against current high and low extremes. When price expansion breaks out of the established median bounds, MBI V2 immediately plots distinct histogram bars in a separate window, allowing tr
- simple Price Action Indicator - a  3 Candle Pattern (1. Direction-Candle / 2. the TRAP / 3. Trigger-Candle)    BUT every Signal needs ATTENTION to check for a clean Range - NON Lagging ! the Alert shows instantly whats happening - recommended SETUP is: - there is a VOLUME-Filter (in points for the   1. candle ) to avoid alerts with tiny Candles during a NON-VOLUME-Time - 10% off the Boobietrap-Candle as the ALERT-Level --> can easily be adjusted - user defined - recommended Timeframe: M30 (we
ARIPoint is a powerful trading tool designed to generate high-probability entry signals with dynamic TP/SL/DP levels based on price volatility. The integrated performance tracking function displays win/loss statistics, number of PP1/PP2 hits, and success rate, all updated in real time. Key Features: Buy/sell signals with adaptive volatility range Real-time TP/SL/DP levels based on ATR Integrated MA filter with ATR/StdDev volatility option. Performance statistics table (Success, Profit/Loss,
Smart Volatility Squeeze MT5 Smart Volatility Squeeze MT5 is a volatility compression and momentum expansion indicator for MetaTrader 5. It builds on John Carter's Volatility Squeeze framework and extends the usual single-tier squeeze into three compression tiers, so you can see not only whether the market is compressed but how tightly it is compressed before it expands. The indicator opens in a separate window and draws two elements: a linear regression momentum histogram and a row of coloured
In the context of trading, Malaysia SNR (Support and Resistance) refers to the technical analysis of support and resistance levels in financial markets, particularly for stocks, indices, or other assets traded. This is single timeframe version. Multiple timeframe version is avaiable here . There are three type of Malaysia SNR level Classic , GAP and Flipped 1. Classic Support is the price level at which an asset tends to stop falling and may start to rebound. It acts as a "floor" where demand is
Понимайте, где цена может искать ликвидность Liquidity Reaction Map MT5 — это индикатор рыночного анализа на графике, который определяет потенциальные области ликвидности на стороне покупателей и продавцов на основе подтвержденной ценовой структуры. Он объединяет свинговые точки, равные максимумы и минимумы, уровни предыдущего дня и недели, экстремумы торговых сессий и круглые цены в единую карту ликвидности. Близко расположенные уровни могут объединяться и ранжироваться по силе, расстоянию до ц
Moonshine Pivot Trend is a trend indicator for MT4 and MT5 whose trailing stop sits still for days at a time. On gold H1 it produced 153 signals in four and a half years, about 33 a year. If that sounds low, that's the argument I want to make before you look at a screenshot and decide something is broken. Most ATR trend tools centre their band on the current candle, so every new bar moves the anchor and a quiet stretch nudges you out of a trend that never broke. This one anchors to confirmed swi
Supertrend Volume Confirm
Isaac Alexander Pinero Garcias
DESCRIPTION Supertrend Volume Confirm — Trend Signals Confirmed by Volume and RSI Supertrend Volume Confirm is a buy/sell signal indicator based on the classic Supertrend, with two additional confirmation filters: volume and RSI. Unlike more complex multi-timeframe systems, this indicator works on a single timeframe, designed for traders who want something direct and easy to read. It works on any market symbol (forex, gold, indices, stocks, crypto) thanks to its default use of tick volume, unive
Индикатор Dorian - это интуитивный инструмент для определения текущего рыночного тренда. Он основан на простой визуализации в виде двухцветных линий, что делает его удобным для использования как начинающими, так и опытными трейдерами. Этот индикатор не только помогает определить направление тренда, но и служит ценным советником для принятия решений о входе в рынок или закрытии позиций. Благодаря своей простоте и эффективности, Dorian рекомендуется для трейдеров любого уровня опыта. Интерпрета
LZ Session Boxes PRO is a professional-grade tool for day traders, designed to beautifully visualize global trading sessions (Asia, Pacific/Sydney, London, New York) across your entire chart history. It eliminates the confusion of broker time offsets by automatically detecting timezones and adjusting for Daylight Saving Time (DST), ensuring your session boxes always align perfectly with real-market hours. Feature highlights - 4 Major Sessions: highlights Asian, Pacific (Sydney), London, and N
EAAV Visual Position Sizer is an advanced graphical utility for MetaTrader 5 designed to simplify visual trade management and accurately calculate position sizing before executing any order. The tool places interactive levels directly on your chart, allowing traders to quickly and intuitively adjust entry, protective stop, and target levels. Key Features: • Automatic Position Sizing: Automatically calculates the exact volume (lots) based on a fixed account risk percentage or fixed monetary am
LT Support Resistance — Автоматическое определение уровней поддержки и сопротивления на 100% Вы устали тратить время на ручное построение линий поддержки и сопротивления? Или расстраиваетесь из-за того, что постоянно упускаете важный уровень? Индикатор LT Support Resistance разработан для того, чтобы избавить вас от этой рутины: он автоматически определяет и отмечает наиболее значимые зоны вашего актива одновременно на нескольких таймфреймах. == УМНАЯ АВТОМАТИЗАЦИЯ КРИТИЧЕСКИХ УРОВНЕЙ == Вместо
The Range Filter Buy and Sell indicator is a trend-following technical analysis tool designed to identify optimal entry and exit points in the market. It filters out market noise by creating dynamic bands around price movements, generating clear buy and sell signals when price breaks through these bands. Key Features Dynamic Range Filtering : Uses a sophisticated algorithm to calculate adaptive bands that adjust to market volatility Trend Identification : Clearly visualizes the current trend dir
P A R Intelligence is a multi-strategy trading indicator designed for professional traders who demand precision, flexibility, and advanced market analysis. This powerful tool combines two proven trading methodologies into one seamless interface, providing institutional-grade support/resistance detection with intelligent breakout and pattern recognition systems. Why This Is Your Ultimate Trading Edge DUAL-STRATEGY ARCHITECTURE Choose between - or combine - two powerful trading approaches:
Этот мульти-таймфрейм и мультисимвольный индикатор сканирует пин-бары, утренние / вечерние звезды, поглощения, пинцет, трехлинейные удары, внутренние бары, а также вымпелы и треугольники.   Индикатор также можно использовать в режиме одиночного графика. Подробнее об этой опции читайте в разделе продукта.   блог .       В сочетании с вашими собственными правилами и методами этот индикатор позволит вам создать (или улучшить) вашу собственную мощную систему. Функции Может одновременно отслеживать в
Sonic R Pro Enhanced EA - Версия 2025 249$ только для первых 5 покупателей! Live Сигнал Проверьте реальную производительность Sonic R Pro Enhanced: Торговая стратегия Sonic R Pro Enhanced — это обновленная версия классической стратегии Sonic R, которая автоматизирует сделки на основе Dragon Band (EMA 34 и EMA 89) и использует усовершенствованные алгоритмы для максимальной эффективности. Таймфреймы: M15, M30 Поддерживаемые пары: XAUUSD, BTCUSD, AUDJPY, USDJPY Стиль торговли: Свинг-трейд
Alpha One MT5 — усовершенствованная система определения тренда Alpha One — это профессиональный индикатор следования за трендом, который предоставляет четкие сигналы на покупку и продажу с автоматическим входом, стоп-лоссом и тремя уровнями тейк-профита, нанесенными прямо на ваш график. Индикатор имеет уникальную визуализацию энергетического поля, состоящего из 15 динамических линий, которые переключаются между зеленым и красным цветом, отражая силу и направление тренда в режиме реального врем
【Super Scanner】Indicator Introduction : The color of the Super Scanner which is green and climbing up means that the price trend is going up.The color of the Super Scanner is red and going down means that the price trend is going down. It is very simple to use it to judge the market trend! What's even better is that the open parameters of the indicators allow investors to adjust. You can adjust【Super Scanner】according to your needs. Adjust it faster to be closer to short-term market fluctuatio
Paid release: Lorentzian ML Classifier Signals MT5 is a paid MetaCoderStore indicator. Use the product comments for setup questions, feature requests, and feedback for future updates. Lorentzian ML Classifier Signals MT5 is a closed-bar signal indicator inspired by the high-demand Lorentzian distance classification approach used by many TradingView traders. It compares the current market state against similar historical states using Lorentzian distance, then confirms the result with trend, kerne
Индикатор разработан на базе двухбуферной схемы, не требует никаких дополнительных настроек и может использоваться на любом финансовом инструменте без ограничений. Индикатор представляет собой известный ZigZag, но не перерисовывается и, как показывает практика, позволяет легко обнаруживать значимые уровни на графике цен, а также демонстрирует возможность определения вероятного направления движения цены. В качестве основы его расчета применены цены закрытия свечи, что делает его незаменимым помощ
С этим продуктом покупают
Trend Sniper X
Sarvarbek Abduvoxobov
4.9 (40)
Trend Sniper X — это трендовый индикатор для MetaTrader 5, работающий на нескольких таймфреймах, который помогает трейдерам точно и ясно определять направление тренда и потенциальные точки разворота. для MT4: https://www.mql5.com/en/market/product/193245 Информация о цене: Текущая цена является промо-ценой и может измениться по мере выхода предстоящих обновлений и новых функций. Бонусное предложение: Чтобы получить БЕСПЛАТНЫЙ авто-трейд советник Assistant EA для этого индикатора, пожалуйста, на
Smart Trend Trading System — MetaTrader 5 После покупки напишите мне на MQL5, чтобы БЕСПЛАТНО получить Smart Universal Expert Advisor, а также доступ к онлайн-курсу, руководство в формате PDF и доступ к закрытой группе. STTS объединяет направление тренда, сигналы входа и выхода, зоны разворота и важные ценовые уровни прямо на графике. Торгуйте по системе вручную или подключите отдельный совместимый советник для автоматического исполнения с выбранными вами настройками. ОДНА СИСТЕМА. ЧЕТЫРЕ ТОРГОВ
SuperScalp Pro
Van Minh Nguyen
4.66 (35)
SuperScalp Pro - Professional Multi-Layer Confluence Scalping System SuperScalp Pro — это продвинутый индикатор для скальпинга, который улучшает классический Supertrend с помощью нескольких интеллектуальных фильтров подтверждения. Он помогает определять торговые возможности Buy/Sell с более высокой вероятностью, значительно сокращая количество ложных сигналов. Чёткие стрелки Buy и Sell отображаются непосредственно на графике, а уровни Stop Loss и Take Profit на основе ATR автоматически рассчитыв
SMC Intraday Formula
VividMind Digital Solutions
5 (26)
Давайте сначала будем честны. Ни один индикатор сам по себе не сделает вас прибыльным. Если кто-то говорит вам обратное — он продаёт вам мечту. Любой индикатор, который показывает идеальные стрелки покупки/продажи, можно сделать безупречным — просто увеличьте нужный участок истории и сделайте скриншот успешных сделок. Мы так делать не будем. SMC Intraday Formula — это инструмент. Он считывает структуру рынка за вас, определяет зоны с наивысшей вероятностью движения цены и точно показывает, как
Gann Made Easy   - это профессиональная, но при этом очень простая в применении Форекс система, основанная на лучших принципах торговли по методам господина У.Д. Ганна. Индикатор дает точные BUY/SELL сигналы, включающие в себя уровни Stop Loss и Take Profit. ПОЖАЛУЙСТА, СВЯЖИТЕСЬ СО МНОЙ ПОСЛЕ ПОКУПКИ, ЧТОБЫ ПОЛУЧИТЬ ТОРГОВЫЕ ИНСТРУКЦИИ И ОТЛИЧНЫЕ ДОПОЛНИТЕЛЬНЫЕ ИНДИКАТОРЫ БЕСПЛАТНО! Вероятно вы уже не раз слышали о торговли по методам Ганна. Как правило теория Ганна отпугивает от себя не только
Новый король в городе — Индикатор + управление ордерами (TP1 + TP2 + TP3) + опциональный Telegram-сигнал-сендер ВКЛЮЧЁН (БЕСПЛАТНО) (ПОЛНОЦЕННАЯ ТОРГОВАЯ И СИГНАЛЬНАЯ СИСТЕМА) Gold Slayer EA Этот индикатор включает в себя продвинутую стратегию, торговую систему с настраиваемым управлением ордерами и систему mean reversion, которая сочетает расширения Envelope и поддерживается несколькими интеллектуальными фильтрами подтверждения, такими как RSI, для поиска высоковероятных точек разворота с сигн
ARIPoint
Temirlan Kdyrkhan
1 (4)
ARIBot is a powerful trading companion designed to generate high-probability entry signals with dynamic TP/SL/DP levels based on volatility. Built-in performance tracking shows win/loss stats, PP1/PP2 hits, and success rates — all updated live. Key Features: Buy/Sell signals with adaptive volatility bands Real-time TP/SL/DP levels based on ATR Built-in MA Filter with optional ATR/StdDev volatility Performance stats panel (Success, Profit/Loss, PP1/PP2) Alerts via popup, sound, push, or email Cus
Auto Optimized SpeedAngle — это система векторизации импульса институционального уровня, которая исключает подгонку под исторические данные (curve-fitting) за счет непрерывной форвард-оптимизации (Walk-Forward Optimization, WFO). Вместо того чтобы полагаться на статические входные параметры, которые теряют эффективность при смене рыночных режимов, индикатор динамически перекалибрует свои настройки, используя валидацию на вневыборочных данных (Out-of-Sample, OOS). Это гарантирует, что отображаемы
Neuro Poseidon - новый индикатор от Дарьи Резуевой. Он сочетает точные торговые сигналы с адаптивными уровнями TP/SL , в результате создавая максимально выгодные сделки! TO SWITCH TO   ENG   PLEASE CHOOSE IT IN THE UPPER-RIGHT CORNER OF THE WEBSITE Напишите мне и получите  Neuro Poseidon Assistant  в подарок для автоматизации вашей торговли! Что отличает его от других индикаторов? 1. Доказанная прибыльность на всех активах и таймфреймах 2. На графике присутствуют только подтвержденные сигналы н
Entry Points Pro — топ-1 индикатор по количеству отзывов (600 отзывов и 31 000 скачиваний обеих версий). Индикатор даёт самые перспективные точки входа в сделки без перерисовки на любых инструментах. Индикатор покажет заранее стрелкой точку входа в сделку, укажет цену входа и нарисует на графике уровень входа и стопа, а так же рассчитает рабочий лот под твой депозит и риск, а панель статистики поможет выбрать самый перспективный инструмент и таймфрейм .  Тебе остаётся поставить отложенный ордер
FiboSniper Pro – Multi-Filter Fibonacci System with Auto SL/TP and Control Panel FiboSniper Pro — это технический индикатор, который объединяет динамические Fibonacci Envelopes с несколькими фильтрами подтверждения для формирования отборных сигналов Buy и Sell. Уровни Fibonacci рассчитываются на основе Moving Average и ATR, а затем фильтруются с помощью ADX, EMA, RSI, ATR, Volume, Time и структуры свечи. Индикатор отображает на графике автоматические уровни Stop Loss и Take Profit на основе ATR,
Welcome to ENTRY IN THE ZONE AND SMC MULTI TIMEFRAME  SPECIAL BENEFIT / FOR OUR MQL5 CUSTOMERS FREE ACCESS TO THE NEW TOOL  — COMING SOON — Learn more on our official website  : https://www.fableedge.net Entry In The Zone and SMC Multi Timeframe is a real-time market analysis tool based on Smart Money Concepts (SMC) , designed to analyze market structure, price direction, and key trading zones. It supports both Single-Timeframe and Multi-Timeframe Analysis , providing a clearer view of overall m
Unix Scalper — MetaTrader 5 После покупки напишите мне на MQL5, чтобы БЕСПЛАТНО получить Smart Universal Expert Advisor, а также доступ к онлайн-курсу, руководство в формате PDF и доступ к закрытой группе. Найдите торговую ситуацию. Оцените план. Выберите способ торговли. UNIX Scalper объединяет анализ рынка, решения BUY/SELL/WAIT и уровни Entry, Stop Loss, TP1 и TP2 в одной удобной панели. УВИДЬТЕ СИГНАЛ И ТОРГОВЫЙ ПЛАН • Понятные решения: BUY, SELL или WAIT. • Определённые уровни: Entry, Stop
M1 SNIPER   — это простая в использовании торговая система. Это стрелочный индикатор, разработанный для тайм фрейма M1. Индикатор можно использовать как отдельную систему для скальпинга на тайм фрейме M1, а также как часть вашей существующей торговой системы. Хотя эта торговая система была разработана специально для торговли на M1, ее можно использовать и с другими тайм фреймами. Первоначально я разработал этот метод для торговли XAUUSD и BTCUSD. Но я считаю этот метод полезным и для торговли на
Индикатор Tokyo Indicator обеспечивает наглядное представление о направлении тренда, потенциальных торговых сигналах и текущей рыночной ситуации. Его ступенчатая линия тренда с цветовой индикацией позволяет различать «бычьи» фазы (выделены синим цветом) и «медвежьи» фазы (выделены пурпурным цветом). Соответствующие стрелки указывают на возможные точки входа в рынок (покупку или продажу) при смене тренда. Встроенная информационная панель объединяет данные о текущем сигнале, рыночном настроении,
FX Trend NG: Следующее поколение интеллектуального анализа трендов на разных рынках Обзор FX Trend NG — это профессиональный инструмент анализа трендов и мониторинга рынка с поддержкой нескольких таймфреймов. Он позволяет за секунды получить полное структурное понимание текущего состояния рынка. Вместо переключения между десятками графиков вы мгновенно видите, какие инструменты находятся в тренде, где импульс ослабевает и где наблюдается сильная синхронизация между таймфреймами. Специальное пр
Adaptive Price Action Engine Купи индикатор — получи советник (EA) к нему бесплатно Самооптимизирующийся мульти-таймфреймовый анализ тренда и свечных моделей Рынок постоянно меняется — и не каждая модель Price Action имеет одинаковую ценность в разных рыночных режимах. Adaptive Price Action Engine создан для адаптации к изменяющимся рыночным условиям, объединяя трендовую структуру, мульти-таймфреймовый анализ, свечные модели и статистическую оптимизацию в единой аналитической системе. Два адапти
Power Candles V3 — самооптимизирующийся индикатор силы Power Candles V3 преобразует силу валюты и инструмента в готовый к использованию торговый план на каждом графике, к которому он прикреплен. Вместо того, чтобы просто раскрашивать свечи, он выполняет автоматическую оптимизацию в режиме реального времени в фоновом режиме и предоставляет вам оптимальные значения Stop Loss, Take Profit и порог сигнала для выбранного вами символа. Один клик — и все готово для реальной торговли: на графике появляю
Scalper Vault   — это профессиональная торговая система, которая дает вам все необходимое для успешного скальпинга. Этот индикатор представляет собой полную торговую систему, которую могут использовать трейдеры форекс и бинарных опционов. Рекомендуемый тайм фрейм М5. Система дает точные стрелочные сигналы в направлении тренда. Она также предоставляет вам сигналы выхода и рассчитывает рыночные уровни Ганна. Индикатор дает все типы оповещений, включая PUSH-уведомления. Пожалуйста, напишите мне пос
Atomic Analyst — MetaTrader 5 После покупки напишите мне на MQL5, чтобы БЕСПЛАТНО получить Smart Universal Expert Advisor, а также доступ к онлайн-курсу, руководство в формате PDF и доступ к закрытой группе. Atomic Analyst объединяет анализ ценового движения, направление тренда, сигналы входа и выхода, уровни Stop Loss и несколько уровней Take Profit прямо на графике. УВИДЬТЕ СИГНАЛ. ОЦЕНИТЕ ТОРГОВУЮ СИТУАЦИЮ. Atomic Analyst представляет результаты анализа в понятном визуальном виде: • Стрелки п
FX Power: Анализируйте силу валют для более эффективной торговли Обзор FX Power — это ваш незаменимый инструмент для понимания реальной силы валют и золота в любых рыночных условиях. Определяя сильные валюты для покупки и слабые для продажи, FX Power упрощает принятие торговых решений и выявляет высоковероятные возможности. Независимо от того, хотите ли вы следовать за трендами или предсказывать развороты с использованием экстремальных значений дельты, этот инструмент идеально адаптируется под
Каждый покупатель этого индикатора получает дополнительно Бесплатно: Авторскую утилиту "Bomber Utility", которая автоматически сопровождает каждю торговую операцию, устанавливает уровни Стоп Лосс и Тейк профит и закрывает сделки согласно правилам этой стратегии, Сет-файлы для настройки этого индикатора на различных активах, Сет-файлы для настройки Bomber Utility в режимы: "Минимум Риска", "Взвешенный Риск" и "Стратегия Выжидания", Пошаговый видео-мануал, который поможет вам быстро установить, н
Crystal Heikin Ashi Signals—Professional Trend & Signal Detection Indicator Advanced Heikin Ashi Visualization with Intelligent Signal System for Manual & Automated Trading Final Price: $149 ---------> Price goes up $10 after every 10 sales . Limited slots available — act fast . Overview User Guide PDF Crystal Heikin Ashi Signals is a professional-grade MetaTrader 5 indicator that combines pure Heikin Ashi candle visualization with an advanced momentum-shift detection system. Designed for both m
DayTrader PRO DayTrader PRO — это передовой торговый индикатор, сочетающий фильтр Лагерра (Laguerre Filter) Джона Элерса с мощным движком автоматической оптимизации. Вместо использования фиксированных параметров индикатор автоматически подбирает оптимальные настройки на основе недавних рыночных условий, что позволяет адаптироваться к изменяющейся волатильности без необходимости ручной корректировки. Индикатор генерирует четкие сигналы на ПОКУПКУ и ПРОДАЖУ, а также адаптивные уровни Stop Loss и T
Quant Direction — это инструмент трехмерного анализа рынка. Он обеспечивает полностью объективный, основанный на алгоритмах анализ рынка, одновременно вычисляя точные процентные отклонения по нескольким параметрам. Разработанный с использованием передовых инструментов моделирования на основе искусственного интеллекта и тщательно протестированный, алгоритм предназначен для интерпретации рынка с уникальной точностью. Он может анализировать любую валютную пару или финансовый инструмент на вашей пла
Btmm state engine pro
Garry James Goodchild
5 (4)
BTMM State Engine Pro by G-Labs — Beat The Market Maker indicator for MetaTrader 5. Asian session range, London and New York kill zones, level progression (L1/L2/L3), peak formation detection (PFH/PFL), entry signals, and a multi-pair scanner from one chart. Stop scanning charts one pair at a time. The State Engine tracks the BTMM daily cycle automatically — Asian box, room boundaries, level blocks, peak formations, and filtered entries — while the scanner dashboard shows level, peak status, d
SkyHammer Signal Pro Профессиональный трендовый индикатор без перерисовки с фиксированными уровнями Entry, SL и TP SkyHammer Signal Pro — это структурированный индикатор тренда и momentum, созданный для трейдеров, которым нужны четкие, зафиксированные и проверяемые торговые сигналы. Лучше всего он работает на младших таймфреймах, таких как M1 и M5 . Индикатор не пытается предсказывать вершины или основания рынка. Вместо этого он ожидает подтвержденную рыночную структуру, направление тренда, силу
ATSTRONG PRO: Индикатор Структуры Рынка и Пробоев Движок Обнаружения Пробоев | 5 Динамических Целей TP | Живая Панель Дашборда | Без Перерисовки Вводная Цена Текущая Цена: $59 — Цена увеличивается на $10 после каждых 10 продаж. ATSTRONG PRO — это передовой индикатор пробоев и институциональной структуры рынка, разработанный для MetaTrader 5. Он обнаруживает высоковероятные свинговые развороты, идентифицирует кластерные зоны накопления поддержки и сопротивления, а также сигнализирует о сломе с
Precision Spike Detector
Francisco Mandomo Simbine
5 (2)
Precision Spike Detector V3 – Institutional-Grade AI Trading System Attention: The price increases by US$50 for every 10 purchases.  Final price: US$599 Precision Spike Detector V3   is a   state-of-the-art, institutional-grade market analysis system   for   MetaTrader 5 , designed to detect   high-probability market movements   in synthetic indices such as   Boom, Crash, GainX, and PainX . After purchase, send me a private message to receive the optimized configuration files,  the installation
UZFX {SSS} Scalping Smart Signals v5.0 MT5 — это высокопроизводительный торговый индикатор без перерисовки, разработанный для скальперов, дейтрейдеров и свинг-трейдеров, которым требуются точные сигналы в режиме реального времени на быстро меняющихся рынках. Разработанный компанией (UZFX-LABS), этот индикатор сочетает в себе анализ ценового действия, подтверждение тренда и интеллектуальную фильтрацию для генерации высоковероятных сигналов на покупку и продажу, предупреждающих сигналов и возможно
Другие продукты этого автора
Footprint Matrix Pro turns your MetaTrader 5 chart into an order-flow footprint chart . Every column shows who traded at each price: aggressive buyers lifting the ask against aggressive sellers hitting the bid. It is built from the real tick history of your broker, and every number is recorded tick by tick from the market data. You can see absorption, exhaustion, imbalances and real displacement as they happen, inside the candle and not only after it closes. Five footprint modes (one click) Bi
Signal Verdict Pro reads the indicators that are already on your chart, finds the signal that just fired and gives it a verdict : does this signal have substance, or is it noise? Every signal gets a score from 0 to 100 from 17 scenario checks, the indicator's own track record on this chart and a live repaint test. You keep your indicators and your strategy. Signal Verdict Pro adds the second opinion: STRONG , VALID , WEAK or REJECT , with the reasons for and against the trade. Works with the i
Currency Velocity Matrix shows the strength of the 8 major currencies ( EUR, GBP, AUD, NZD, USD, CAD, CHF, JPY ), calculated from all 28 pairs . It also shows the rate of change : which currency is gaining strength the fastest and which one is losing it the fastest. Knowing which currency is strong is not enough. A strong currency may already be losing momentum. The best opportunities usually appear when the currency gaining strength the fastest meets the currency losing strength the fastest . T
Market Maker Cycle Matrix shows the daily market maker cycle on your MetaTrader 5 chart. The Asian session builds a range. The London open often runs the stops on one side of it. Then the real move starts, room after room, until the market maker reaches the target and the cycle turns. The indicator tracks this cycle for you: the Asian range , the kill zones , the level count L1 / L2 / L3+ , the peak formation that turns the cycle, and five M15 entry types with entry, stop loss and two targets. A
Gold Killzone Sweep Matrix trades the most famous ICT idea for gold. Every kill zone (Asia, London, New York) leaves a high and a low . Stop orders sit beyond them, and that is liquidity . Smart money takes this liquidity (the sweep ) and then turns the market (the change of character, CHoCH ). Most kill zone indicators only draw the lines and leave the rest to you. This one does the whole job. It finds the sweep, confirms the CHoCH and prints a buy or sell arrow with entry, stop loss and target
Triple Edge Prop – three rule-based NASDAQ-100 intraday strategies in one Expert Advisor. Each engine has its own logic, its own magic number, its own timeframe and its own trading window. Together they cover three different market situations: a volatility breakout , an institutional VWAP pullback and an overnight bias breakout . Built for prop-firm challenges and funded accounts, with a full challenge guard on board. Why three strategies instead of one? A single strategy goes through losing
Momentum Decoupling Scalper turns a popular 1-minute scalping method for gold into clear, non-repainting signals. A signal on the 15-minute chart arms the setup, the first momentum candle on the 1-minute chart is the entry, and every trade comes with a stop loss, three targets (TP1 / TP2 / TP3) and an automatic break-even . The part most traders skip is the one that matters: the market must move on its own momentum against the US dollar . The indicator measures the dollar for you (the broker's d
Trend Exhaustion Radar answers one question that every trader asks in a strong move: is this trend running out of strength? Instead of watching three oscillators at the same time and missing the moment, the indicator reads DI+ / DI-, ADX and RSI for you, finds the classic warning signs - extreme zones, divergences, ADX hooks - and combines them into one traffic light with a rule score from 0 to 6. You get three windows in one product: the price chart with a 9/21 EMA cloud, warning markers and di
Фильтр:
Нет отзывов
Ответ на отзыв