CVD divergences
- Indicators
- Version: 2.20
- Activations: 10

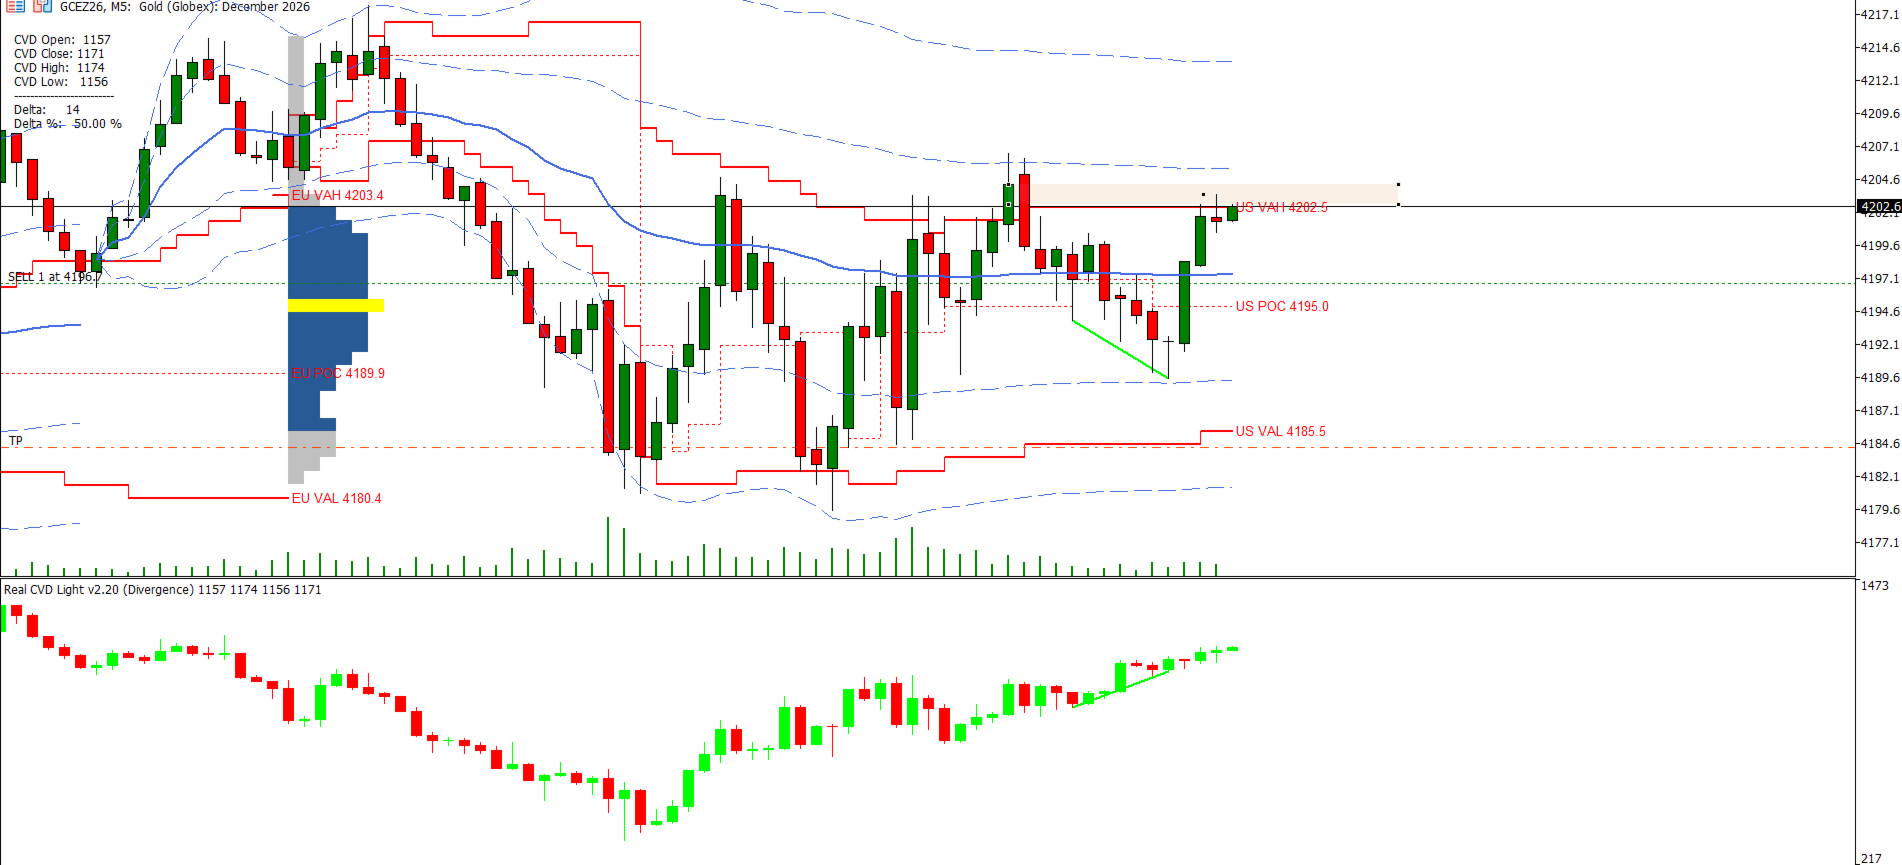
Real CVD Light plots Cumulative Volume Delta as candles (Open / High / Low / Close) in a separate window. It is built tick by tick from real trade data, and it detects divergences between price and CVD.
What it does
- Builds CVD candles from real tick flags (BUY / SELL) and real trade volume.
- Updates incrementally on every tick, so the live candle stays fast and accurate.
- Detects confirmed pivots on price (fractal highs and lows) and compares them with the CVD at the same pivots.
- Finds four types of divergence:
- Regular bearish: price makes a higher high, CVD makes a lower high (possible reversal).
- Regular bullish: price makes a lower low, CVD makes a higher low (possible reversal).
- Hidden bearish: price makes a lower high, CVD makes a higher high (possible continuation).
- Hidden bullish: price makes a higher low, CVD makes a lower low (possible continuation).
- Draws the divergence lines on both the price chart and the CVD window (solid for regular, dashed for hidden).
- Shows a small panel with the CVD values, the Delta and the Delta %.
Alerts
Pop-up, push notification, sound and e-mail. Each pivot alerts only once, and the divergence check runs once per closed bar, not on every tick.
Inputs
- Daily CVD reset on or off.
- Pivot confirmation bars (left and right).
- Maximum lookback and minimum spacing between pivots.
- Regular and hidden divergences can be enabled separately.
- Line drawing on or off.
- Each alert channel and the sound file can be set individually.
- The info panel can be shown or hidden.
Requirements – please read
- The indicator needs symbols that provide real trade data with BUY/SELL tick flags, such as futures from an exchange feed. On symbols without these flags (most spot forex feeds), the CVD stays flat and the panel shows a warning.
- Full tick history must be available for the symbol. It is downloaded by the terminal on demand, so allow time for it on first load.
- It works on any timeframe. Lower timeframes read more tick data, so the initial load takes longer.
Notes
- Divergences are analysis tools and not trading signals. Use them with your own risk management.
- The indicator does not place trades.