Footprint Edge
- Indicators
- Version: 2.34
- Updated: 12 September 2026
- Activations: 10

Footprint Visual
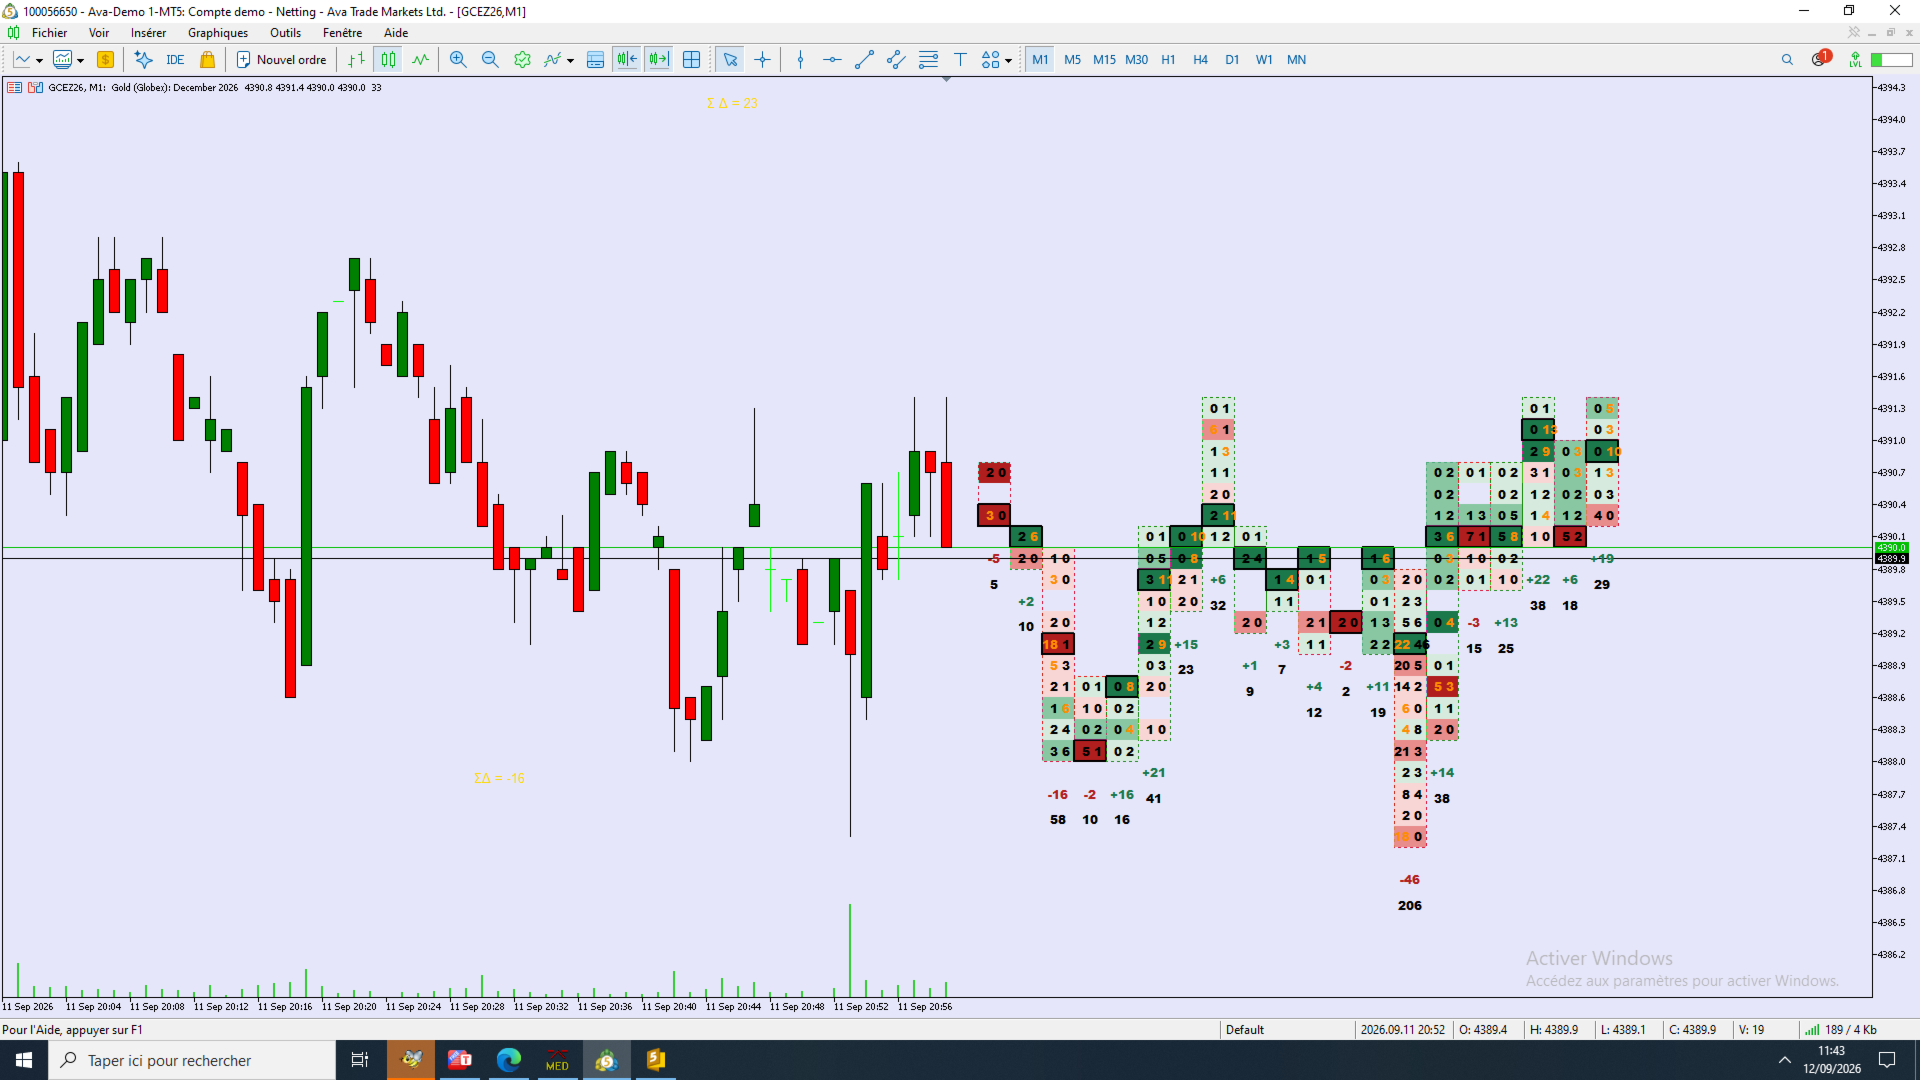
Order flow footprint chart, drawn directly in the main window, sharing the real price scale of your candles.
Short description (for the Market listing)
Footprint Visual draws a real bid/ask footprint — buy and sell volume per price level, POC, Value Area and net delta — for each of the most recent bars, right next to your candles. Built on genuine volume_real tick data (not tick-count approximations), it works on any symbol whose broker feed reports real trade volume, and is tuned for futures (Gold, Nasdaq, etc.).
Full description
Most footprint tools on MetaTrader either run in a separate sub-window disconnected from price, or fall back on tick-count volume that doesn't reflect real traded size. Footprint Visual solves both problems:
- It draws directly in the main chart window, at the real price of each level, so the footprint lines up naturally with your candles and with any Volume Profile or VWAP lines you already use.
- It uses CopyTicksRange with real trade flags ( TICK_FLAG_BUY / TICK_FLAG_SELL ) and volume_real , so the numbers reflect actual contracts traded, not synthetic tick counts.
- Every bar shows: buy volume (right) and sell volume (left) at each price level, the POC (point of control), the Value Area boundaries, and a net delta / total volume footer.
- Levels with a marked one-sided imbalance and levels showing absorption (high volume, balanced flow) are automatically highlighted, so you can read initiative vs. absorption at a glance.
- A dotted frame around each bar is colored by the bar's real direction (bullish/bearish), for an instant visual read before you even look at the numbers.
- An optional real-time mode keeps the currently forming bar live, refreshing on every tick instead of waiting for the bar to close.
- A vertical stretch control lets you space out price levels for readability on tight ranges, independent of your chart's price-scale zoom, without changing how volume is aggregated.
How to use it
- Attach it to a chart whose broker/feed reports real trade ticks with volume ( volume_real > 0) — this is standard for most futures/CFD feeds (e.g., CME/COMEX gold and index futures via CQG-type feeds). On feeds that only provide tick-count volume, the footprint will be sparse or empty.
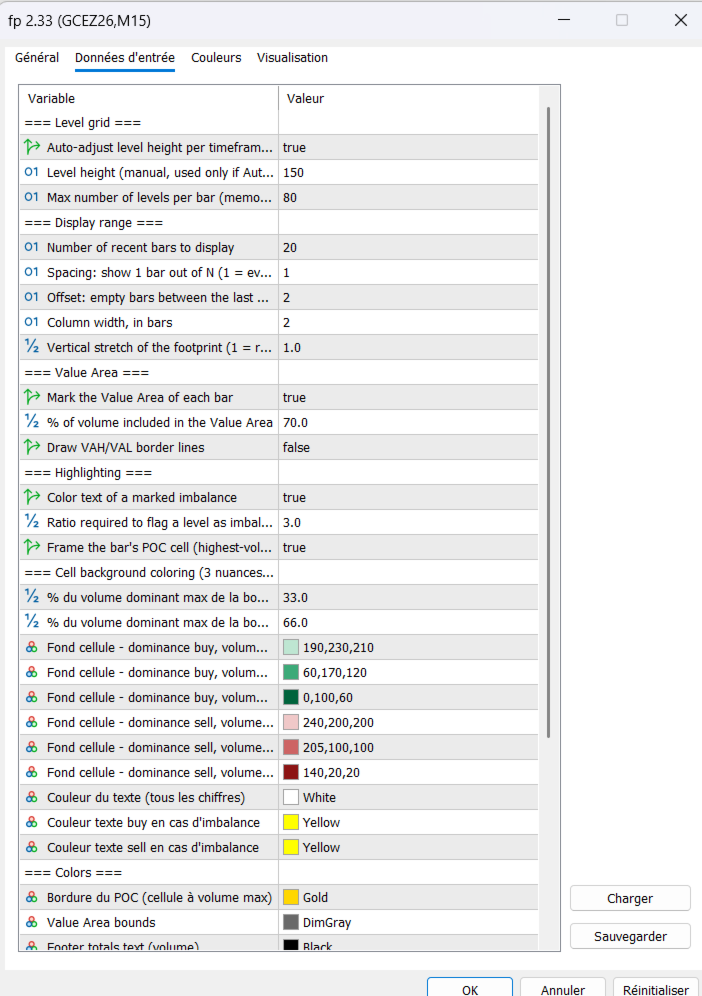
- Set the level height ( InpLevelTicks ): how many ticks each price row represents. Start with 2–5 ticks; increase it if your symbol's tick size is very small or if levels look too thin to read.
- Choose how many bars to display ( InpBarsToDisplay ) and how wide each footprint column should be ( InpColumnWidthBars ). Reduce the bar count if columns feel cramped, or widen the columns for more room around the numbers.
- Read each bar's footer: the top number is the net delta (buy volume − sell volume), the number below it is the total traded volume for that bar.
- Watch for highlighted levels:
- A level with one side much larger than its diagonal neighbor (colored buy/sell number) signals an imbalance — initiative passing through.
- A level framed in blue (by default) signals absorption — high volume with a balanced buy/sell split, i.e. a level that is holding against pressure rather than giving way.
- Check the POC line and Value Area (optional, off by default) to see where the bar's volume concentrated and whether price is trading inside or outside the prior value.
- Enable real-time mode ( InpRealTimeUpdate ) if you want the currently forming bar to update live, tick by tick, instead of only appearing once the bar closes.
- Use the vertical stretch ( InpVerticalStretch ) if your price levels are too tight to read even after zooming your chart's price scale — it spaces the footprint visually around each bar's center without changing the underlying tick aggregation.
Notes
- Footprint quality depends entirely on your broker/feed providing real trade ticks with volume_real . Test on your specific symbol before relying on it.
- The footprint reads best on lower/mid timeframes (M1–M15) where enough real trades occur per bar to build a meaningful volume distribution.
- All colors, thresholds and display parameters are configurable via inputs — nothing is hard-coded.