Volatility Pullback Radar
- Indicators
- Version: 1.3

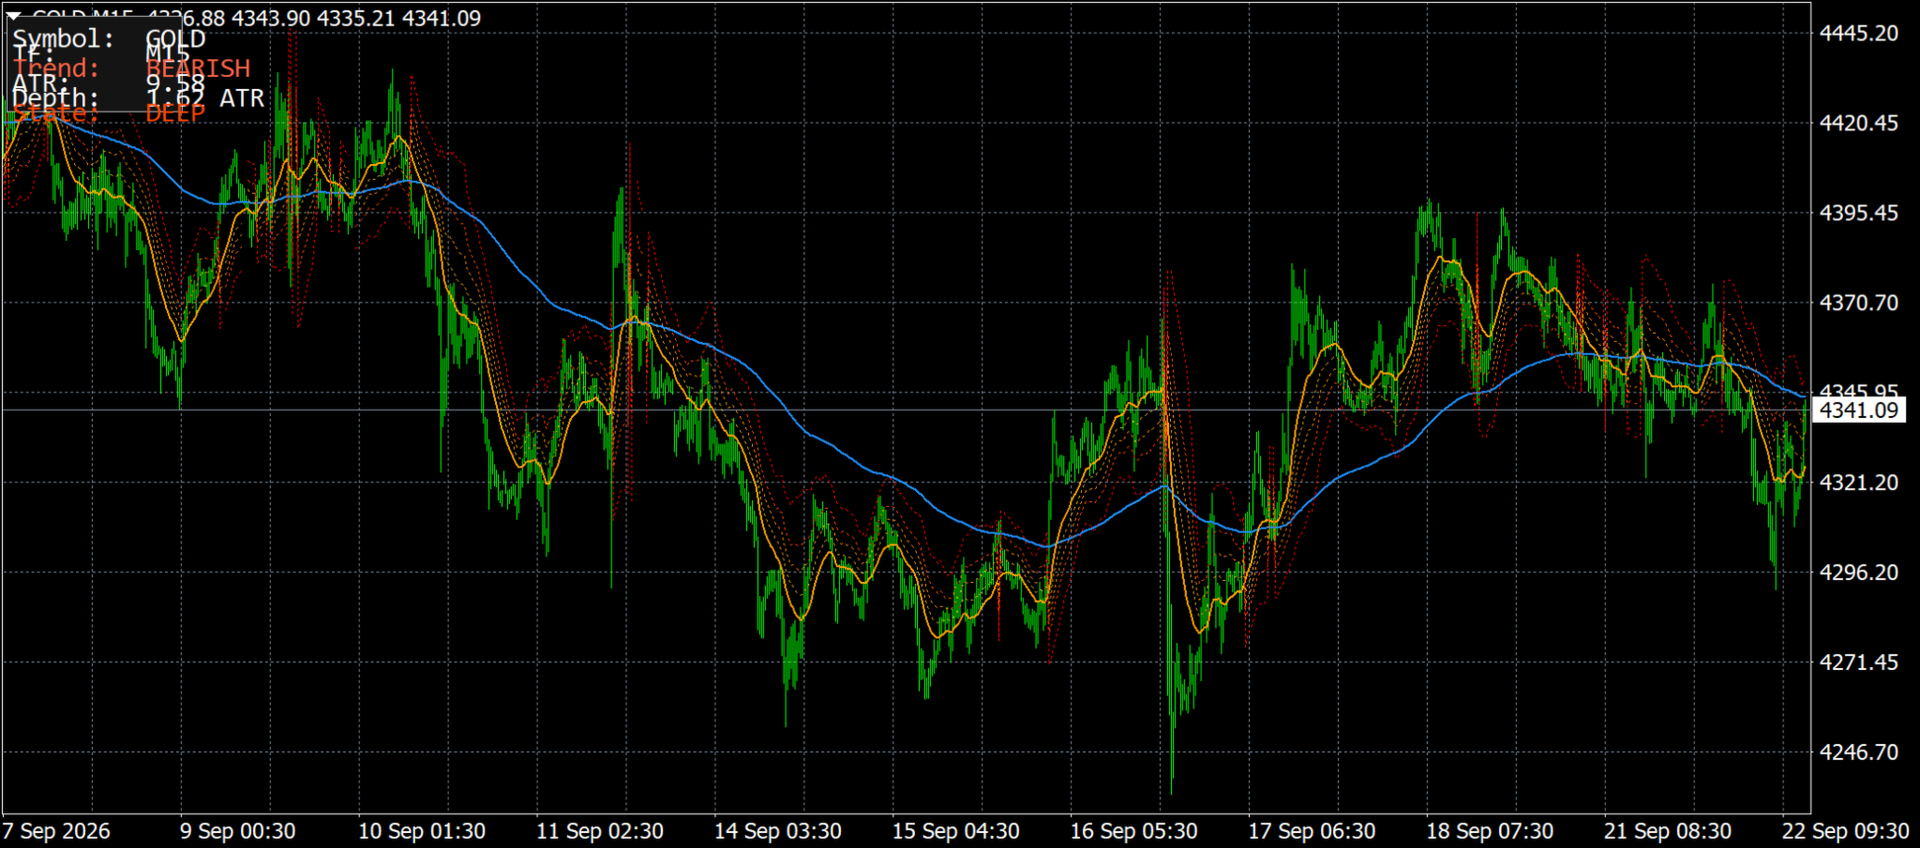
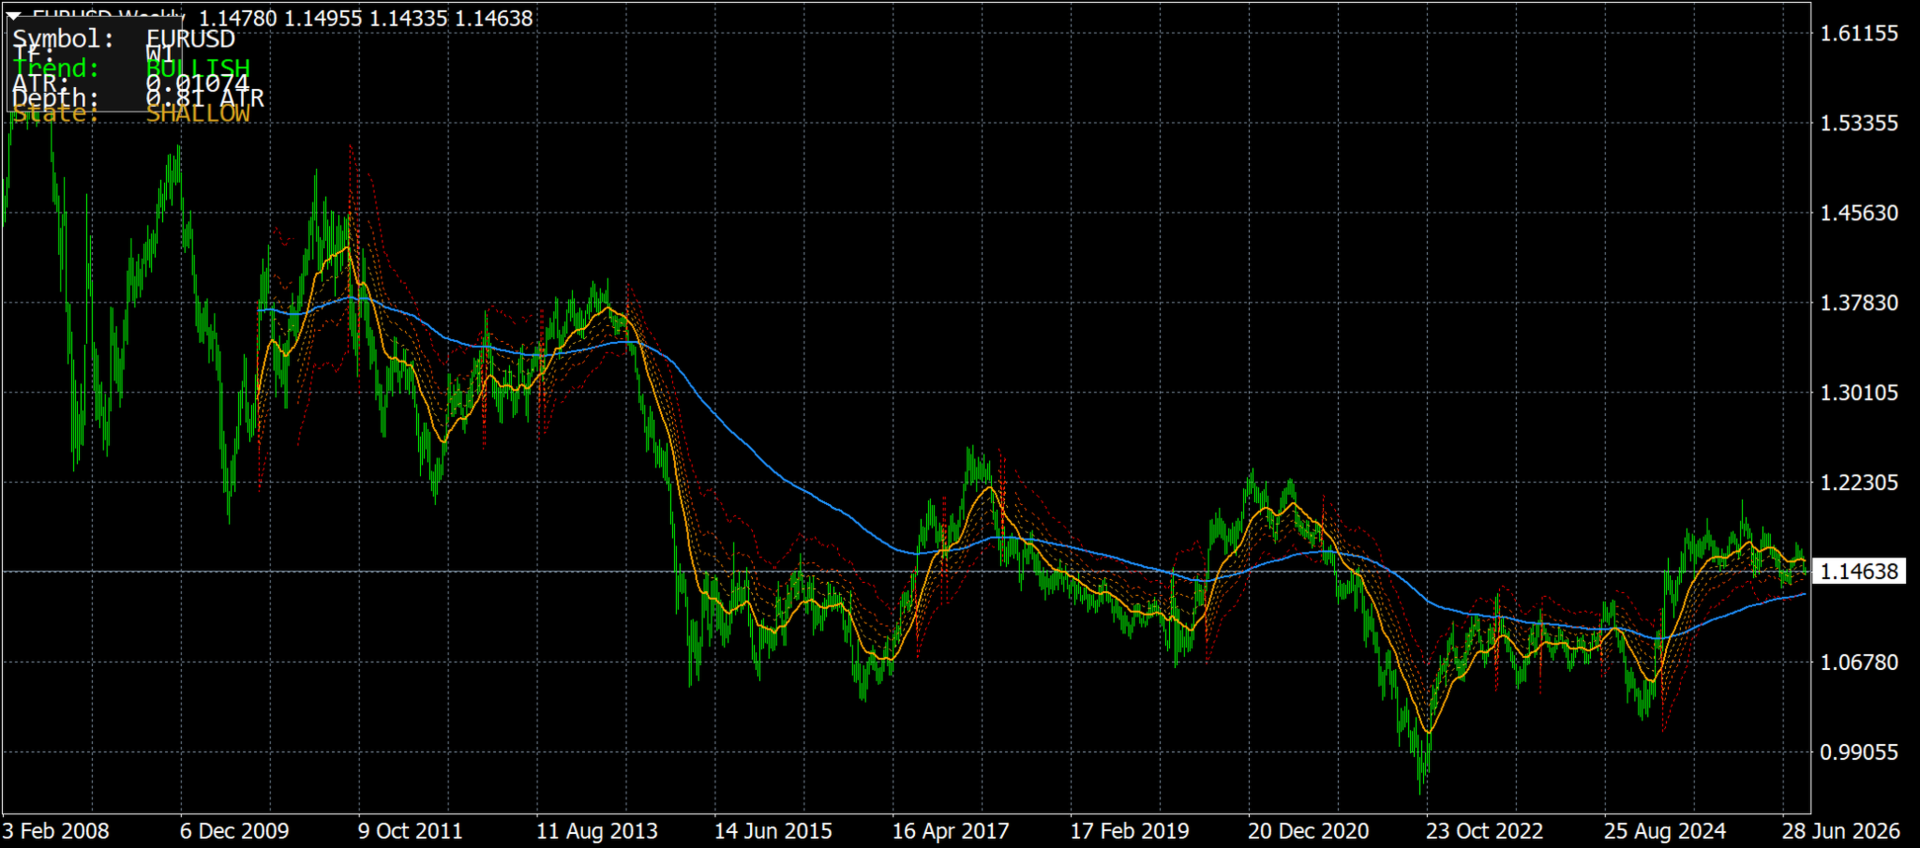
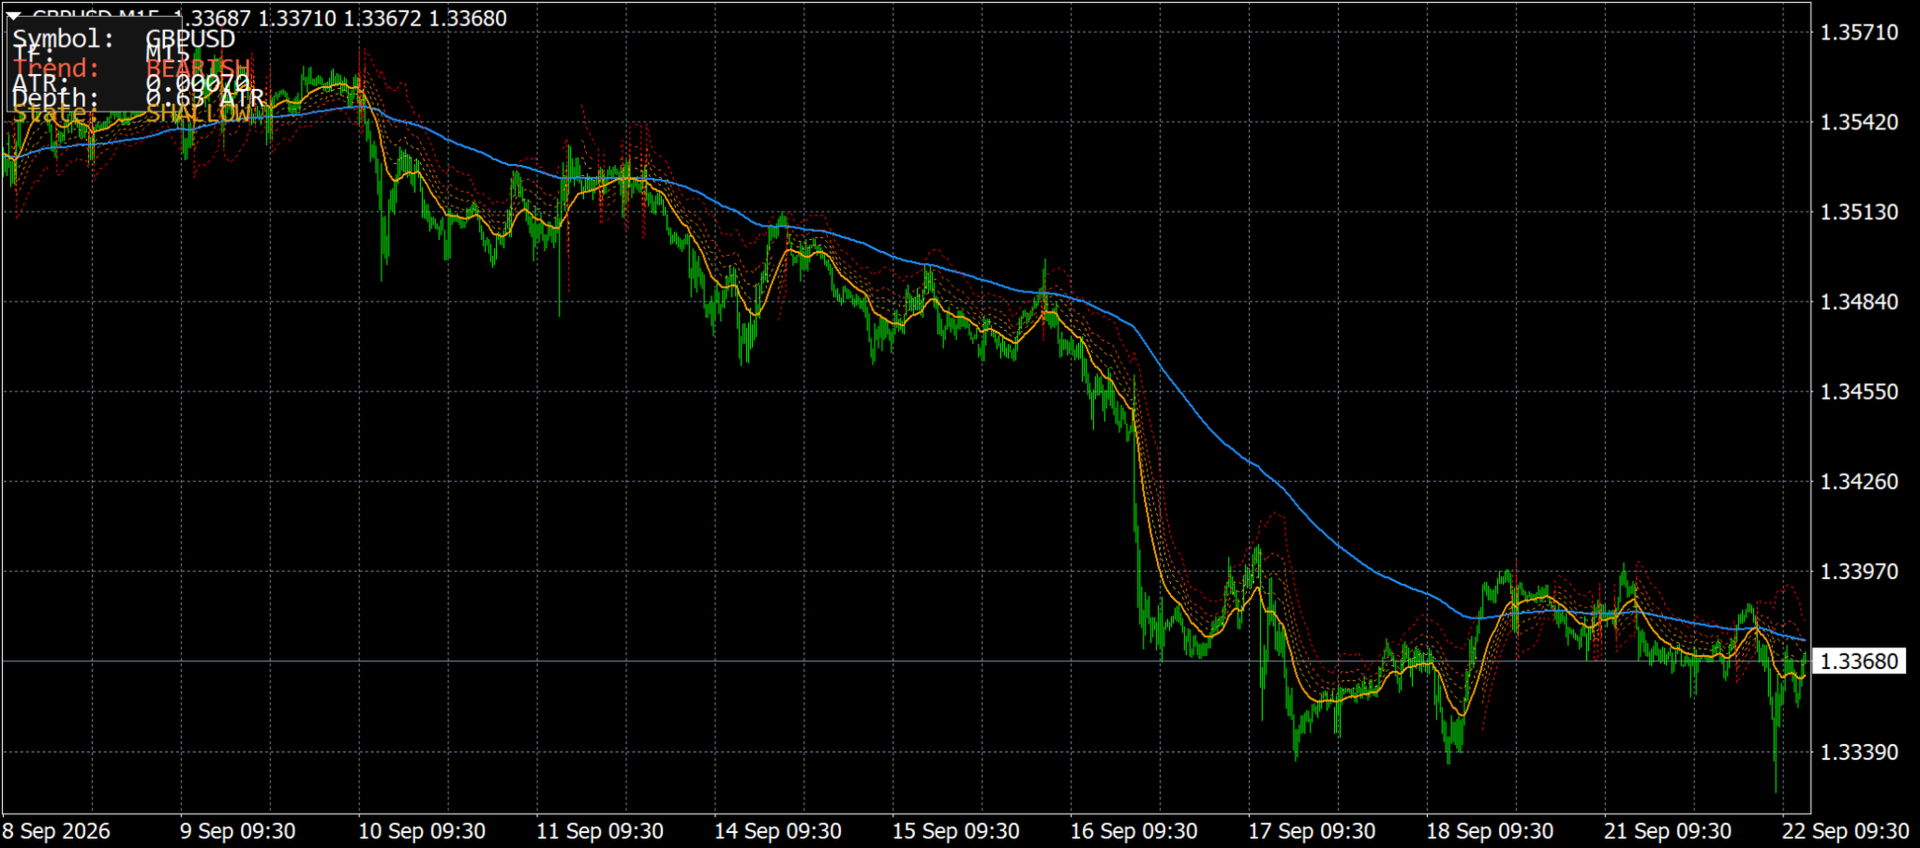
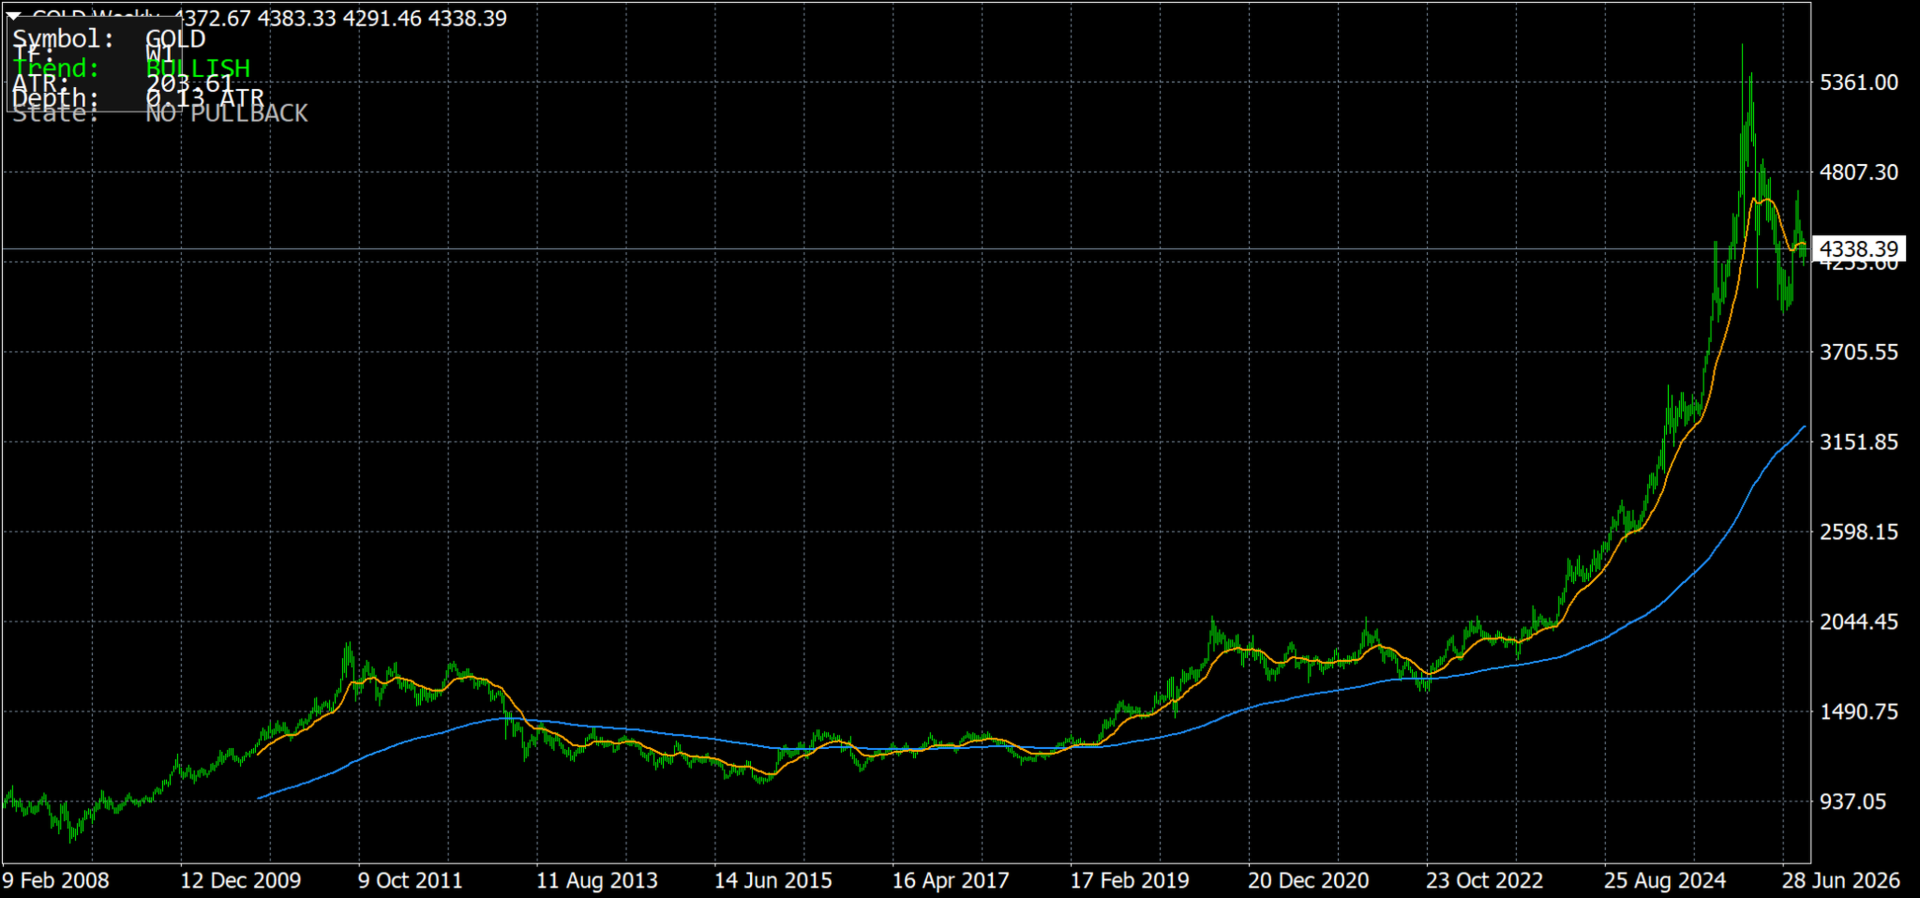
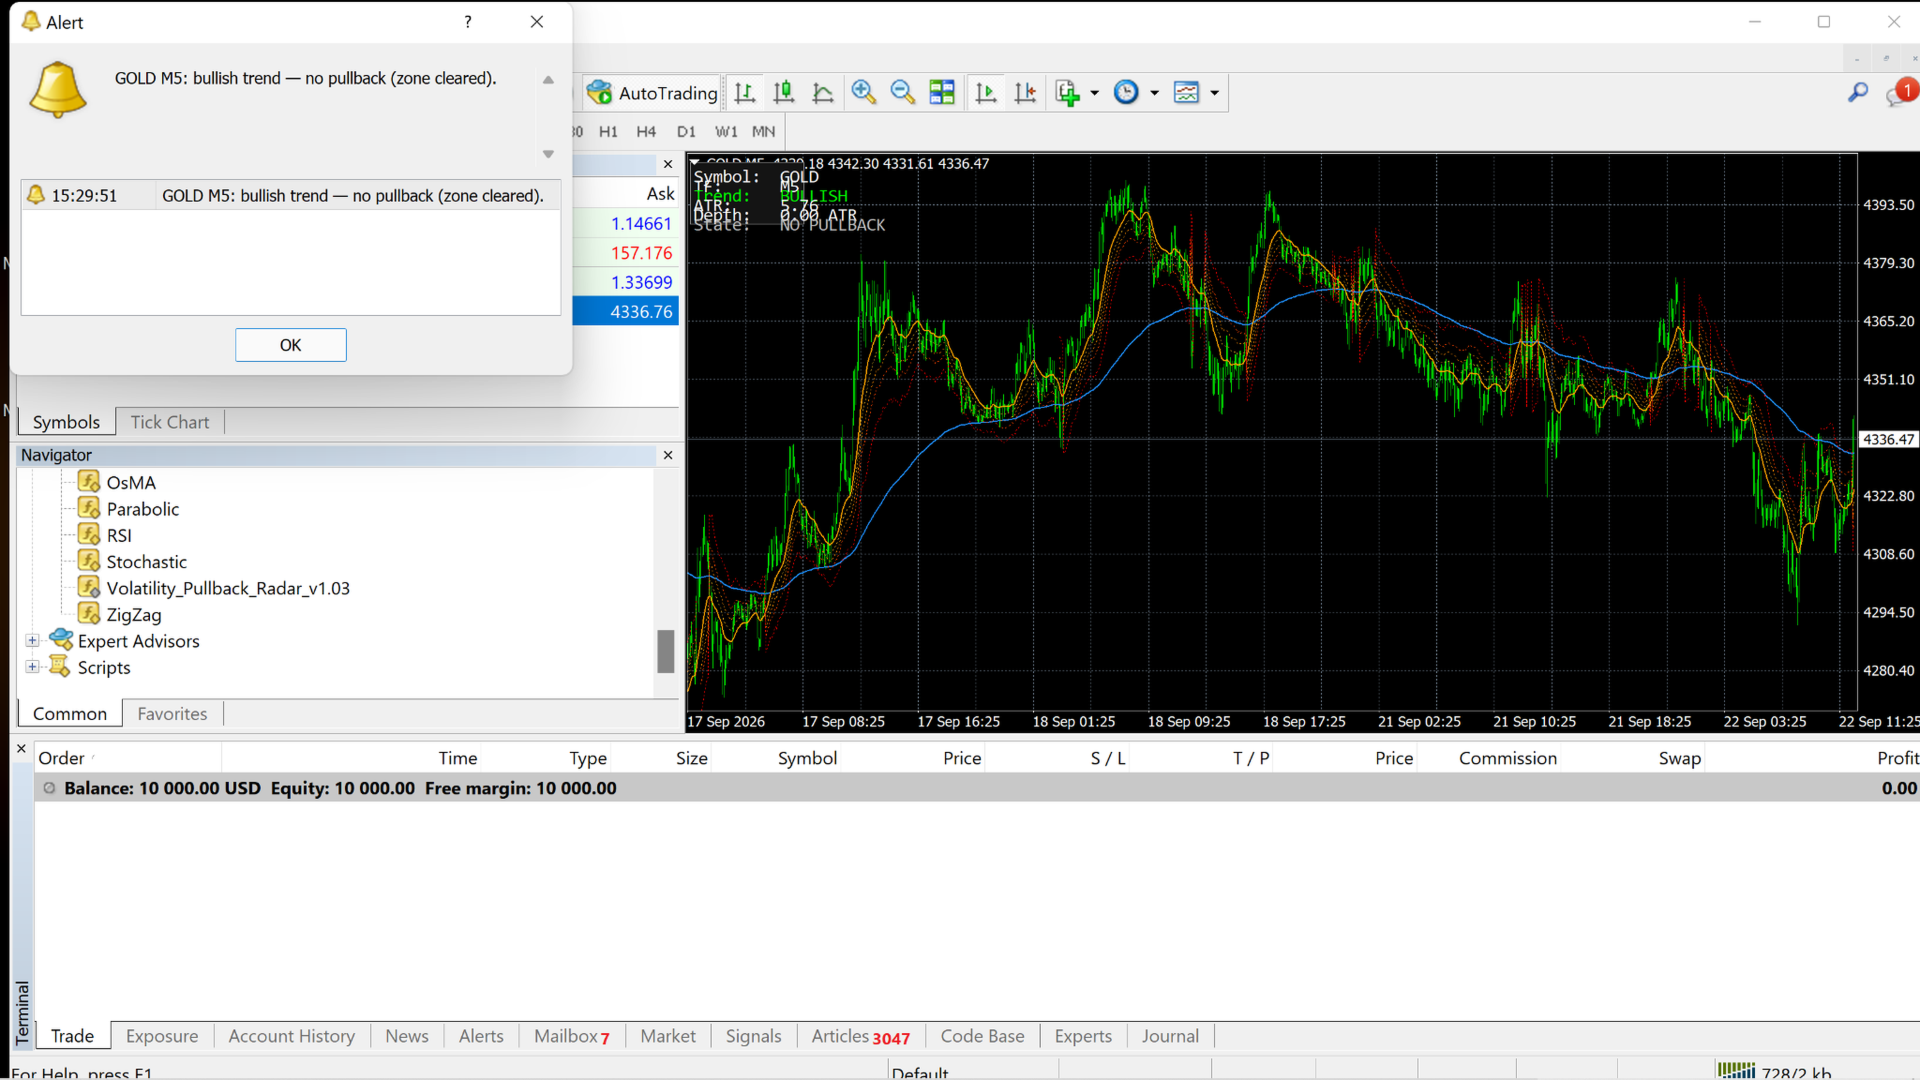
Volatility Pullback Radar is a chart indicator that shows the current broad trend and measures the depth of a pullback relative to current market volatility.
It works on the symbol and timeframe of the chart where it is attached.
The indicator does not open, close, or manage trades. It provides information about trend direction, pullback depth, and the current pullback state.
How it works
The indicator uses a long-term exponential moving average as the broad trend reference. The default period is 200.
A shorter exponential moving average provides the reference from which a pullback is measured. The default period is 20.
Average True Range measures current market volatility. The default period is 14.
When price is sufficiently above the long-term average, the trend is classified as Bullish.
When price is sufficiently below the long-term average, the trend is classified as Bearish.
A small volatility-adjusted area around the long-term average is classified as Neutral.
During a Bullish trend, the indicator measures downward movement from the shorter reference average.
During a Bearish trend, it measures upward movement from the shorter reference average.
The distance is compared with Average True Range so that pullback depth is measured relative to current volatility rather than only by raw price distance.
The indicator classifies the current condition as:
- No Pullback
- Shallow
- Normal
- Deep
- Extended
With the default settings, the Shallow, Normal, Deep, and Extended thresholds begin at 0.50, 1.00, 1.50, and 2.50 times Average True Range respectively.
All four thresholds can be changed in the indicator inputs.
During a Bullish trend, the pullback zones are plotted below the shorter reference average.
During a Bearish trend, the pullback zones are plotted above the shorter reference average.
The chart can also display the current symbol, timeframe, trend state, Average True Range value, pullback depth, and pullback classification.
Parameters
Trend Period
Period of the long-term exponential moving average. Default: 200.
Reference Period
Period of the shorter exponential moving average used as the pullback reference. Default: 20.
ATR Period
Period used to calculate Average True Range. Default: 14.
Price Type
Price type used for the moving average calculations.
Shallow Threshold
Minimum volatility-adjusted depth for the Shallow state. Default: 0.50.
Normal Threshold
Minimum volatility-adjusted depth for the Normal state. Default: 1.00.
Deep Threshold
Minimum volatility-adjusted depth for the Deep state. Default: 1.50.
Extended Threshold
Minimum volatility-adjusted depth for the Extended state. Default: 2.50.
Show Trend Average
Shows or hides the long-term trend average.
Show Reference Average
Shows or hides the shorter reference average.
Show Zones
Shows or hides the pullback zones.
Show Panel
Shows or hides the information panel.
Enable Alerts
Enables MetaTrader popup alerts.
Enable Push Notifications
Enables push notifications when they are configured in MetaTrader.
Enable Email Alerts
Enables email alerts when email is configured in MetaTrader.
Alerts and usage
Alerts are generated when the confirmed pullback state changes.
Alert calculations use the last closed bar rather than the current unfinished bar.
During a Bullish trend, downward movement is described as a pullback.
During a Bearish trend, upward movement is described as a rally.
Volatility Pullback Radar is an analytical tool. The displayed trend and pullback states describe the current chart condition. They are not instructions to enter or exit a trade.