Equity Atlas
- Indicators
- Version: 1.10
- Updated: 1 August 2026
- Activations: 10

Equity Atlas — Understand Your Trading History
Equity Atlas is a read-only account performance analytics indicator for MetaTrader 5. It turns closed trading history into a clear dashboard with cumulative curves, flexible filters, floating P/L records and detailed period statistics.
It is designed for discretionary traders, automated-system users, portfolio managers and anyone who needs to understand where account results come from. Equity Atlas never opens, closes or modifies orders.
◆ CORE ANALYTICS
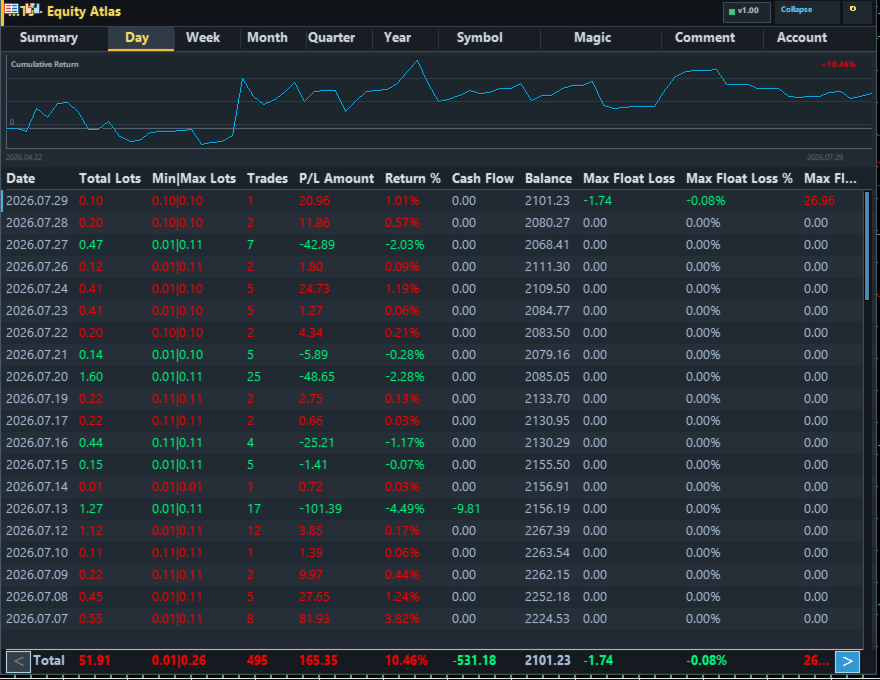
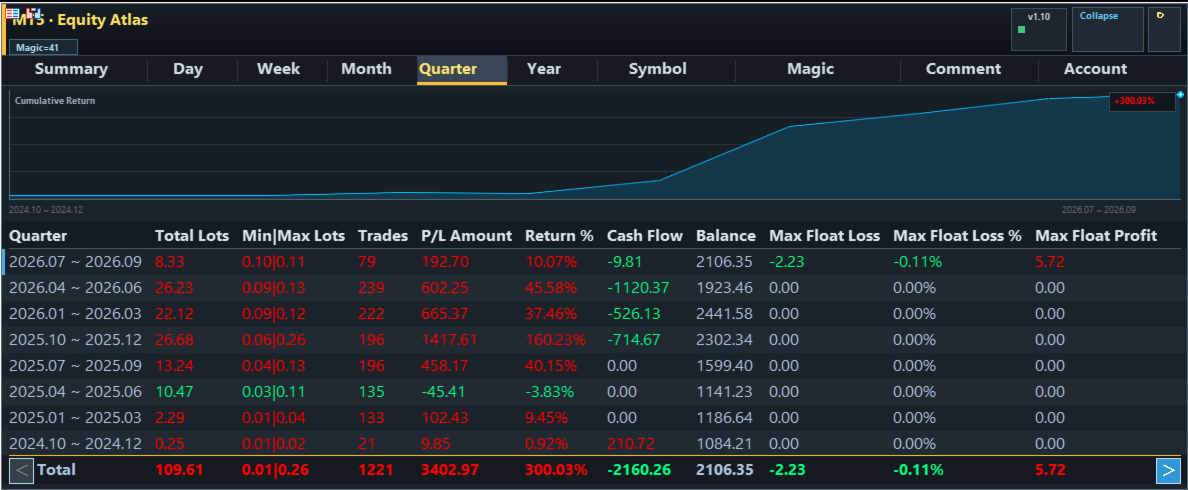
• Review Summary, Daily, Weekly, Monthly, Quarterly and Yearly results from one responsive panel.
• Period pages combine a cumulative curve with a detailed table and a fixed Total row.
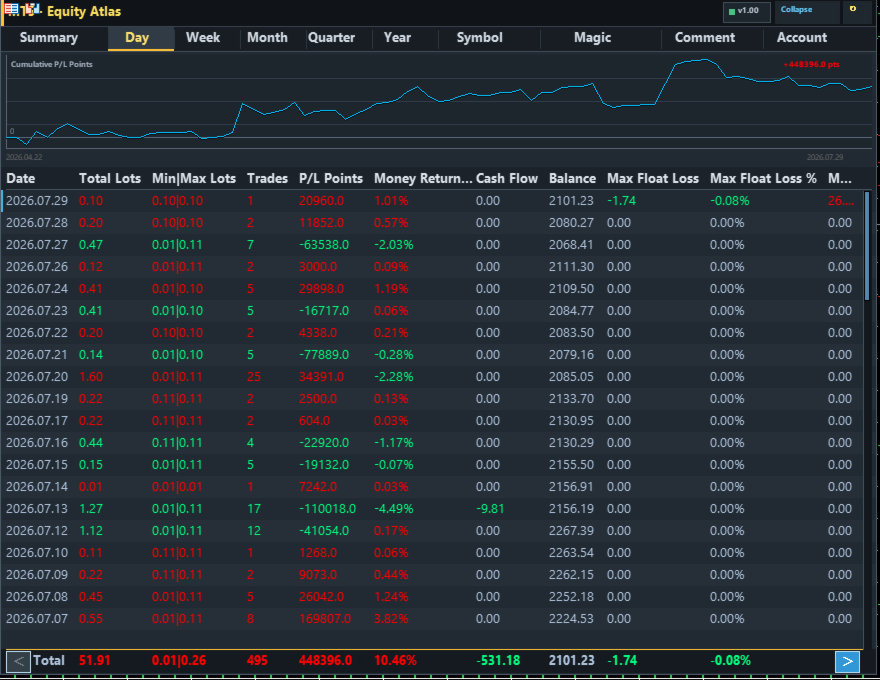
• Use the default account-currency mode or switch to profit-points mode.
• Choose points per closing deal, lot-weighted points or position-normalized points.
◆ FILTERS AND BREAKDOWNS
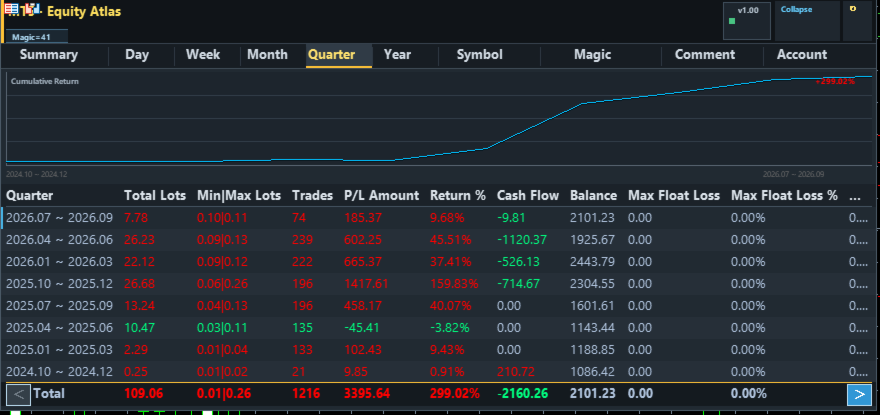
• Analyze all history or filter by start and end date, symbol scope, custom symbol list, one or more magic numbers, order comment and BUY/SELL direction.
• Every enabled filter is displayed at the top of the panel, so the current analysis scope is always clear.
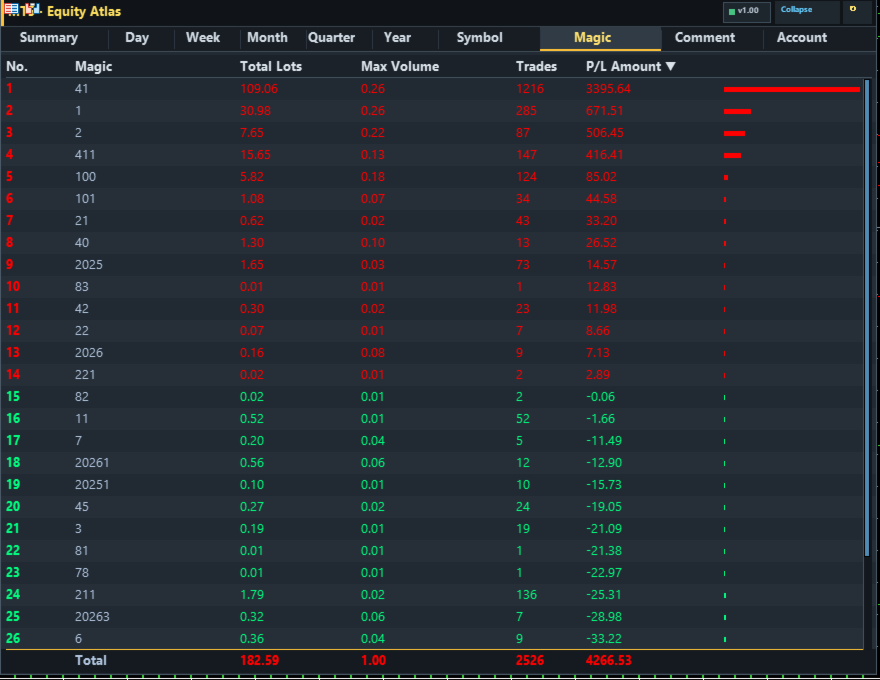
• Dedicated Symbol, Magic and Comment pages rank instruments and strategies with totals and proportional visual bars.
• Non-trade account adjustments such as charges or interest can be included when required.
◆ DETAILED TABLE, CASH FLOW AND RISK
• Use column presets or create a custom layout.
• Available data includes volume, trade count, P/L, return percentage, holding time, closing balance, BUY/SELL statistics, win rate and profit factor.
• Commission, swap, combined cash flow, deposits and withdrawals can be shown separately.
• Maximum floating loss and profit can be displayed as both amount and percentage.
◆ FLOATING P/L RECORDING
Equity Atlas records account floating P/L extrema in real time and stores them in the MetaTrader common-files area. Records are isolated by trading server, account and active filter scope. The recording and file-save intervals are configurable.
◆ RESPONSIVE WORKFLOW
• The panel adapts to the available chart width and height, including column widths and base font size.
• Long values stay inside their own columns and show the complete value in a tooltip.
• Table headers and the Total row remain fixed while long tables are scrolled.
• Use the mouse wheel for vertical browsing and the bottom arrow controls to move wide tables horizontally.
• Drag or collapse the panel, remember its position, keep it above chart objects and run multiple instances with separate IDs.
• Configure the refresh interval and an optional sound after data refresh.
◆ CHART TOOLS
Recent trade paths and pending-order levels can be displayed on the chart. Chart focusing is optional and disabled by default, so refreshing statistics does not unexpectedly move the chart.
◆ MULTILINGUAL INTERFACE
The interface can be displayed in English, Chinese, Russian, Spanish, Portuguese, Japanese, German, Korean, French, Italian or Turkish. Input names and the default interface are English.
◆ AVAILABLE PAGES
• Summary
• Day
• Week
• Month
• Quarter
• Year
• Symbol
• Magic
• Comment
• Account
◆ KEY INPUT GROUPS
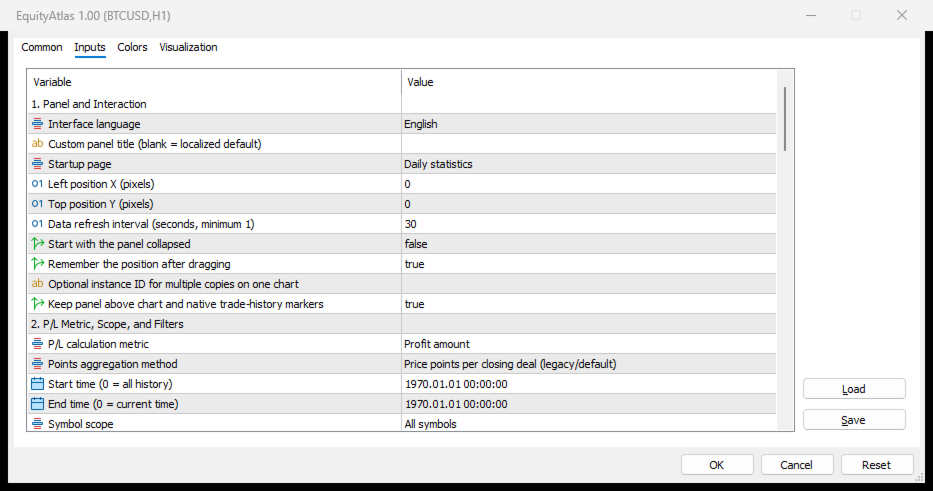
• Panel and interaction
• P/L metric, scope and filters
• Detail-table presets and analysis columns
• Cash flow and floating P/L display
• Floating P/L recording
• Period, summary and category pages
• Text and curve colors
• Chart trade markers and alerts
◆ QUICK START
1. Attach Equity Atlas to any MT5 chart.
2. Keep the default settings to analyze the complete account history in money mode.
3. Select a page from the top navigation bar.
4. Use the Inputs window when you need a date, symbol, magic, comment or direction filter.
5. Enable additional columns or select a ready-made table preset.
◆ IMPORTANT NOTES
• Equity Atlas is an analytical indicator and does not execute trades.
• Closed-trade statistics depend on the trading history available in the terminal.
• Floating P/L extrema are recorded only while the indicator is running and are not reconstructed from historical ticks.
• Return percentages are calculated from the reconstructed account balance associated with each period.
• Historical statistics do not guarantee future results.
Version 1.10 includes the complete responsive dashboard, money and points modes, isolated floating P/L recording, configurable filters, adaptive tables, multilingual display and optional chart markers.