Market Structure Mapper
- Indicators
-
Abdul Qadir Memon
 I am a software engineer and algorithmic trading tools developer with 20+ years of professional experience in software development, automation, cloud applications, and trading technology.
 - Version: 1.85
Market Structure Mapper
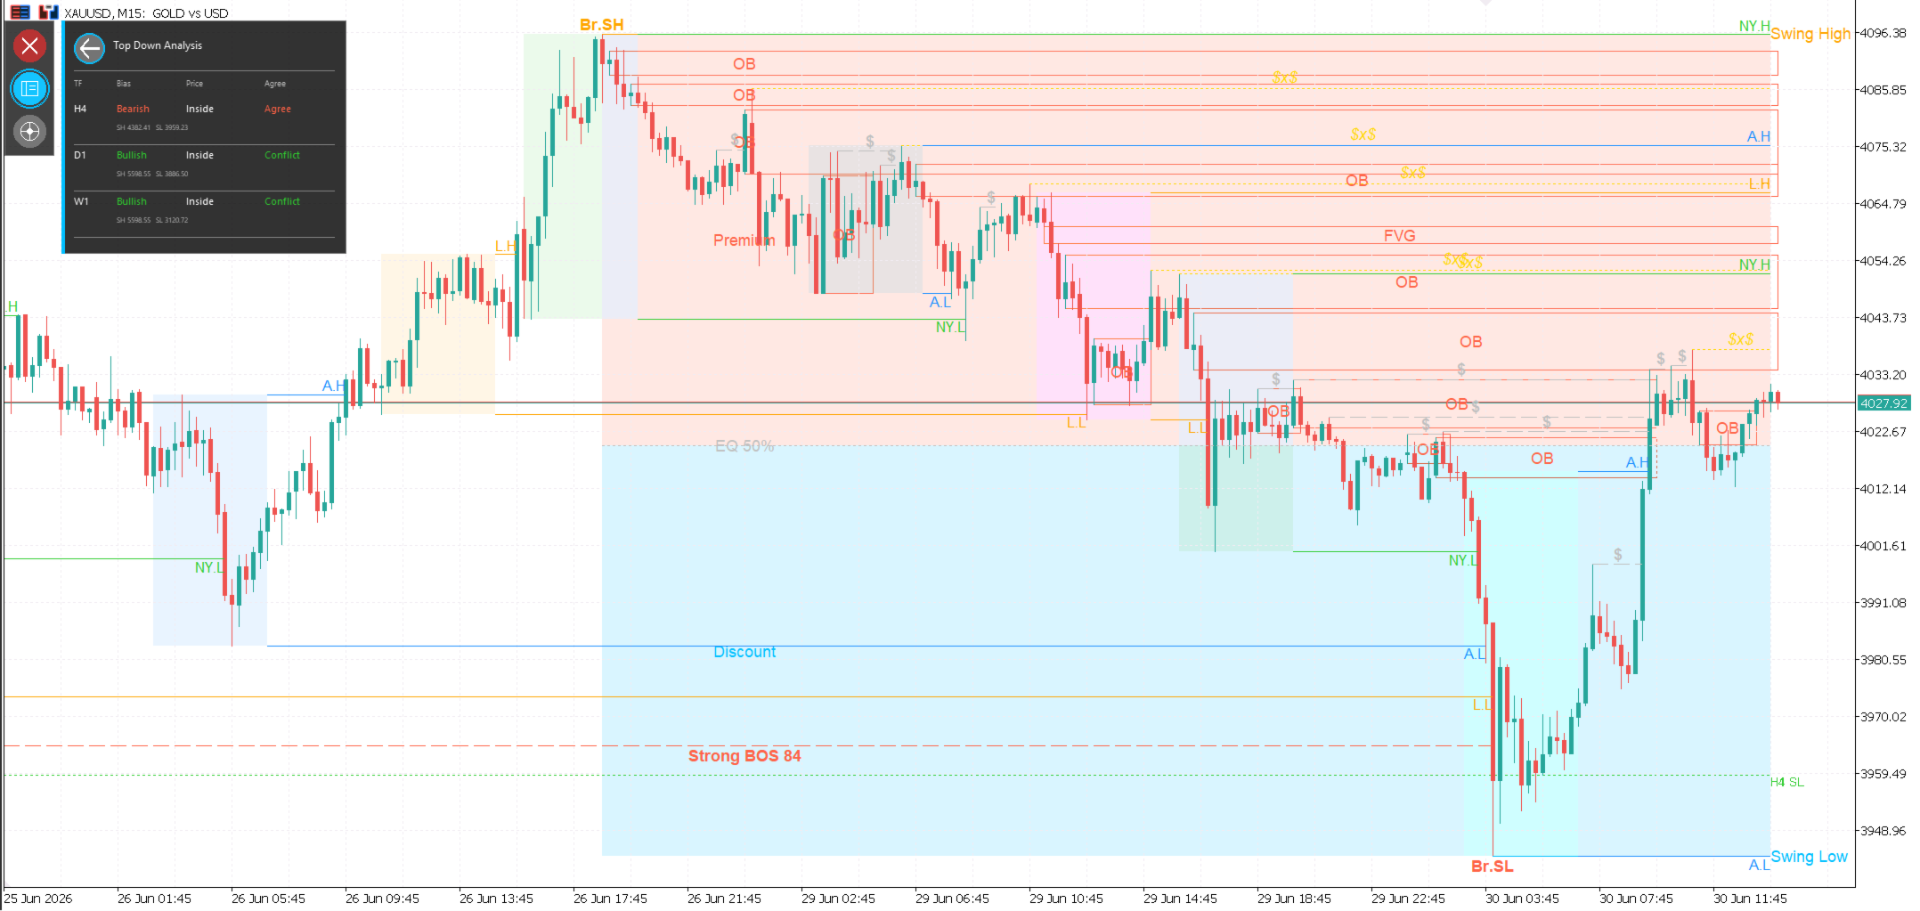
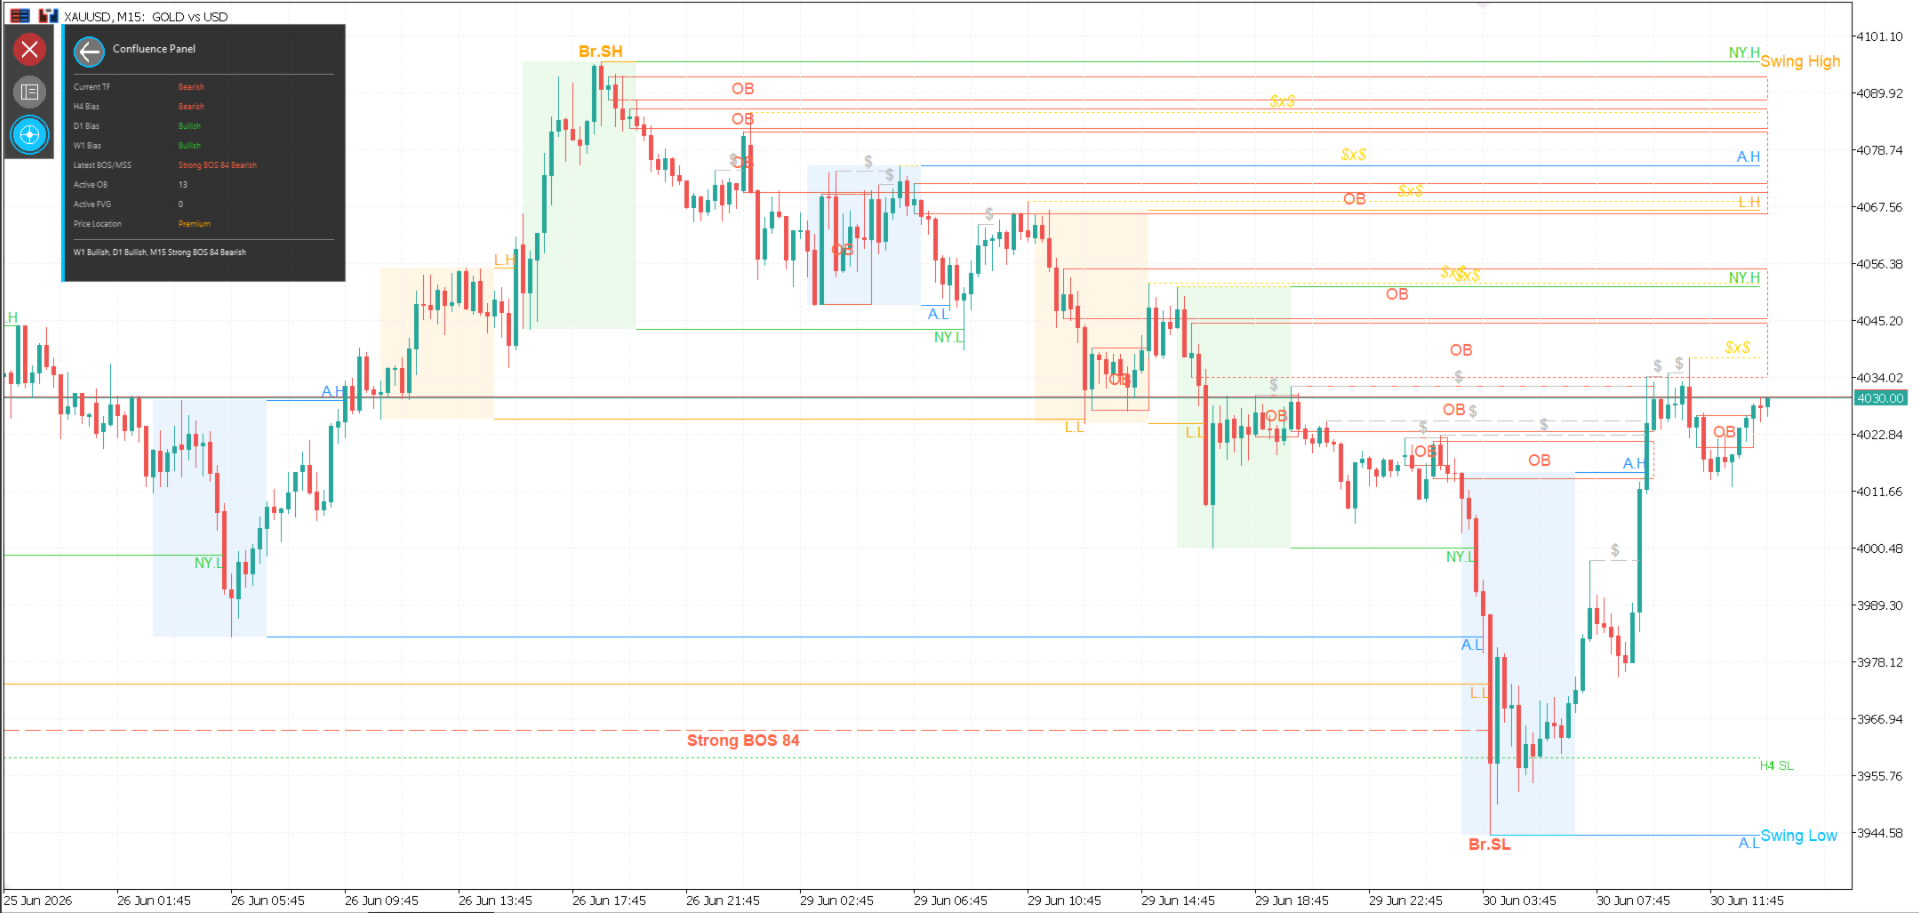
Market Structure Mapper is an MT5 indicator designed to help traders read price action with clear market structure context. It marks important swings, structure breaks, liquidity areas, order blocks, fair value gaps, session ranges, higher-timeframe levels, and confluence information directly on the chart.
The indicator is especially useful for traders who follow ICT, SMC, price action, or structure-based trading methods. It does not replace trader judgment, but it gives a cleaner chart view so you can make decisions with better context.
Advantages
- Saves time by automatically marking important structure points.
- Helps identify the current market direction and possible shifts in structure.
- Keeps key ICT/SMC concepts visible on one chart.
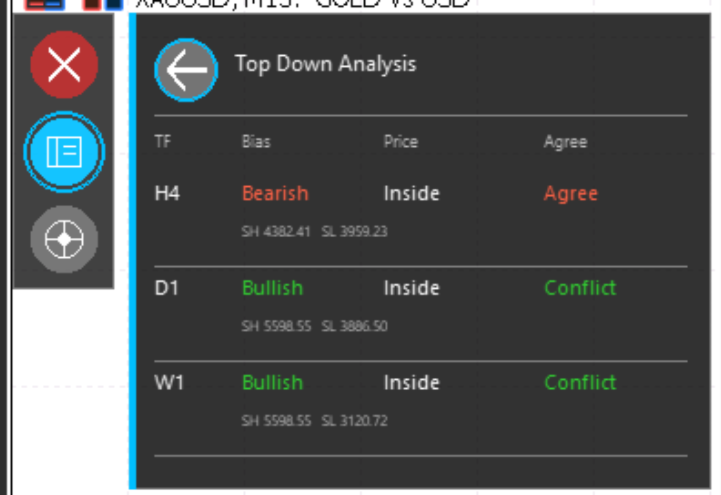
- Supports top-down analysis with higher-timeframe structure levels.
- Reduces manual chart marking for swings, BOS, MSS, OB, FVG, and liquidity.
- Provides a dashboard-style view for quick confluence checking.
- Works directly inside MetaTrader 5 without external tools.
- Useful for forex, indices, metals, crypto, and other MT5-supported symbols.
Key Features
Market Structure
- Marks Higher Highs, Higher Lows, Lower Highs, and Lower Lows.
- Draws active Swing High and Swing Low levels.
- Detects bullish and bearish Break of Structure conditions.
- Detects Market Structure Shift conditions.
- Uses swing logic to keep the chart focused on meaningful structure.
Liquidity Tools
- Marks internal high and low liquidity areas.
- Detects swept liquidity conditions.
- Highlights equal-liquidity-style levels using configurable tolerance.
- Helps traders see where price may be reacting around liquidity.
Smart Money Concepts
- Draws Order Block zones.
- Draws Fair Value Gap zones.
- Shows Premium, Discount, and Equilibrium areas.
- Helps traders combine structure with zone-based analysis.
Sessions
- Shows Asian, London, and New York session context.
- Draws session high and low levels.
- Optional session boxes help separate important trading windows.
- Optional session sweep labels can be enabled when needed.
Higher-Timeframe Context
- Projects higher-timeframe swing levels onto the current chart.
- Shows higher-timeframe BOS and MSS levels.
- Supports M15, H1, H4, D1, and W1 configuration.
- Includes top-down bias tools for multi-timeframe analysis.
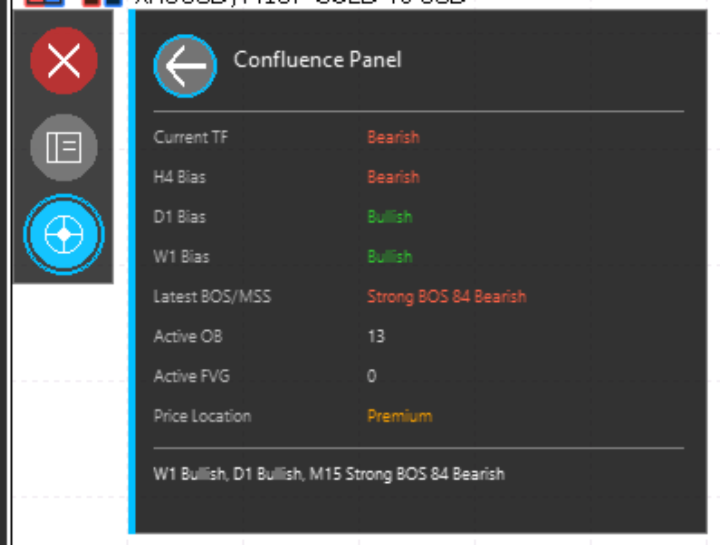
Dashboard and Confluence
- Includes a chart dashboard for quick structure review.
- Shows current-timeframe and higher-timeframe bias information.
- Displays latest BOS/MSS information.
- Summarizes active OB and FVG count.
- Shows price location in Premium, Discount, or Equilibrium.
Installation
- Open MetaTrader 5.
- Go to File > Open Data Folder .
- Open MQL5 > Indicators .
- Copy MarketStructureMapper.ex5 into the Indicators folder.
- Restart MetaTrader 5, or right-click Indicators in the Navigator and select Refresh .
- Drag Market Structure Mapper onto a chart.
- Adjust the input settings if needed and click OK .
If you also use the companion alert EA, copy the EA file into MQL5 > Experts , refresh the Navigator, and attach it to the chart separately.
Basic Setup
For most users, the default settings are a good starting point.
Recommended first setup:
- Keep Show Order Blocks enabled.
- Keep Show Internal Liquidity enabled.
- Keep Show Equilibrium enabled.
- Enable Show FVGs only if you want Fair Value Gaps drawn on the chart.
- Enable Show Premium/Discount if you want dealing-range context.
- Keep Show HTF Levels enabled for higher-timeframe reference.
- Keep Show Dashboard UI enabled for quick confluence review.
Important Inputs
- InpPullbackCandles : Controls pullback confirmation sensitivity.
- InpStrongBreakBodyMultiplier : Helps filter stronger structure breaks.
- InpStrongBreakMinScore : Minimum score for strong break qualification.
- InpShowFVGs : Shows or hides Fair Value Gap zones.
- InpShowOrderBlocks : Shows or hides Order Block zones.
- InpShowInternalLiquidity : Shows or hides internal liquidity levels.
- InpShowPremiumDiscount : Shows or hides Premium and Discount zones.
- InpShowSessionContext : Shows or hides session information.
- InpShowHTFLevels : Shows or hides higher-timeframe structure levels.
- InpShowDashboardUI : Shows or hides the dashboard panel.
How to Use
- Start with a higher timeframe to understand the main market direction.
- Use the marked Swing High and Swing Low levels to identify active structure.
- Watch BOS and MSS labels to understand continuation or possible reversal conditions.
- Use liquidity, OB, FVG, Premium, Discount, and Equilibrium zones as context areas.
- Check the dashboard for quick confluence between current and higher timeframes.
- Combine indicator output with your own trading plan, risk management, and confirmation rules.
Trading Notes
Market Structure Mapper is a chart analysis tool. It does not guarantee profitable trades and it should not be used as a standalone buy or sell system. Always test settings on a demo account first and use proper risk management.