Volume Profile Per Candle

VolumeProfilePerCandle v4.4

This is a comprehensive per-candle volume profile / footprint chart indicator for MetaTrader 5, rendered entirely via a canvas overlay (CCanvas). It's a single-file, zero-buffer indicator that draws directly onto the chart window using pixel-level graphics. Here's a complete breakdown:

Core Concept

For every visible candle, the indicator divides the bar's price range into configurable price levels (up to 50) and counts how much trading activity occurred at each level — either from actual tick data, tick volume, or real volume. It then visualizes this "time-at-price" distribution as a heatmap, footprint, or other visual style directly on the chart.

Major Feature Groups

1. Heatmap Rendering (Primary Visual)

The indicator offers 8 display modes for visualizing per-bar volume distribution:

  • Filled — solid colored rectangles per price level, color-mapped by intensity
  • Gradient — smooth vertical gradient blending within each cell (uses a 4-band approximation for performance)
  • Bars — horizontal bars where width represents intensity
  • Dots — dot-matrix pattern, density proportional to activity
  • Footprint (Bid×Ask) — classic footprint text showing bid and ask volume per level
  • Delta — colored rectangles showing net buy/sell imbalance per level
  • Total Volume — volume per level with delta-based coloring
  • Combined — heatmap intensity background + footprint text overlay

There are 9 color themes: Thermal (blue→red), Magma (black→yellow), Ocean, Forest, Plasma (purple→gold), Inferno, Grayscale, Neon (cyan→magenta), and Custom (user-defined 3-color gradient). A 256-entry color lookup table is pre-built each frame for performance.

2. Volume Data Sources

Three sources are supported:

  • Tick volume — standard MT5 tick volume, distributed across levels using a weighted model (body gets more weight than wicks, center of body gets most)
  • Real volume — exchange-reported volume where available
  • Actual tick data — the most accurate mode. Uses CopyTicksRange() to get real tick-by-tick data, classifies each tick as buy or sell using tick flags first, then a Lee-Ready algorithm fallback (comparing last price to bid/ask, then to previous tick direction). This populates true bid/ask volume per level.

3. POC (Point of Control) & Value Area

  • POC — the price level with the highest volume/activity within each bar. When real tick data is available, POC is based on actual traded volume ( totalVol[] ); otherwise it uses tick counts. Four visual styles: solid line, dashed line, arrow marker, diamond marker.
  • POC Extension — POC lines can extend rightward beyond the candle, with extension length proportional to the combined heatmap intensity at that price. Uses a thermal gradient that fades out. The extension multiplier is configurable (1×–10×).
  • Value Area — the price zone containing a configurable percentage (default 70%) of total volume, computed by expanding outward from the POC. Drawn as a semi-transparent fill with boundary lines (VAH/VAL).

4. High/Low Volume Nodes

  • HVN — levels exceeding a threshold percentage of the bar's max activity get a colored border highlight (default: 80% threshold, lime border)
  • LVN — levels below a threshold get a different highlight (default: 20% threshold, red border)

5. Order Block Detection (Smart Money Concepts)

A sophisticated hot-zone detection system that identifies institutional order blocks:

Detection method:

  • Scans the last N bars (configurable lookback, default 100)
  • Builds a bucketed price density map — divides the full price range into tolerance-width buckets and counts how many times price visited each bucket
  • Identifies "hot zones" where density exceeds a configurable percentage of the maximum density
  • Uses a top-N insertion sort to keep only the strongest MAX_OB (30) candidates
  • Checks for overlapping zones and deduplicates

Enhanced scoring (1–10 strength score):

  • Impulse detection (0–3 points) — looks for strong directional candles after the OB, scored relative to ATR (2× ATR = 3 pts, 1× = 2 pts, 0.3× = 1 pt)
  • Liquidity sweep (0–2 points) — checks if price swept previous swing highs/lows before forming the OB
  • Fair Value Gap (0–2 points) — detects FVGs adjacent to the OB (gap between bar[i] low and bar[i+2] high for bullish, ATR-relative minimum gap size)
  • Volume confirmation (0–1 point) — OB bar volume vs. 10-bar average (1.2× threshold)
  • Intensity (0–1 point) — density relative to max (>0.6 = 1 pt)
  • Bar count (0–1 point) — 2–8 bars in the zone scores a point

Mitigation tracking:

  • Tracks whether price has re-entered the zone, how deep (mitigationPct 0–100%)
  • 50% penetration = mitigated; full through = 100% mitigated
  • Breaker block detection — when price fully breaks through an OB, it flips to a breaker
  • Retest counting with per-bar deduplication
  • Mitigation state persists across rebuilds via a save/restore mechanism

Filtering:

  • Minimum touches, minimum volume, minimum strength score
  • Maximum range in pips or as ATR multiplier
  • OBs can extend forward (configurable bars)

Visual rendering:

  • Filled rectangles with opacity adjusted by strength (strong = brighter, mitigated = faded)
  • Dashed POC line within the zone
  • Labels showing type, bar count, strength score, and status (BREAKER/MIT %)
  • Small indicators for FVG, LIQ (liquidity sweep), IMP (impulse pips)
  • Strength bar on the right edge (color-coded: red→orange→yellow by score)
  • Intensity bar at bottom

6. Swing Arcs

Connects consecutive swing segments with smooth curves weighted by volume intensity:

  • Divides the visible range into segments of configurable period (default 8 bars)
  • For each segment, collects the POC price (or bar midpoint) at each bar as control points
  • Draws a Hermite-interpolated smooth curve through these points
  • Adds a parabolic arc offset based on whether the swing is bullish or bearish
  • Control point dots are drawn at each bar's intensity peak
  • Three line styles: smooth, dashed, dotted
  • Optional fill between the arc and a baseline
  • Color-coded: bullish = DeepSkyBlue, bearish = Magenta

7. Sub-Bar Intensity Profile

Draws a histogram alongside each candle showing the volume distribution:

  • Can appear on the right, left, or both sides of the candle
  • Bar width proportional to intensity at each level
  • Color intensity also scales with volume
  • Optional volume text labels
  • Configurable max width and opacity

8. Footprint & Imbalance Analysis

When using footprint display modes:

  • Bid×Ask — shows "BidVol × AskVol" at each level
  • Delta only — shows signed delta (+/-)
  • Volume (Delta) — shows "TotalVol (+Delta)"
  • All — shows "Bid × Ask [+Delta]"

Imbalance detection:

  • Compares ask volume at level N vs bid volume at level N-1 (buy imbalance)
  • Compares bid volume at level N vs ask volume at level N+1 (sell imbalance)
  • Configurable ratio threshold (default 1.0 = 100%)
  • Highlighted with colored backgrounds and borders

9. Combined Price Heatmap

An aggregate heatmap spanning the full visible range (not per-candle):

  • Sums volume from all cached bars (configurable lookback, default 200) into a single profile with 200 price levels
  • Drawn as a full-width overlay behind per-bar visuals
  • Shows where cumulative volume concentration exists across the visible chart
  • Also used for POC extension intensity lookup

10. Higher Timeframe (HTF) Confirmation Panel

Analyzes two higher timeframes simultaneously:

  • Auto-selection — automatically picks the next timeframe up (e.g., M15→H1, H1→H4, H4→D1)
  • Builds a volume profile on the HTF using the last N bars
  • Computes HTF POC, VAH, VAL
  • Determines trend direction: BULL/BEAR/NEUTRAL based on close vs. moving average, candle direction, and price vs. POC
  • Displays a panel in the top-right corner with trend, POC price, position relative to POC (Above/Below), and VA levels

11. Zoom System

Two independent zoom axes:

  • Vertical (PgUp/PgDn) — price zoom, each level narrows the visible price range by 15% (0.85^level), up to 20 levels. Uses CHART_SCALEFIX to lock the price range.
  • Horizontal (+/-) — first uses MT5's built-in chart scale (0–5), then adds an "extra zoom" (2×–8×) where every Nth bar is skipped and the remaining bars are drawn wider to fill the space.

12. Y-Axis Calibration

A notable technical detail: the indicator uses ChartTimePriceToXY() to calibrate the actual pixel range of the chart's price area (which is smaller than CHART_HEIGHT_IN_PIXELS due to toolbars/scrollbars). This ensures heatmap cells align precisely with candlesticks.

Performance Architecture

  • Hash-based cache — 4096-slot hash table with linear probing and tombstone deletion for O(1) bar data lookup (replaces O(n) linear scan)
  • Circular eviction — when cache is full (1200 entries), the oldest entry is overwritten via a circular write index
  • Bar X position cache — per-frame cache of up to 2000 bar pixel positions to avoid repeated ChartTimePriceToXY calls
  • Color LUT — 256-entry pre-built color lookup table eliminates per-cell floating-point color math
  • Pre-computed ARGB — all fixed colors computed once per frame
  • Visible-range culling — both bar loop and per-bar level loop skip off-screen elements
  • Throttled redraws — configurable minimum milliseconds between redraws (default 100ms) prevents redraw storms during scrolling
  • Tick subsampling — when tick count exceeds the configured max (default 5000), ticks are sampled at even intervals with counts scaled by the step size

Event Handling

  • OnCalculate — main tick handler, detects new bars, triggers heavy computations (OB/Arc detection, HTF analysis) only on new bars
  • OnChartEvent — handles CHARTEVENT_CHART_CHANGE (scroll/zoom), mouse hover for tooltips, and keyboard for zoom controls. Calls RenderFrame() directly for immediate responsiveness.
  • OnTimer — millisecond timer that catches scroll changes (mouse drag/wheel) that don't always trigger OnChartEvent, by polling chart state and comparing to previous values

RenderFrame() is fully self-contained — it reads chart state fresh and uses iTime/iHigh/iLow/iClose/iVolume instead of OnCalculate's array parameters, so it can be called from any event handler.

Configuration Summary

The indicator has ~80 input parameters organized into groups: Heatmap, Custom Colors, POC/Value Area, HVN/LVN, Order Blocks (~20 params), Swing Arcs, Sub-Bar Profile, Labels, HTF Confirmation, Chart Appearance, Footprint, Imbalance, Combined Heatmap, and Performance. It's designed to be a single all-in-one volume analysis tool that replaces multiple separate indicators.

Recommended products
Monitor your order
Eslam Mohamed Hassanein Hassan Aly
Advanced Lot & Profit Monitor PRO is a powerful MT5 indicator that provides real-time monitoring of your trading positions directly on the chart. It displays the number of orders, total lot sizes, and profit (including swap) for Buy and Sell positions separately, as well as the overall account performance. Designed with a clean and customizable interface, this tool helps traders stay in control of their exposure and risk at all times. Key Features: Real-time monitoring of open positions Sepa
MultiTimeframe Support and Resistance Zones
Mohamed Gamal Abdelnasser Yous Hashesh
A powerful indicator that highlights key market zones and helps traders identify potential opportunities across multiple timeframes. Designed for clarity and efficiency, it provides real-time alerts to keep you informed of important price levels. Key Features: Works on multiple timeframes: M1, M5, M15, M30, H1, H4, D1, W1, MN1. Customizable zone colors for each timeframe. Real-time alerts and notifications when price reaches significant zones. Automatically manages chart objects to keep your wor
This Volume Delta Profile is an advanced MetaTrader 5 indicator that visualizes   volume delta (order flow imbalance)   using a volume profile-style histogram. It shows the difference between buying and selling pressure at specific price levels, helping traders identify supply and demand zones. This indicator provides a unique perspective on market dynamics by visualizing the imbalance between buying and selling pressure, offering insights beyond traditional volume analysis. Core Concept Positiv
Premium level is a unique indicator with more than 80% accuracy of correct predictions! This indicator has been tested for more than two months by the best Trading Specialists! The author's indicator you will not find anywhere else! From the screenshots you can see for yourself the accuracy of this tool! 1 is great for trading binary options with an expiration time of 1 candle. 2 works on all currency pairs, stocks, commodities, cryptocurrencies Instructions: As soon as the red arrow app
Was: $249  Now: $99   Market Profile defines a number of day types that can help the trader to determine market behaviour. A key feature is the Value Area, representing the range of price action where 70% of trading took place. Understanding the Value Area can give traders valuable insight into market direction and establish the higher odds trade. It is an excellent addition to any system you may be using. Inspired by Jim Dalton’s book “Mind Over Markets”, this indicator is designed to suit the
Noize Absorption Index - is the manual trading system that measures the difference of pressure between bears forces and bulls forces. Green line - is a noize free index that showing curent situation. Zero value of index shows totally choppy/flat market.Values above zero level shows how powerfull bullish wave is and values below zero measures bearish forces.Up arrow appears on bearish market when it's ready to reverse, dn arrow appears on weak bullish market, as a result of reverse expectation.
Swing Volume Profile MT5 Swing Volume Profile Indicator — Auto Swing Detection, Volume Profile, Fibonacci Retracement & RSI Overlay in One Chart Tool Swing Volume Profile (SVP) automatically detects structural swings and displays a volume profile for the most recent completed swing — with Fibonacci retracement and RSI overlay. No manual range selection. No trendline required. The indicator finds the swings and builds the profile automatically. MT5 Native • No Repainting • Auto Swing Detection •
The indicator automatically identifies and labels essential elements of market structure shift, including: Break of Structure (BoS): Detected when there is a significant price movement breaking previous structural points. It mark possible uptrend and downtrend lines(UP & DN, It means constantly update high and low ), and once the price breaks through these lines, mark the red (BEAR) and green (BULL) arrows. BoS typically occurs when the price decisively moves through swing lows or swing highs t
Our   Basic Support and Resistance   indicator is the solution you need to boost your technical analysis. This indicator allows you to project support and resistance levels on the chart /   MT4 Version Features Integration of Fibonacci Levels:  With the option to display Fibonacci levels alongside support and resistance levels, our indicator gives you an even deeper insight into market behavior and possible reversal areas. Performance Optimization:  With the option to update extended lines onl
VolumeProfile MT5
Robert Hess
4.14 (7)
Description: The Volume Profile displays detailed informations of historical trading activities at certain price levels (Market Profile). Locate the areas with the best prices in the market and get an advantage over other market participants. Features: Customizable Market Profile Shows the "fair" Value Area with 70% of all Volume Shows critical low volume zones Shows VPOC, VAL and VAH Points integrated resource management to reduce the load while working with multiple charts Works on all timefr
Advanced Trading Chaos  The main purpose of the indicator is to help the trader detect the signals described by Bill Williams in his books to make a quick and correct trading decision. 1)Bullish/Bearish Reversal Bar(BDB) 2) Divergent Bar(DB) 3) Second Sage Signal — the third consecutive Awesome Oscillator bar  4) Working fractals (Fractals that worked above/below the red forehead  5) Three bar coloring modes 5.1) Coloring of bars according to the AO indicator (Including the squatting bar) 5.2
Stratos Pali mt5
Michela Russo
4.5 (8)
Stratos Pali Indicator is a revolutionary tool designed to enhance your trading strategy by accurately identifying market trends. This sophisticated indicator uses a unique algorithm to generate a complete histogram, which records when the trend is Long or Short. When a trend reversal occurs, an arrow appears, indicating the new direction of the trend. Important Information Revealed Leave a review and contact me via mql5 message to receive My Top 5 set files for Stratos Pali at no cost ! Down
PivotWave
Jeffrey Quiatchon
Introducing PivotWave – your ultimate trading companion that redefines precision and market analysis. Designed with traders in mind, PivotWave is more than just an indicator; it’s a powerful tool that captures the pulse of the market, identifying key turning points and trends with pinpoint accuracy. PivotWave leverages advanced algorithms to provide clear visual signals for optimal entry and exit points, making it easier for traders to navigate volatile market conditions. Whether you are a begin
RSI Currency Strength Meter is a powerful and elegant multi-currency indicator that measures the real-time relative strength of the 8 major currencies using RSI logic. By calculating the smoothed performance of each currency across its major pairs and applying the RSI formula, it delivers clean and responsive strength lines that make it easy to spot which currencies are truly strong or weak at any moment. This indicator is particularly useful for visualizing currency correlations and divergence
Max Min Delta Indicator - Market Volume Imbalance Analysis Gain Deeper Insights into Market Volume Imbalance with Delta Analysis What is the Max Min Delta Indicator? The Max Min Delta Indicator is a powerful market volume analysis tool that visually represents maximum and minimum delta values using a histogram. It helps traders identify market strength, weakness, absorption, and aggressive buying/selling activity with precision. Key Features Histogram Visualization: Displays Max Delta (Green) an
3D Intensity Balls with Volume Boost Indicator v1.4 A sophisticated MetaTrader 5 custom indicator that visualizes price-level trading intensity using dynamically-sized, photorealistic 3D spheres rendered on the chart canvas, enhanced with volume-based scaling and advanced visual effects. Core Functionality Price Distribution Analysis: Divides each candle's price range into configurable levels (default: 50) Samples tick data to measure time-at-price (price dwell intensity) Visualizes concentra
TRI Visualizer
Yoshimi Mon 三 Ura
TRI Visualizer MT5 – Thermodynamic Market Analysis Overview The TRI (Thermal Range Indicator) Visualizer Enhanced is a rare market analysis indicator that goes beyond conventional technical analysis, applying principles of thermodynamics from physics. It interprets market price fluctuations as “thermodynamic energy,” enabling the highly accurate detection of subtle market changes that are often overlooked. Innovative Mechanisms 1. Dual Calculation Engines Classic TRI Mode Formula: |Close
Fabii Half Trend Baseline
Fabien Georges Andre Guillemaud
Stop trading against the higher timeframe trend. Two baselines, one chart. No repaint. Any pair, any timeframe. On your chart in 2 minutes. Free demo in the Strategy Tester. Get more indicators here Baselines, volatility filters and oscillators. No repaint. Why you need it You enter a trade because a line turned green on your chart. Then you open a higher timeframe and see that the bigger trend points the other way. The signal was real. The trend behind it was not on your side. Every trade ta
Advanced Volume Profile Analysis Tool for MetaTrader 5 The Kecia Volume Profile Order Finder provides traders with volume profile analysis capabilities. This MT5 indicator combines volume profile visualization with statistical calculations to help identify potential trading opportunities and suggests entry, stop loss, and take profit levels based on market structure. Market Profile Visualization Transform your chart with customizable volume profile visualizations: Multiple visualization options
Scan a fixed list of assets (Ibovespa) in the chosen timeframe (TimeFrame). For each pair and for various periods. Calculate a regression model between the two assets (and, if desired, using the bova11 index as a normalizer). Generate the spread of this relationship, its mean, standard deviation, speculative deviation, and betas (B1 and B2). Apply an ADF test without exclusion (cointegration/stationarity). Calculate the Z-score of the current exclusion (how many standard deviations are away from
FREE
Confluence Meter: one consolidated rating from 26 indicators Confluence Meter calculates the signals of 26 popular indicators and merges them into a simple sell / neutral / buy rating. You don't have to open dozens of windows and compare readings by hand. One glance at the panel is enough to see which way the market is leaning on the selected timeframe. MT4-version:  https://www.mql5.com/en/market/product/199466 Our products: https://www.mql5.com/en/users/trendhunter/seller What you see on the c
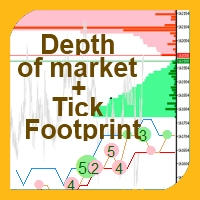
This indicator allows you to enjoy the two most popular products for analyzing request volumes and market deals at a favorable price: Actual Depth of Market Chart Actual Tick Footprint Volume Chart This product combines the power of both indicators and is provided as a single file. The functionality of Actual COMBO Depth of Market AND Tick Volume Chart is fully identical to the original indicators. You will enjoy the power of these two products combined into the single super-indicator! Below is
Here   our more valuable tools SMC Trend Trading   ,  Easy SMC Trading  ,  Institutional SMC Architect Volume Analysis Tools  ,  Volume flow Profile  ,  Market volume profile  , FVG with Volume  , Liquidity Heatmap Profile  ,  Volume Spread Analysis The    Liquidity Heatmap   is a sophisticated institutional trading tool designed to reveal where over-leveraged traders are trapped. By calculating estimated liquidation levels based on volume spikes and leverage, this indicator draws a dynamic "h
Indicator for determining flat and trend. If the price is below any of the two histograms and two lines (red and blue), this is a sell zone. When purchasing this version of the indicator, MT4 version for one real and one demo account - as a gift (to receive, write me a private message)! If the price is above any of the two histograms and two lines (red and blue), this is a buy zone. MT4 version:  https://www.mql5.com/ru/market/product/3793 If the price is between two lines or in the zone of
Before installing the HeatMap indicator make sure you are using a broker that gives you access to the Depth of market (DOM) !! This indicator creates a heatmap on your chart allowing you to see the buy or sell limit orders easily and in real time. You have the possibility to change the setting and the colors of the HeatMap in order to adapt to all markets and all charts. Here is an example of a setting you can use with the NASDAQ100 on the AMPGlobal broker :  https://www.youtube.com/watch?v=x0Y
Pro Gold System Indicator
PEDRO JOAQUIM GONCALVES GOMES
ADVANCED FUNCTIONALITIES: Trend Score (0-100) with visual bar Intelligent signals with adjustable strength (1-10) Risk management with automatic TP/SL Audible and visual alerts Price zones with smooth filling Multi-indicator analysis (RSI, ATR, BB, EMAs) DESIGN FEATURES Modern Visual: Smooth and well-spaced lines (EMA with 2-3px width) Vibrant and professional colors (Sky Blue, Orange, Gold) Modern arrows (code 233/234) for buy/sell signals Configurable dark/light theme Adjustable transparency f
This indicator acts as an advanced chart analysis assistant for traders who love trading Chart Patterns. It is designed to reduce the burden of visual analysis and increase accuracy in making a profit. Main features of this indicator from a practical usage perspective: 1. Automated Pattern Detection Saves time and reduces bias: You don't need to manually draw trendlines. The indicator will search for price swings (Pivot High/Low) and automatically draw Rising Wedge and Falling Wedge structures w
Honest Breakeven
Konstantin Gruzdev
Indicator gives an honest picture of changes in breakeven levels for transactions throughout the account history, and not just for open positions (screenshot 1). Accurate calculation of levels, taking into account accrued commissions, fees and swaps, allows you to evaluate trading results both visually and in Expert Advisors (screenshot 2). For Expert Advisors, the indicator in its standard form provides not only the break-even level, but also the number of positions, volume, and all additional
Crash 1000 Scalping Indicator for the Crash 1000 Deriv Synthetic Index. Introduction The Crash 1000 Scalping Indicator is a specialized tool designed for the Crash 1000 index on the Deriv Synthetic market. This indicator is particularly useful for scalping on the M1 timeframe, helping traders to identify precise entry and exit points for buy positions. It is designed to be non-repainting, providing clear signals with audible alerts and push notifications, and is compatible with mobile devices th
Buyers of this product also purchase
Trend Sniper X
Sarvarbek Abduvoxobov
4.86 (42)
Trend Sniper X is a multi-timeframe trend-following indicator for MetaTrader 5 that helps traders identify trend direction and potential reversal points with clarity and precision. for MT4: https://www.mql5.com/en/market/product/193245 Price Information: The current price is promotional and is subject to change as upcoming updates and new features are released. Bonus Offer: To get the FREE Auto-Trade Assistant EA for this indicator, please message the author after purchasing. Code2Profit Channe
Smart Trend Trading System — MetaTrader 5 Message me on MQL5 after purchase to receive Smart Universal Expert Advisor for FREE, plus the online course, PDF manual, and private group access. STTS brings trend direction, entry and exit signals, reversal zones, and important price levels together on your chart. Follow the system manually, or connect a separate compatible EA for automated execution using your chosen settings. ONE SYSTEM. FOUR TRADING APPROACHES. STTS organizes its trading approaches
Zoryk Gold
Reda El Koutbane
4.78 (18)
discount ends SOON next price 69 $ ZORYK — Advanced XAUUSD Signal System for MetaTrader 5 You know the feeling. You spend time analyzing gold. You wait for the entry. You finally open the trade, and price immediately moves against you. You close too early, move the Stop Loss or hesitate for a few seconds. Then the market reaches the exact destination you originally expected without you. The direction was not always the problem. The real problem was uncertainty. You did not know exactly where th
SuperScalp Pro
Van Minh Nguyen
4.56 (36)
SuperScalp Pro - Professional Multi-Layer Confluence Scalping System SuperScalp Pro is an advanced scalping indicator that upgrades classic Supertrend with multiple intelligent confirmation filters. It helps you identify higher-probability Buy/Sell opportunities while significantly reducing false signals. Clear Buy and Sell arrows appear directly on the chart, with automatic ATR-based Stop Loss and Take Profit levels calculated in real time. After purchase, contact me for setup guidance and reco
M5 Sniper
MeanFX
5 (3)
Get your trading edge in the line of sight M5 Sniper   is a new indicator by MeanFX. It combines   precise trading signals   with   adaptive TP/SL levels   - creating best possible statistical trades as a result! The price increases every 5 purchases, the next price is 79$ Message me after purchase to receive tips/guide and bonus EA What makes it stand out?   Proven statistical performance   on Gold XAUUSD ( works almost on every asset focusing on mastering one timeframe instead of trying to
A new King in town - Indicator + Order management indications(tp1+tp2+tp3) + Optional Telegram Signal sender   INCLUDED (FREE) + Bonus EA Robot ( FULL TRADING  and SIGNAL SYSTEM ) Our best EA for Gold: Gold Slayer TRY > Reversion Queen  Expert advisor NEW Free Automation EA link < click here ( disclaimer: this is new and still on testing and phase , use at your risk on demo) Free Telegram Bridge < click here  This indicator includes an advanced Strategy, a trading system with customisable order
SMC Intraday Formula
VividMind Digital Solutions
5 (26)
Secure the Lowest Price Today. After purchase, contact via   MQL5 inbox   to receive your buyer kit and bonus. Let's be honest first. No indicator will make you profitable on its own. If someone tells you otherwise, they're selling you a dream. Every indicator that shows perfect buy/sell arrows can be made to look flawless — just zoom into the right window of history and screenshot the winners. We won't do that. SMC Intraday Formula is a tool. It reads the market structure for you, maps the hig
Boba Analysis Suite
Trade Ready Solutions LLC
5 (1)
Boba Analysis Suite Boba Analysis Suite is an analytical indicator for MetaTrader 5. It brings market structure, relevant price zones and broader market context together in a single chart view. Developed through practical experience as a trader and trading coach, it supports a structured analysis process: assessing market direction, identifying important levels and considering multiple timeframes together. Analysis in Context Individual signals gain meaning through context. Boba Analysis Suite h
Auto Optimized SpeedAngle is an institutional-grade momentum vectoring system that eliminates curve-fitting through continuous Walk-Forward Optimization (WFO). Rather than relying on static inputs that degrade when market regimes shift, the indicator dynamically recalibrates its parameters using Out-of-Sample (OOS) validation, ensuring the displayed signals represent genuine statistical edges rather than historical anomalies. By shifting the focus from subjective visual angles to normalized, qua
GoldenX Entry MT5
VividMind Digital Solutions
5 (17)
Price will increase by $20 every 10 buyers to maintain premium value. After purchase, contact via   MQL5 inbox   to receive your buyer kit and bonus. You have probably tested dozens of indicators before. But we are not here to be “just another signals indicator.” Behind GoldenX Entry is intensive research & development focused on building sophisticated algorithms designed to adapt to the real behavior of every instrument — not generic signals recycled everywhere else. From advanced Auto Optim
Entry Points Pro 10 — the legend of the MQL5 Market. Three years in the Market's Top-3. 595 reviews across two versions. Over 31,000 demo downloads. Thousands of traders open their charts with it every morning. Built and traded by an author who has been in the market since 1999. Version 10 is the biggest rebuild in the indicator's history: I read every review from five years — and built the answers into the code. WHAT IT DOES It shows the entry point in advance — strictly without repainting. The
ARIPoint
Temirlan Kdyrkhan
1 (4)
ARIPoint is a powerful trading companion designed to generate high-probability entry signals with dynamic TP/SL/DP levels based on volatility. Built-in performance tracking shows win/loss stats, PP1/PP2 hits, and success rates all updated live. Key Features: Buy/Sell signals with adaptive volatility bands Real-time TP/SL/DP levels based on ATR Built-in MA Filter with optional ATR/StdDev volatility Performance stats panel (Success, Profit/Loss, PP1/PP2) Alerts via popup, sound, push, or email Cu
Gann Made Easy   is a professional and easy to use Forex trading system which is based on the best principles of trading using the theory of W.D. Gann. The indicator provides accurate BUY and SELL signals including Stop Loss and Take Profit levels. You can trade even on the go using PUSH notifications. PLEASE CONTACT ME AFTER PURCHASE TO GET TRADING  INSTRUCTIONS   AND GREAT EXTRA INDICATORS  FOR FREE! Probably you already heard about the Gann trading methods before. Usually the Gann theory is a
M1 Sniper MT5
Oleg Rodin
5 (7)
M1 SNIPER  is an easy to use trading indicator system. It is an arrow indicator which is designed for M1 time frame. The indicator can be used as a standalone system for scalping on M1 time frame and it can be used as a part of your existing trading system. Though this trading system was designed specifically for short-term trading, it still can be helpful for all traders. This trading system can be used with any forex pair and time frame, though lower time frames are recommended from M1 up to M
Adaptive Price Action Engine Buy Indicator- Get EA Based on it for FREE. Self-Optimizing Multi-Timeframe Trend & Candlestick Intelligence Markets do not behave the same way all the time—and not every price-action pattern has the same value in every market regime. Adaptive Price Action Engine is designed to adapt to changing market conditions by combining trend structure, multi-timeframe analysis, candlestick patterns, and statistical optimization into one analytical framework. Two Adaptive Mode
FiboSniper Pro
Van Minh Nguyen
5 (4)
FiboSniper Pro - Multi-Filter Fibonacci System with Auto SL/TP and Control Panel FiboSniper Pro is a technical indicator that combines dynamic Fibonacci Envelopes with multiple confirmation filters to generate selective Buy and Sell signals. Fibonacci levels are calculated from Moving Average and ATR, then filtered by ADX, EMA, RSI, ATR, Volume, Time and Candle structure. The indicator displays automatic ATR-based Stop Loss and Take Profit levels directly on the chart, along with an interactive
Gold Entry Sniper
Tahir Mehmood
5 (21)
Gold Entry Sniper – Professional Multi-Timeframe ATR Dashboard for Gold Scalping & Swing Trading Gold Entry Sniper is a cutting-edge MetaTrader 5 indicator designed to give traders precise buy/sell signals for XAUUSD and other symbols, powered by ATR Trailing Stop logic and a multi-timeframe analysis dashboard . Built for both scalpers and swing traders, it combines real-time market direction , dynamic stop levels , and professional visual dashboards to help you identify high-probability gold en
Break and Retest Hunter
Mohamed Hassan
3.67 (3)
Break and Retest Hunter is a powerful MetaTrader 5 indicator designed to automatically identify support and resistance levels, breakout structures, and potential retest opportunities in real time. Bonus Indicator: After purchasing Break and Retest Hunter , contact me to receive Trade Indicator Assistant EA completely free as a bonus utility. $65 for the next 10 copies . Next price is $120.  Combining adaptive market analysis, clear BUY/SELL signals, Fibonacci-based profit targets, and a premiu
Neuro Poseidon MT5
Daria Rezueva
4.75 (52)
Neuro Poseidon is a new indicator by Daria Rezueva. It combines precise trading signals with adaptive TP/SL levels - creating best possible trades as a result! Message me and get  Neuro Poseidon Assistant  as a gift to automize your trading process! What makes it stand out? 1. Proven profitability on all assets and timeframes 2. Only confirmed BUY and SELL signals present on the chart 3. Adaptive TP & SL levels generated by the software for each trade 4. Easy to understand - suitable for al
Tokyo mt5 Indicator
Vasiliy Strukov
5 (10)
Tokyo Indicator provides a clear visual overview of trend direction, potential trading signals, and market conditions. Its colour-coded, stepped trend line distinguishes bullish phases in blue from bearish phases in magenta. Matching directional arrows highlight potential buying and selling opportunities when the displayed trend changes. An integrated dashboard brings together the current signal, market bias, momentum, volatility, and signal quality in one convenient view. This allows traders t
Apex Patterns PRO Buy Indicator - Get Expert Advisor Based on it for FREE. Self-Optimizing Chart Pattern & Breakout Intelligence Traditional pattern scanners rely on fixed inputs, often underperforming when market volatility and structures shift. Apex Patterns PRO is designed to adapt to changing market conditions by combining structural chart pattern recognition, momentum filtering, and statistical self-optimization into one analytical framework. Adaptive Scanning Engine Self-Optimizing Patter
Gold Trend Coach MT5
Cristhian Alexander Gaibor Cuasquer
5 (2)
Gold Trend Coach is a gold (XAUUSD) trend indicator for MetaTrader 5 with buy and sell signals, stop loss and three take profit targets, confirmed on bar close, a multi-timeframe coach dashboard and alerts to your phone and Telegram. Built for M5 scalping and M15 intraday during the London and New York sessions. Gold Trend Coach: XAUUSD gold trend signals with entry, stop and three targets. Launch price $39 for the first 20 copies, next price $59. Write me after purchase and your buyer kit is o
Entry In The Zone and SMC Multi Timeframe is a real-time market analysis tool based on Smart Money Concepts (SMC), designed to analyze market structure, price direction, and key trading zones. It supports both Single-Timeframe and Multi-Timeframe Analysis, providing a clearer view of overall market structure across multiple timeframes, with real-time BUY / SELL signals designed with a strict focus on No-Repaint principles. The signals are designed to help filter unclear setups and evaluate tradi
Trend Catcher ind mt5
Ramil Minniakhmetov
5 (18)
TREND CATCHER INDICATOR Trend Catcher Indicator analyzes market price movements, using a combination of the author’s proprietary and customized adaptive trend-analysis indicators.  It identifies the true market direction by filtering out short-term noise and focusing on underlying momentum strength, volatility expansion, and price structure behavior.  It also uses a combination of smoothing and trend-filtering customized indicators such as moving averages, RSI, and volatility filters.   Real ope
Unix Scalper
Issam Kassas
4 (4)
Unix Scalper — MetaTrader 5 Message me on MQL5 after purchase to receive Smart Universal Expert Advisor for FREE, plus the online course, PDF manual, and private group access. Find the setup. See the plan. Choose how to trade it. UNIX Scalper brings market analysis, BUY/SELL/WAIT decisions and Entry, Stop Loss, TP1 and TP2 levels into one organized panel. SEE THE SIGNAL AND THE PLAN • Clear decisions: BUY, SELL or WAIT. • Defined levels: Entry, Stop Loss, TP1 and TP2. • Multi-timeframe overvie

FX Trend MT5 NG
Daniel Stein
5 (6)
FX Trend NG: The Next Generation Multi-Market Trend Intelligence Overview FX Trend NG is a professional multi-timeframe trend and market monitoring tool designed to give you a complete structural overview of the market in seconds. Instead of switching between dozens of charts, you instantly see which symbols are trending, where momentum is fading, and where strong alignment exists across timeframes. This tool is part of the Stein Investments ecosystem - 18+ tools plus Max, your 1-on-1 AI tradi
Advanced Supply Demand MT5
Bernhard Schweigert
4.53 (15)
Best Solution for any Newbie or Expert Trader! This indicator is a unique, high quality and affordable trading tool because we have incorporated a number of proprietary features and a new formula. With this update, you will be able to show double timeframe zones. You will not only be able to show a higher TF but to show both, the chart TF, PLUS the higher TF: SHOWING NESTED ZONES. All Supply Demand traders will love it. :) Important Information Revealed Maximize the potential of Advanced Supply
Smart Price Action Concepts — MetaTrader 5 Message me on MQL5 after purchase to receive Smart Universal Expert Advisor for FREE, plus the online course, PDF manual, and private group access. See the structure. Identify the zones. Build your trading plan. Bring Smart Money Concepts (SMC), ICT-style analysis and price action together in one organized chart. Identify market structure, order blocks, liquidity reference levels and imbalances, then choose which elements to display through the Smart Pa
Introducing   Quantum Breakout PRO , the groundbreaking MQL5 Indicator that's transforming the way you trade Breakout Zones! Developed by a team of experienced traders with trading experience of over 13 years,   Quantum Breakout PRO   is designed to propel your trading journey to new heights with its innovative and dynamic breakout zone strategy. Quantum Breakout Indicator will give you signal arrows on breakout zones with 5 profit target zones and stop loss suggestion based on the breakout b
Atomic Analyst MT5
Issam Kassas
4.48 (62)
Atomic Analyst — MetaTrader 5 Message me on MQL5 after purchase to receive Smart Universal Expert Advisor for FREE, plus the online course, PDF manual, and private group access. Atomic Analyst brings price action, trend direction, entry and exit signals, Stop Loss and multiple Take Profit levels together on your chart. SEE THE SIGNAL. UNDERSTAND THE SETUP. Atomic Analyst organizes its analysis into clear visual information: • Buy and sell arrows to identify potential entries. • Stop Loss and mul
More from author
Gann Square of Nine
Mahmoud Ahmed Abdou Ali
Here is the full technical and strategic description for the Gann Square of 9 indicator. Full Name Gann Square of 9 - Intraday Levels (v2.0) Overview This is a mathematical Support & Resistance indicator based on W.D. Gann's "Square of 9" theory. Unlike moving averages which lag behind price, this indicator is predictive . It calculates static price levels at the very beginning of the trading day (based on the Daily Open) and projects them forward. These levels act as a "road map" for the day,
FREE
Candle Color RSI
Mahmoud Ahmed Abdou Ali
Candle color RSI (Relative Strength Index) indicators change candlestick colors on the price chart to visually show RSI conditions like overbought/oversold levels or bullish/bearish momentum, using colors like red for overbought/bearish and green for oversold/bullish, helping traders spot reversals or strength at a glance without looking at the separate RSI pane. These custom indicators often color candles red above 70 (overbought), green below 30 (oversold), and keep default colors in between
FREE
Here is the full professional description for your indicator, rebranded as Institutional Trend Candles (ITC) . You can use this text for your Market documentation, user manual, or simply to understand exactly how your tool functions. Institutional Trend Candles (ITC) v1.0 Overview Institutional Trend Candles (ITC) is a specialized trend-following system designed to filter out "retail noise" and visualize the true directional flow of the market. Built specifically for high-volatility assets like
FREE
Matrix Oscillator
Mahmoud Ahmed Abdou Ali
MATRIX OSCILLATOR - Summary Guide WHAT IS IT? A multi-component oscillator that combines: Smart Money Flow (MFI-based histogram) Net Score (Trend strength from -100 to +100) Signal Line (Crossover reference) Confluence Zones (Confirmation areas) PhiSmoother Technology (Advanced noise filtering) STRONG BUY SIGNALS Component Condition Confluence Green zone filled (top) Money Flow Green bars above zero MFI Threshold MFI above green threshold line Net Score
Supply and Demand X
Mahmoud Ahmed Abdou Ali
Supply and demand in trading describes how buyer (demand) and seller (supply) actions set asset prices, with high demand/low supply raising prices (premium) and low demand/high supply lowering them (discount); traders identify these imbalances as "zones" on charts (e.g., Rally-Base-Rally for demand, Drop-Base-Drop for supply) to find potential entry/exit points, aiming to buy at discount demand zones and sell at premium supply zones, using volume and price action to confirm institutional acti
FREE
Dema macd zone Divergence
Mahmoud Ahmed Abdou Ali
Indicator: The DEMA MACD Zone Divergence This is a powerful, multi-timeframe trend-following indicator based on the Moving Average Convergence Divergence (MACD) , but enhanced using Double Exponential Moving Averages (DEMA) for reduced lag. Its main function is to paint the background of the price chart with color-coded rectangular zones, clearly signaling the current momentum phase and potential shifts in market control (bullish or bearish). Core Purpose To visually map the strength and phas
FREE
Description The Institutional Cycle Filter (ICF) is a sophisticated trend-following tool that replaces standard moving averages with a "Signal Dot" system. It is designed to minimize lag while maintaining smoothness, making it highly effective for identifying trend reversals in volatile markets like Gold. How It Works (The Logic) Cosine Weighting: Unlike a Simple Moving Average (SMA) or Exponential Moving Average (EMA), this algorithm uses a Cosine function to calculate weights. This allows the
FREE
MA Ribbon
Mahmoud Ahmed Abdou Ali
The MA ribbon is not a single indicator but rather an overlay of multiple moving averages (typically four to eight or more) of varying lengths plotted on the same price chart.  Visual Appearance: The resulting lines create a flowing, ribbon-like pattern across the price chart. Components: Traders can use different types of moving averages, such as Simple Moving Averages (SMA) or Exponential Moving Averages (EMA), and adjust the time periods (e.g., 10, 20, 30, 40, 50, and 60 periods) to suit t
FREE
Accurate Signal Pro
Mahmoud Ahmed Abdou Ali
Accurate Signal ARC is a non-repainting trend & reversal signal indicator designed for MT4 . It uses ATR-weighted volatility logic combined with adaptive price channels to detect high-probability BUY and SELL points directly on the chart. How It Works Calculates a dynamic volatility channel using weighted ATR Detects trend direction (river state) and switches only when price decisively breaks the channel Filters noise using spread-aware true range Draws clear arrows : Lime Arrow → BUY si
The best eveR
Mahmoud Ahmed Abdou Ali
Indicator Name: "The Range Master" Core Purpose The Range Master is an advanced, multi-timeframe technical indicator designed to identify market consolidation (sideways ranging) and subsequent high-momentum breakout opportunities. It helps traders visually confirm when price action transitions from low-volatility accumulation to high-volatility trend initiation. ️ Functional Description (What it Does) The Range Master performs three primary, interconnected functions: Range Mapping , Breakout
Footprint MT5
Mahmoud Ahmed Abdou Ali
Footprint charts in MetaTrader 5 (MT5) provide traders with a detailed view of market activity, allowing for better analysis of price movements and trading decisions. What is a Footprint Chart? A footprint chart is a specialized visualization tool that displays market data beyond traditional candlestick or bar charts. It reveals how volume was distributed at each price level within a specific time frame, often segmented by bid and ask activity. This level of detail helps traders understand the
MM Ultimate Pro Analyzer v10.0 - USER GUIDEBASIC USAGEStep 1: Add to Chart Open any chart in MetaTrader 5 Go to Navigator → Indicators Find MM Ultimate Pro Analyzer Drag it onto your chart A settings window will appear Step 2: Configure for Your Timeframe Choose settings based on what you trade: Timeframe NumberOfCandles VolumeAveragePeriod M1-M5 (Scalping) 10-20 50 M15-M30 (Day Trading) 5-10 30 H1-H4 (Swing Trading) 3-7 20 D1+ (Position Trading) 3-5 14 Step 3: Understand the Button Bar At the t
Phantom Flow
Mahmoud Ahmed Abdou Ali
This indicator is a hybrid SMC + Trend + Oscillator tool that draws market-structure objects on the chart and also plots trend shift lines + arrows and a colored oscillator histogram. It includes these modules: Phantom Shift (ATR trend shift / trailing bands) Swing Structure (BOS/CHoCH + swing points) Internal Structure (iBOS/iCHoCH) Order Blocks (swing + internal) Equal Highs / Equal Lows (EQH / EQL) Fair Value Gaps (FVG) Premium / Discount zones (range zones) Phantom Oscillator (MA
Trading Simulator X
Mahmoud Ahmed Abdou Ali
TradePanel Pro Indicator Testing & Trading Simulator Core Purpose (Clear & Honest) TradePanel Pro is a manual trading simulator designed to test indicators, signals, and strategies in real market conditions — without relying on automated logic. You see the signal → you click → you evaluate the result . What TradePanel Pro Is (Correct Positioning) Manual BUY / SELL execution panel Layered entries (multi-order testing) Real-time TP / SL behavior Trailing stop simulation Profit /
Edge loophole detector
Mahmoud Ahmed Abdou Ali
Quantitative Session Breakout Profiler & Data Miner Executive Summary: The "London Hunter v18.0" is not merely a buy/sell signal indicator; it is a statistical data mining engine . Its core idea is that market openings (London, NY, Asia) are not random, but distinct "micro-regimes." By measuring the specific "physics" of price movement (speed, pullback, candle size) during these opening windows, the system identifies which specific conditions lead to successful breakouts and which lead to fakeou
Institutional Physics Engine (IPE) v4.20 Market Structure, Liquidity & Valuation Diagnostic System WHAT THIS TOOL IS Institutional Physics Engine (IPE) is a real-time market diagnostics indicator that analyzes price using behavioral physics, liquidity response, supply & demand pressure, and equilibrium valuation. It does not predict price and does not generate blind buy/sell signals. Instead, it answers three professional trading questions: Where is fair value right now? Who is in con
Universal Strategy Validator: Turn Any Indicator into a Backtested Strategy Headline: Stop guessing if an indicator works. See the win rate, profit factor, and drawdown instantly—without writing a single line of code. Overview: The Universal Strategy Validator (USV) is a powerful analytical engine that connects to any MetaTrader 5 indicator. It reads the signal buffers (arrows, lines, or histograms) and runs a real-time simulation across historical data. It applies professional-grade filtering,
Institutional QQE Oscillator (IQO) Description The Institutional QQE Oscillator (IQO) is a "momentum volatility" filter. Unlike a standard RSI which is jagged and noisy, the QQE uses a smoothing technique and a "Volatility Stop" mechanism (the yellow dotted line) on the RSI itself. Blue Line (Fast): The Smoothed RSI momentum. Yellow Dotted Line (Slow): The Volatility Threshold. Signal: When the Blue line crosses the Yellow line, it indicates a shift in true momentum, filtering out fake-outs. How
Candle Density Boxes
Mahmoud Ahmed Abdou Ali
Candle Density Boxes Indicator  Summary The Candle Density Boxes (CDB) indicator is an algorithmic tool that identifies price zones where candles cluster with high frequency. Through empirical analysis, we demonstrate that these zones exhibit statistically significant mean-reversion properties, with return frequencies ranging from 76–80% across multiple instruments. Key Findings: Zones with 6+ candle touches show 90%+ return probability Rank-based hierarchy provides clear reliability classifica
Summary (What Changed & Why It Matters) Traditional FVG indicators suffer from three structural flaws : Detection and mitigation are coupled Wicks and bodies are treated identically Partial mitigation is not preserved This indicator introduces a new FVG model where: Detection ≠ Mitigation Wick interaction ≠ Body acceptance FVGs decay progressively , not instantly This transforms FVGs from a static drawing tool into a dynamic price-acceptance model .
3D Intensity Balls with Volume Boost Indicator v1.4 A sophisticated MetaTrader 5 custom indicator that visualizes price-level trading intensity using dynamically-sized, photorealistic 3D spheres rendered on the chart canvas, enhanced with volume-based scaling and advanced visual effects. Core Functionality Price Distribution Analysis: Divides each candle's price range into configurable levels (default: 50) Samples tick data to measure time-at-price (price dwell intensity) Visualizes concentra
All Symbols monitoring
Mahmoud Ahmed Abdou Ali
# All Trading Symbols Monitoring ## Version 9.43 | MT5 Indicator (Dual Mode) > An advanced multi-symbol trading monitor that watches all available broker symbols simultaneously, detects breakout opportunities, scores signal quality, and manages both paper and live trades - all displayed in a live on-chart dashboard. --- ## What This Tool Does - [ All Trading Symbols Monitoring ]( #all-trading-symbols-monitoring )   - [ Version 9.43 | MT5 Indicator (Dual Mode) ]( #version-943--mt5-indicator-
Lux Algo
Mahmoud Ahmed Abdou Ali
This system is a Self-Optimizing Algorithmic Framework . Unlike static indicators, it uses a Recursive Feedback Loop to "learn" the current market regime and adjust its sensitivity in real-time. Because it calculates every step based solely on current and past data, it is a Real-Time Model with no repainting, no bias, and no lookahead. How the "AI" Operates Performance-Based Learning: The system constantly "grades" its own accuracy. If the market is trending cleanly, it increases its sensitivit
Filter:
No reviews
Reply to review