NRTR Volatility Engine

CRV NRTR Volatility Engine is a professional-grade adaptive trend and market regime indicator built on volatility-normalized price structure.


NRTR (Narrow Range Trend Reversal) is a volatility-adaptive structural algorithm designed to detect genuine market regime changes by identifying when price breaks out of compressed ranges with sufficient volatility confirmation.

It is not just another trailing stop.

It is a true regime detection engine that:

✔ Adapts dynamically to changing volatility
✔ Filters noise in consolidation phases
✔ Detects real structural trend shifts
✔ Visualizes bullish and bearish regimes with precision

This makes it ideal for trend traders, cycle analysts, algorithmic systems, and prop-firm trading rules (no grid, no martingale).

CORE LOGIC (HOW IT WORKS)

The indicator computes a volatility-adjusted structural boundary:

V a l u e = E x t r e m e ± K × A T R 

Where:

Component Meaning
Extreme Highest / lowest price in a dynamic window
ATR Real-time volatility
K User-defined volatility multiplier
Dynamic Period Expands and contracts automatically based on price behavior


Regime States

Bullish Regime

Price ≥ Volatility-Adjusted Support

Bearish Regime

Price ≤ Volatility-Adjusted Resistance

When price decisively violates the volatility structure, the engine switches regime, plotting a new structural line and arrow.  


🟢 BEGINNER LEVEL — “WHAT AM I SEEING?”

Visual Elements

Element Meaning
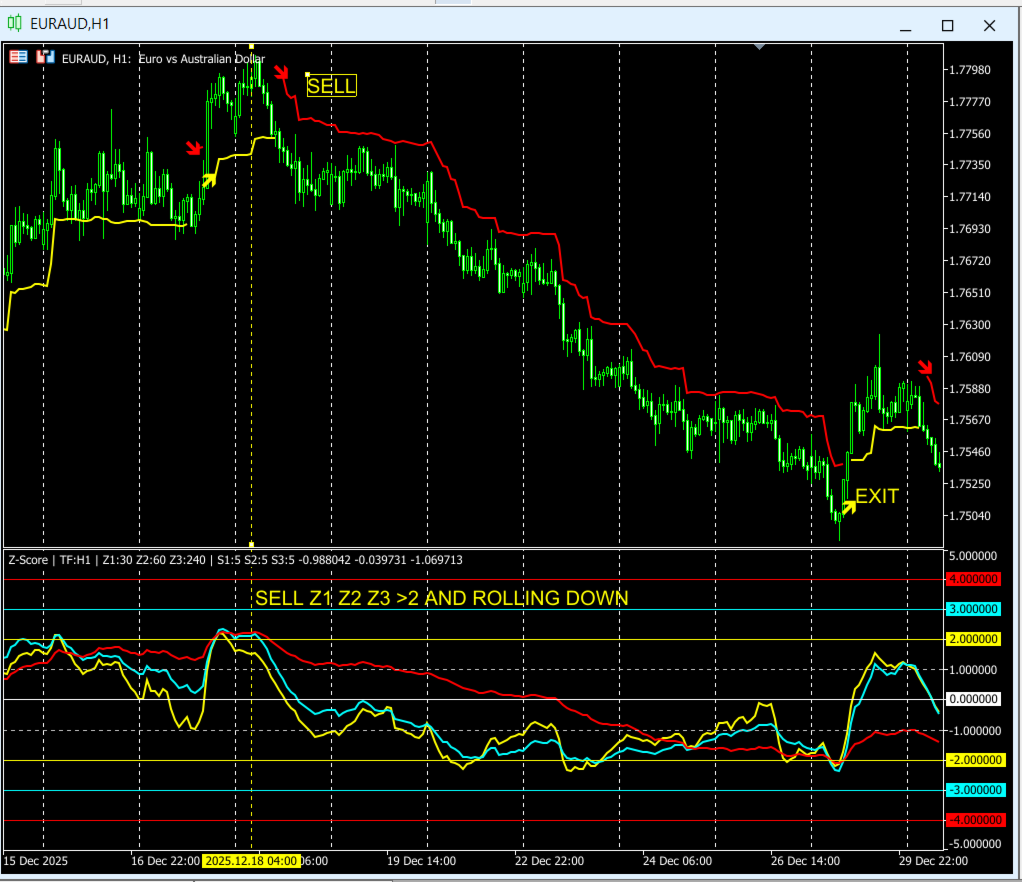
Yellow Line Bullish structural regime
Red Line Bearish structural regime
Yellow Arrow New bullish regime
Red Arrow New bearish regime

Simple Trading Logic

Buy Bias

  • Yellow structure active

  • Price above the line

  • Bullish arrow confirms regime shift

Sell Bias

  • Red structure active

  • Price below the line

  • Bearish arrow confirms regime shift

✔ Keeps traders aligned with dominant market direction
✔ Filters out low-quality counter-trend trades
✔ Reduces emotional decision-making

🟡 INTERMEDIATE LEVEL — “WHY IT IS DIFFERENT”

Adaptive Structure

Unlike fixed-window indicators, CRV NRTR dynamically changes its internal period:

✔ Expands during sustained trends
✔ Resets after real structural breaks
✔ Reacts faster in volatility expansion
✔ Smooths during consolidation

This results in:

  • Cleaner trend detection

  • Fewer false reversals

  • Better regime clarity

You are no longer trading price noise — you are trading market structure.

🔴 ADVANCED LEVEL — “MARKET REGIME ENGINE”

Each arrow represents:

✔ A volatility envelope violation
✔ A structural extreme reset
✔ A true regime transition

Professional Use Cases

✔ Trend confirmation filter
✔ Dynamic trailing stop / invalidation level
✔ Cycle-based entries (Hurst, Wyckoff, CRV Z-Score)
✔ Prop-firm compliant trend logic

🔍 COMPARISON WITH OTHER POPULAR INDICATORS

1️⃣ Chandelier Exit vs CRV NRTR

Feature Chandelier Exit CRV NRTR Volatility Engine
Trailing Stop ✔ ✔
Uses ATR ✔ ✔
Tracks Extremes ✔ ✔
Dynamic Lookback ❌ ✔
Regime Detection ❌ ✔
Structural Trend Engine ❌ ✔
Noise Filtering Moderate Adaptive
Designed for Entries ❌ ✔

Chandelier Exit is primarily an exit tool.

CRV NRTR is a full structural trend and regime engine that:
➡ Identifies when the market itself has changed, not just where a stop should trail.

2️⃣ SuperTrend vs CRV NRTR

Feature SuperTrend CRV NRTR Volatility Engine
ATR-Based ✔ ✔
Trend Direction ✔ ✔
Fixed Multiplier ✔ ❌ (Adaptive)
Dynamic Period ❌ ✔
Regime Awareness ❌ ✔
Structural Extremes ❌ ✔
Whipsaw Filtering Weak in ranges Strong via adaptive structure
Trend Maturity Awareness ❌ ✔


SuperTrend uses:  Price ± Multiplier × ATR  …with fixed parameters, making it sensitive to chop.


CRV NRTR:
✔ Adapts both volatility and structure
✔ Resets on true market breaks
✔ Avoids frequent flip-flops in sideways markets

➡ Result: Fewer false signals, cleaner trends, better risk structure.


CRV – Detect Market Cycles. Trade Regime Transitions. Control Volatility Risk.

CRV is built on the principle that markets do not move randomly—they evolve through recurring cycles, shifting regimes, and changing volatility.

“Detect Market Cycles” means identifying the natural expansion and contraction phases in price behavior, where accumulation, trend development, and exhaustion repeat over time. Instead of reacting to individual candles or lagging indicators, CRV focuses on the underlying rhythm of the market, allowing traders to recognize when a move is emerging, maturing, or losing structural strength. By understanding where price is within its cycle, traders gain context: not just what the market is doing, but where it is in its process.

“Trade Regime Transitions” reflects the core trading edge of CRV. Markets alternate between distinct regimes—trending, ranging, accelerating, or reverting. Most losses occur when traders apply the wrong strategy to the wrong regime. CRV is designed to identify when the market structure itself changes: when a range becomes a trend, when a trend becomes exhausted, or when volatility signals a genuine shift in control. By entering at regime transitions rather than during random fluctuations, traders align with the moments where probability and risk-reward are most favorable.

Finally, “Control Volatility Risk” acknowledges that risk is not static—volatility expands and contracts, and position management must adapt accordingly. CRV does not treat price in isolation; it normalizes movement through volatility-aware structure, allowing traders to size risk intelligently, avoid overexposure during unstable conditions, and stay engaged when conditions are favorable. Together, these three pillars—cycles, regimes, and volatility—form a unified framework for disciplined, professional trading: one that replaces noise-driven decisions with structural insight and controlled execution.   

All our published products meet one or more of what we stand for.
Recommended products
Log Returns Indicator
Cedric Jean Guy Pisson
This LogReturnsIndicator.mq5 calculates and displays the logarithmic returns ("log returns") of the closing prices of a financial asset. It computes the log-returns for each period using the formula: log return=ln⁡(close[i]close[i−1]) This measures the relative variation between consecutive closing prices in logarithmic terms, a method often used in finance to analyze the returns of financial assets. Benefits of Log Returns: Logarithmic returns are preferred in certain financial analyses b
This indicator is based on the classical indicator Parabolic SAR and will be helpful for those who love and know how to use not a visual but digital representation of the indicator. All MT5 TimeFrames PSAR indicator shows values from each time frames: M1, M2, M3, M4, M5, M6, M10, M12, M15, M20, M30, H1, H2, H3, H4, H6, H8, H12, D1, W1, AND MN1. You will be able to change the main input parameters for each CCI for every TF. Example for M1 sTF1___ = "M1"; pStep1 = 0.02; pMax1 = 0.2; Input parame
This indicator is based on the classical indicator  Parabolic SAR  and will be helpful for those who love and know how to use not a visual, but digital representation of the indicator.  All TimeFrames PSAR MT5  indicator shows values from each timeframe (M1, M5, M15, M30, H1, H4, D1, W1 and MN1). You will be able to change the main input parameters for each Stochastic from every TF. Example for M1: sTF1 = M1 pStep1 = 0.02 pMax1 = 0.2
Flow Anchor MT5
Kestutis Balciunas
Flow Anchor Indicator is a non-repainting trend engine for MetaTrader 5. It combines a Relative Momentum Index — the average of the standard 14-period RSI on close and the 14-period Money Flow Index on the typical price — with a range-weighted moving average and an ATR-derived adaptive band. The result is a single colored anchor line that tracks the dominant trend, sits below price during bullish phases, sits above price during bearish phases, and never crosses through the candles. State transit
FREE
The Market Structure Analyzer is a powerful tool designed for traders who follow market structure and smart money concepts. This comprehensive indicator provides a suite of features to assist in identifying key market levels, potential entry points, and areas of liquidity. Here's what it offers: 1. Swing High/Low Detection : Accurately identifies and marks swing highs and lows, providing a clear view of market structure. 2. Dynamic Supply and Demand Zones: Draws precise supply and demand zone
Product Overview Low Buy High Sell Radar is an all‑in‑one main‑chart trend‑following and swing‑trading indicator designed for both the   MT4 and MT5   platforms. By building a dynamic trend‑line color‑switching system and combining multi‑period oscillator algorithms (TSI and RSI), a volume‑price momentum model, and a signal‑cooldown filter, it delivers a full range of trading signals covering trend confirmation, overbought/oversold detection, and precise entry and exit. With rigorous logic, cle
Indicator Name : Fourier Transform Curve Indicator Description : The Fourier Transform Curve Indicator for MetaTrader 5 is a powerful tool that leverages Fourier analysis to depict curves directly on your price chart. It is designed to provide valuable insights into the underlying harmonic components of the price data. Parameters : Input Candle Count : This parameter allows you to specify the number of candles to include in the Fourier transformation calculation. A higher value will capture lon
AlgoRex
Haruki Teranaka
4.33 (6)
AlgoRex Dedicated Volatility Adapter ATR (Average True Range) and RSI (Relative Strength Index) to analyze market fluctuations in real time. This function allows you to respond to market fluctuations and capture trend changes. Dynamic Trading Adjustment Function AlgoRex's dynamic trading adjustment function automatically adjusts trading strategies based on the current market environment to accommodate various market conditions. This function optimizes entry and exit points based on real-time
FREE
Stop chasing noise. Start capturing the true structure. Many traders fail not because their strategy is wrong, but because they react too late to price movements. Standard RSI often provides lagging signals or fluctuates wildly in choppy markets, leading to false entries. Velox Trigger VT-RSI was developed to eliminate this "Lag" and "Noise." By redefining RSI as a structural momentum indicator, it allows you to detect trend shifts before they become obvious to the crowd. Key Features: Zero Nois
Necessary for traders: tools and indicators Waves automatically calculate indicators, channel trend trading Perfect trend-wave automatic calculation channel calculation , MT4 Perfect trend-wave automatic calculation channel calculation , MT5 Local Trading copying Easy And Fast Copy , MT4 Easy And Fast Copy , MT5 Local Trading copying For DEMO Easy And Fast Copy , MT4 DEMO Easy And Fast Copy , MT5 DEMO 砖图 Renko PRO->>>   The display of the brick map on the main map. The Renko chart ideally r
FREE
The indicator plots three consecutive channels by Close prices and checks if they match the scheme shown in the screenshots. The length of each channel is not fixed and is selected by the program within the range ChMin and ChMax . When the match is found, a signal is formed (an appropriately colored arrow). A possible stop loss level is displayed as a diamond. A signal may be accompanied by a pop-up window, a push notification and/or an email. The indicator works by Open prices. Parameters ChMi
PF Maximizer MT5
Nguyen Thanh Cong
5 (7)
Introduction The PF Maximizer is a game-changing non-repainting technical tool engineered to help traders distinguish genuine trend signals from erratic market fluctuations. By employing sophisticated algorithms and cutting-edge data analysis, this indicator efficiently filters out unwanted noise, empowering traders to identify the precise starting and ending points of substantial market moves. Signal Potential buy signal is generated when moving average is going up and the blue line cross a
FREE
MA Deviation Overview This indicator displays the deviation rate between price and a moving average, and draws upper/lower bands using standard deviation. Features Deviation Rate Line – Displays how far the price has deviated from the moving average, expressed as a percentage. Formula: Deviation Rate = (Close / Moving Average × 100) − 100 Center Line – The moving average of the deviation rate. Upper/Lower Bands – Statistical upper and lower boundaries calculated using standard deviation. Formul
FREE
This MT5 chart trend checker cuts through the noise of market volatility to provide a clearer picture of trends and price movements. It includes the following features that can provide more clarity during market assessments: 1 customizable multi-period moving average Optional Heikin-Ashi candles 3 switchable focus modes Distinct colors for easy analysis Link to MT4 version: https://www.mql5.com/en/market/product/106708/ This indicator shows your preferred moving average from multiple time fram
FREE
The Corr indicator, also known as the Correlation Indicator, serves as a reference indicator for hedge institutions. It is used to measure the degree of relationship between two or more financial products. In the financial field, especially in the currency market, correlation coefficients are commonly used to study the correlation and degree of relationship between different currencies. Correlation coefficients are typically represented by values ranging from -1 to 1. Here are some common interp
Crypto_Forex Indicator "Weighted Trend Histogram" for MT5, No Repaint. - Weighted Trend Histogram indicator is much more efficient than any standard Moving Averages cross. - It is focused for traders who prefer trend strategies. - Indicator has 2 colors: Yellow for bearish downtrend and Green for bullish uptrend (colors can be changed in settings). - With Mobile and PC alerts. - It is great to combine this indicator with any other trading methods: Price Action, Scalping, Momentum trading, othe
AQUA ind
Tatsiana Buinitskaya
AQUA — analytical indicator that shows the statistics of price behaviour after three-candle patterns across six timeframes. Purpose AQUA studies how often short candle configurations repeat and shows how similar situations statistically ended in the past. Its job is to give the trader an objective statistical picture of how the instrument reacts to a particular three-candle figure; the trading decision stays with the user. On every new candle the indicator encodes the last three closed candles i
Unlock the true power of trend trading with Ultimate MTF Moving Average Pro — a next-generation indicator designed to give you clear, reliable, and actionable signals across all market conditions. This is not just another moving average tool. It is a complete trend intelligence system that combines multi-timeframe analysis , advanced MA algorithms , and precision crossover detection to help you enter trades earlier, stay in trends longer, and exit with confidence. Whether you're scalping gold on
Liquidity Momentum Pulse (LMPX) Description Liquidity Momentum Pulse (LMPX) is a technical indicator designed to measure true market pressure by combining market participation and price acceleration. The indicator calculates: Normalized Volume : Volume / Volume Moving Average Price Momentum : Rate of Change (ROC) The final value is the product of normalized volume and momentum (ROC), generating a composite signal useful for: Detecting price movements supported by above-average participation Ide
FREE
Deposit Supercharger: Optimized Trend Indicator This indicator is based on three technical analysis indicators and two filters, providing more accurate signals. Description: Technical Indicators: The indicator operates based on three technical analysis indicators that help determine the trend direction and potential reversal points. Filters: To filter signals, it uses the price highs and lows from the last two days (support and resistance levels) and a volume indicator, which enhances the signa
# MiniBull Session S/R · MTF VWAP · Auto **A MetaTrader 5 indicator for intraday index and CFD traders who read the market through session structure, volume-weighted price, and multi-timeframe support/resistance.** Version 4.51 · MT5 (MQL5) · Works on any chart timeframe --- ## What it is MiniBull Session S/R MTF VWAP Auto is an all-in-one context indicator built for people who trade indices (NAS100 and similar) intraday, around session opens, prior-day levels, and volume-weighted fair valu
Cyclic Smoothed RSI
David Iommi
2.5 (2)
This indicator is an MQL5 port inspired by the "Cyclic Smoothed RSI" concept originally developed by Dr_Roboto and popularized by LazyBear and LuxAlgo on TradingView. The Cyclic Smoothed RSI (cRSI) is an oscillator designed to address the two main limitations of the standard RSI: lag and fixed overbought/oversold levels. By using digital signal processing (DSP) based on market cycles, the cRSI reduces noise without sacrificing responsiveness.  It features Adaptive Bands that expand and contract
FREE
BeST_Keltner Channels Strategies MT5   is an  MT5  Indicator based on the original Keltner Channels Indicator and it can display in the Chart all the known Variations of Keltner Channels and also the corresponding 10 totally Strategies. Every such generally consists of a Central Moving Average Line and two Boundary Bands at a distance above and below it and can be traded mainly in a Trending Mode but also in a Ranging ReEntry Mode.  BeST_Keltner Channels Strategies Indicator Draws definite Buy
ORB Framework
Laurentiu-marian Ghinda
ORB Framework - Opening Range Breakout, built to be tested before it is traded ORB Framework automates the Opening Range Breakout: it measures the high and the low of the first minutes of a session, then trades the breakout of that range. Every part of the method is an input, so you can rebuild the classic ORB variants, test your own idea in the Strategy Tester and run exactly the same logic live. It is a framework, not a black box. It does not promise profits and it is not optimized for you.
Mogalef Bands MT5
Victor Tengo Quiles
Mogalef Bands — Dynamic Range Structure & Target Zones (MT5) Mogalef Bands is a visual market-structure indicator that models price as a dynamic range that shifts in stages. Instead of relying on isolated “signals”, it provides contextual levels to: identify where price is currently “working” (operating zone), locate potential extension areas (targets), and filter market noise through a non-impulsive, stable update logic (with inertia). It is designed for discretionary traders who want clear lev
Improved MACD Histogram (Momentum-Based) The default MACD in MetaTrader 5 displays histogram bars using the MACD line itself , which may react slowly during rapid momentum changes or ranging markets. This version follows the classic MACD histogram definition: Histogram = MACD − Signal This approach focuses on momentum acceleration and deceleration , often revealing changes in market strength before price reversals become obvious. Important notes: This is not a standalone trading system It does
FREE
Micro MACD
Aleksandr Goryachev
MACD  ******************** MACD для платформы секундных графиков Micro . ********************* Секундный график на порядок увеличит точность ваших входов и выходов. Секундный период , в привычном формате,   позволит увидеть то, что ранее было скрыто. Бесплатные индикаторы, дополнят визуальную картину, что, в совокупности выведет вашу торговлю на новый уровень. Идеально подходит как скальперам, так и трейдерам торгующим внутри дня.  Индикатор  MACD для платформы Micro. Входные параметры:
FREE
Strength Radar2
Erick Guimaraes Dos Santos
Strength Radar 02 – Take Your Trading to the Next Level! Hello, trader! If you're looking for a tool to level up your game in forex, Strength Radar 02 is exactly what you need! Developed with passion and expertise, this indicator turns currency strength analysis into something simple and powerful. With it, you'll have a clear view of the real-time performance of AUD, CAD, CHF, EUR, GBP, NZD, JPY, and USD , using indicators like MA, MACD, RSI , and more — all fully customizable your way! Ima
This indicator shows data from 9 currency pairs by your choice for all 9 Time Frames. If a digital value of the RSI is less or equal to DnLevel = 30 (or whatever number you decided to put) then a Green square will appear. This is potentially an oversold condition and maybe a good time to go Long. If a digital value of the RSI is greater or equal to UpLevel = 70 (or whatever number you decided to put) then a Red square will appear. This is potentially an overbought condition and maybe a good time
RSI Scanner is a multi symbol multi timeframe RSI dashboard that monitors Relative Strength Index indicator for price entering and exiting overbought and oversold in up to 28 symbols and 9 timeframes. Download Demo here  (Scans only M2, and M10) Settings description   here MT4 version   here RSI Scanner features: Signals RSI entering and exiting the overbought and oversold zones. Monitors 28 customizable instruments and 9 timeframes at the same time. Supports all 21 timeframes of Metatrader 5
Buyers of this product also purchase
Trend Sniper X
Sarvarbek Abduvoxobov
4.86 (43)
Trend Sniper X is a multi-timeframe trend-following indicator for MetaTrader 5 that helps traders identify trend direction and potential reversal points with clarity and precision. for MT4: https://www.mql5.com/en/market/product/193245 Price Information: The current price is promotional and is subject to change as upcoming updates and new features are released. Bonus Offer: To get the FREE Auto-Trade Assistant EA for this indicator, please message the author after purchasing. Code2Profit Channe
Smart Trend Trading System — MetaTrader 5 Message me on MQL5 after purchase to receive Smart Universal Expert Advisor for FREE, plus the online course, PDF manual, and private group access. STTS brings trend direction, entry and exit signals, reversal zones, and important price levels together on your chart. Follow the system manually, or connect a separate compatible EA for automated execution using your chosen settings. ONE SYSTEM. FOUR TRADING APPROACHES. STTS organizes its trading approaches
A new King in town - Indicator + Order management indications(tp1+tp2+tp3) + Optional Telegram Signal sender   INCLUDED (FREE) + Bonus EA Robot ( FULL TRADING  and SIGNAL SYSTEM ) Our best EA for Gold: Gold Slayer TRY > Reversion Queen  Expert advisor >JOIN Community Channel < NEW Free Automation EA link < click here ( disclaimer: this is new and still on testing and phase , use at your risk on demo) Free Telegram Bridge < click here  This indicator includes an advanced Strategy, a trading sys
Zoryk Gold
Reda El Koutbane
4.78 (18)
discount ends SOON next price 69 $ ZORYK — Advanced XAUUSD Signal System for MetaTrader 5 You know the feeling. You spend time analyzing gold. You wait for the entry. You finally open the trade, and price immediately moves against you. You close too early, move the Stop Loss or hesitate for a few seconds. Then the market reaches the exact destination you originally expected without you. The direction was not always the problem. The real problem was uncertainty. You did not know exactly where th
M5 Sniper
MeanFX
5 (3)
Get your trading edge in the line of sight M5 Sniper   is a new indicator by MeanFX. It combines   precise trading signals   with   adaptive TP/SL levels   - creating best possible statistical trades as a result! The price increases every 5 purchases, the next price is 79$ Message me after purchase to receive tips/guide and bonus EA Auto Optimisation only works on LIVE chart , needs data feed >JOIN Community Channel < What makes it stand out?   Proven statistical performance   on Gold XAUUSD
SuperScalp Pro
Van Minh Nguyen
4.54 (37)
SuperScalp Pro - Professional Multi-Layer Confluence Scalping System SuperScalp Pro is an advanced scalping indicator that upgrades the classic Supertrend with multiple intelligent confirmation filters. It helps you identify higher-probability Buy/Sell opportunities while significantly reducing false signals. Clear Buy and Sell arrows appear directly on the chart, along with automatic ATR-based Stop Loss and Take Profit levels calculated in real time. After purchase, please message me on MQL5 to
In 2019 I showed the whole world what this indicator can do. I traded its signals by hand, on a real account, in the open — the account was monitored live on Myfxbook, and I covered my experiment in detail on Facebook. The result: $10,000 became $941,411 in four months. The risk was deliberately extreme — the drawdown reached 54%, because in our profession profit and risk always go hand in hand. The Myfxbook screenshot is the first picture in the gallery. Looks like congratulations are in order:
ULTRA is a technical indicator that operates on an “all-in-one” basis—it independently analyzes the market, generates trading signals, displays levels for setting stop-loss orders, and suggests when to close trades to lock in profits or minimize losses. In other words, it doesn't matter if you don't know how to analyze the market, determine levels—where to set your stop-loss—or struggle with money management. ULTRA will do all of that for you! BUYER BONUS: After purchasing the ULTRA indicator, s
SMC Intraday Formula
VividMind Digital Solutions
5 (26)
Secure the Lowest Price Today. After purchase, contact via   MQL5 inbox   to receive your buyer kit and bonus. Let's be honest first. No indicator will make you profitable on its own. If someone tells you otherwise, they're selling you a dream. Every indicator that shows perfect buy/sell arrows can be made to look flawless — just zoom into the right window of history and screenshot the winners. We won't do that. SMC Intraday Formula is a tool. It reads the market structure for you, maps the hig
Gann Made Easy   is a professional and easy to use Forex trading system which is based on the best principles of trading using the theory of W.D. Gann. The indicator provides accurate BUY and SELL signals including Stop Loss and Take Profit levels. You can trade even on the go using PUSH notifications. PLEASE CONTACT ME AFTER PURCHASE TO GET TRADING  INSTRUCTIONS   AND GREAT EXTRA INDICATORS  FOR FREE! Probably you already heard about the Gann trading methods before. Usually the Gann theory is a
M1 Sniper MT5
Oleg Rodin
5 (7)
M1 SNIPER  is an easy to use trading indicator system. It is an arrow indicator which is designed for M1 time frame. The indicator can be used as a standalone system for scalping on M1 time frame and it can be used as a part of your existing trading system. Though this trading system was designed specifically for short-term trading, it still can be helpful for all traders. This trading system can be used with any forex pair and time frame, though lower time frames are recommended from M1 up to M
GoldenX Entry MT5
VividMind Digital Solutions
5 (17)
Price will increase by $20 every 10 buyers to maintain premium value. After purchase, contact via   MQL5 inbox   to receive your buyer kit and bonus. You have probably tested dozens of indicators before. But we are not here to be “just another signals indicator.” Behind GoldenX Entry is intensive research & development focused on building sophisticated algorithms designed to adapt to the real behavior of every instrument — not generic signals recycled everywhere else. From advanced Auto Optim
Next Update — Version 2.52 Coming Soon! [NEW] Get Ready for 4 Major New Features Designed to Enhance Your Market Analysis and Trading Workflow We’re taking market analysis to the next level with 4   new features designed to meet your trading needs. Introducing: TRADE OVERVIEW DASHBOARD CONFLUENCE AT ZONE STRONG & WEAK HIGH/LOW OPTIMAL TRADE ENTRY  —   OTE 1. TADE OVERVIEW DASHBOARD  A dashboard that helps you understand the overall market picture more easily, providing guidance to support yo
Auto Optimized SpeedAngle is an institutional-grade momentum vectoring system that eliminates curve-fitting through continuous Walk-Forward Optimization (WFO). Rather than relying on static inputs that degrade when market regimes shift, the indicator dynamically recalibrates its parameters using Out-of-Sample (OOS) validation, ensuring the displayed signals represent genuine statistical edges rather than historical anomalies. By shifting the focus from subjective visual angles to normalized, qua
Atomic Analyst MT5
Issam Kassas
4.5 (64)
Atomic Analyst — MetaTrader 5 Message me on MQL5 after purchase to receive Smart Universal Expert Advisor for FREE, plus the online course, PDF manual, and private group access. Atomic Analyst brings price action, trend direction, entry and exit signals, Stop Loss and multiple Take Profit levels together on your chart. SEE THE SIGNAL. UNDERSTAND THE SETUP. Atomic Analyst organizes its analysis into clear visual information: • Buy and sell arrows to identify potential entries. • Stop Loss and mul
Boba Analysis Suite
Trade Ready Solutions LLC
5 (2)
Boba Analysis Suite Boba Analysis Suite is an analytical indicator for MetaTrader 5. It brings market structure, relevant price zones and broader market context together in a single chart view. Developed through practical experience as a trader and trading coach, it supports a structured analysis process: assessing market direction, identifying important levels and considering multiple timeframes together. Analysis in Context Individual signals gain meaning through context. Boba Analysis Suite h
Multi Currency Strength and Momentum Indicator MT5 Dynamic Forex28 Navigator is the evolution of our long-time, popular indicators, combining the power of three into one: Advanced Currency Strength28 Indicator (700 reviews) Advanced Currency IMPULSE with ALERT (530 reviews) CS28 Combo Signals (recent Bonus) The two predecessor indicators together have received more than 1,200 reviews on the MQL5 Market and have been a staple in the MT4 community since 2016. Dynamic Forex28 Navigator MT5 carries
Gold Trend Coach MT5
Cristhian Alexander Gaibor Cuasquer
5 (3)
Gold Trend Coach is a gold (XAUUSD) trend indicator for MetaTrader 5 with buy and sell signals, stop loss and three take profit targets, confirmed on bar close, a multi-timeframe coach dashboard and alerts to your phone and Telegram. Built for M5 scalping and M15 intraday during the London and New York sessions. Gold Trend Coach: XAUUSD gold trend signals with entry, stop and three targets. Launch price $39 for the first 20 copies, next price $59. Write me after purchase and your buyer kit is o
Zain Gold Scalping
Ahmed Gamal Abdel Nasser Mohamed
A complete price-action analysis tool built around dual independent entry logic, each confirmed against a volatility band, combined with a configurable set of nine optional confirmation filters that let you shape exactly how conservative or aggressive the tool's signals behave. Core Strategy Two independent entry setups, each triggering only when price moves outside a dynamic volatility band — giving two distinct ways to spot potential reversal points, which can be used together or separately.
FiboSniper Pro
Van Minh Nguyen
5 (4)
FiboSniper Pro - Multi-Filter Fibonacci System with Auto SL/TP and Control Panel FiboSniper Pro is a technical indicator that combines dynamic Fibonacci Envelopes with multiple confirmation filters to generate selective Buy and Sell signals. Fibonacci levels are calculated from Moving Average and ATR, then filtered by ADX, EMA, RSI, ATR, Volume, Time and Candle structure. The indicator displays automatic ATR-based Stop Loss and Take Profit levels directly on the chart, along with an interactive
Power Candles MT5
Daniel Stein
4.58 (12)
Power Candles - Self-Optimizing Strength Indicator Strength usually lives in a sub-window. The line runs below, the candle above, and your eye keeps connecting the two. Power Candles puts the strength into the candle itself, colored from dark red to dark green, so the chart reads at a glance and the sub-window stays closed. The indicator also finds its own settings for the symbol and timeframe in front of you. One click on [ Apply Best ] draws entry, Stop Loss and Take Profit at the exact prices
Quantum TrendPulse
Bogdan Ion Puscasu
5 (26)
Introducing Quantum TrendPulse , the ultimate trading tool that combines the power of SuperTrend , RSI , and Stochastic into one comprehensive indicator to maximize your trading potential. Designed for traders who seek precision and efficiency, this indicator helps you identify market trends, momentum shifts, and optimal entry and exit points with confidence. Key Features: SuperTrend Integration: Easily follow the prevailing market trend and ride the wave of profitability. RSI Precision: Detect
Tokyo mt5 Indicator
Vasiliy Strukov
5 (13)
Tokyo Indicator provides a clear visual overview of trend direction, potential trading signals, and market conditions. Its colour-coded, stepped trend line distinguishes bullish phases in blue from bearish phases in magenta. Matching directional arrows highlight potential buying and selling opportunities when the displayed trend changes. An integrated dashboard brings together the current signal, market bias, momentum, volatility, and signal quality in one convenient view. This allows traders t
Adaptive Price Action Engine Buy Indicator- Get EA Based on it for FREE. Self-Optimizing Multi-Timeframe Trend & Candlestick Intelligence Markets do not behave the same way all the time—and not every price-action pattern has the same value in every market regime. Adaptive Price Action Engine is designed to adapt to changing market conditions by combining trend structure, multi-timeframe analysis, candlestick patterns, and statistical optimization into one analytical framework. Two Adaptive Mode
Trend Catcher ind mt5
Ramil Minniakhmetov
5 (18)
TREND CATCHER INDICATOR Trend Catcher Indicator analyzes market price movements, using a combination of the author’s proprietary and customized adaptive trend-analysis indicators.  It identifies the true market direction by filtering out short-term noise and focusing on underlying momentum strength, volatility expansion, and price structure behavior.  It also uses a combination of smoothing and trend-filtering customized indicators such as moving averages, RSI, and volatility filters.   Real ope
Superhero
Ihor Otkydach
5 (3)
The SUPERHERO indicator is a multi-currency trading system designed on an "all-inclusive" basis. The indicator independently analyzes the market and provides signals on when to open and close trades. It uses Stop Loss and Take Profit orders. The R:R ratio is 1:1. This system can send push notifications to your smartphone, so you can place trades "on the go" without needing to be tied to a PC. It's perfect for proprietary trading firms. A BONUS FOR EVERY CUSTOMER: Every buyer of this indicator wi
Neuro Poseidon MT5
Daria Rezueva
4.75 (52)
Neuro Poseidon is a new indicator by Daria Rezueva. It combines precise trading signals with adaptive TP/SL levels - creating best possible trades as a result! Message me and get  Neuro Poseidon Assistant  as a gift to automize your trading process! What makes it stand out? 1. Proven profitability on all assets and timeframes 2. Only confirmed BUY and SELL signals present on the chart 3. Adaptive TP & SL levels generated by the software for each trade 4. Easy to understand - suitable for al
Azimuth Pro
Ottaviano De Cicco
5 (7)
Azimuth Pro V2: Synthetic Fractal Structure and Confirmed Entries for MT5 Overview Azimuth Pro is a multi-level swing structure indicator by Merkava Labs . Four nested swing layers, swing-anchored VWAP, ABC pattern detection, three-timeframe structural filtering, and closed-bar confirmed entries — one chart, one workflow from micro-swings to macro-cycles. This is not a blind signal product. It is a structure-first workflow for traders who care about location, context, and timing. Halloween P
Unix Scalper
Issam Kassas
4 (4)
Unix Scalper — MetaTrader 5 Message me on MQL5 after purchase to receive Smart Universal Expert Advisor for FREE, plus the online course, PDF manual, and private group access. Find the setup. See the plan. Choose how to trade it. UNIX Scalper brings market analysis, BUY/SELL/WAIT decisions and Entry, Stop Loss, TP1 and TP2 levels into one organized panel. SEE THE SIGNAL AND THE PLAN • Clear decisions: BUY, SELL or WAIT. • Defined levels: Entry, Stop Loss, TP1 and TP2. • Multi-timeframe overvie
OrderFlux – Orderflow Footprint Chart, Volume Profile & Market Profile Indicator for MetaTrader 5 OrderFlux is an order flow footprint indicator for MetaTrader 5 that explains itself. It opens the single candle and shows what happens inside it: the volume traded at every price level, split into aggressive buyers and aggressive sellers. From the ticks it builds a complete footprint chart in real time with delta, imbalance, absorption, volume profile, market profile (TPO), VWAP, cumulative delta (
More from author
CRV Z-Score Engine is a professional market structure indicator that transforms raw price into normalized,  multi-horizon statistical structure model   It reveals: When price is statistically stretched When the market is transitioning between regimes When a move is structurally aligned across multiple horizons This is not a lagging oscillator . It is a multi-horizon statistical structure model built for serious traders. WHAT IS Z-SCORE? Z-Score measures how far price deviates from its n
Filter:
No reviews
Reply to review