NRTR Volatility Engine
- Indicadores
- Versão: 1.0
- Ativações: 5
CRV NRTR Volatility Engine is a professional-grade adaptive trend and market regime indicator built on volatility-normalized price structure.
NRTR (Narrow Range Trend Reversal) is a volatility-adaptive structural algorithm designed to detect genuine market regime changes by identifying when price breaks out of compressed ranges with sufficient volatility confirmation.
It is not just another trailing stop.
It is a true regime detection engine that:
✔ Adapts dynamically to changing volatility
✔ Filters noise in consolidation phases
✔ Detects real structural trend shifts
✔ Visualizes bullish and bearish regimes with precision
This makes it ideal for trend traders, cycle analysts, algorithmic systems, and prop-firm trading rules (no grid, no martingale).
CORE LOGIC (HOW IT WORKS)The indicator computes a volatility-adjusted structural boundary:
V a l u e = E x t r e m e ± K × A T R
Where:
| Component | Meaning |
|---|---|
| Extreme | Highest / lowest price in a dynamic window |
| ATR | Real-time volatility |
| K | User-defined volatility multiplier |
| Dynamic Period | Expands and contracts automatically based on price behavior |
Regime States
Bullish Regime
Bearish Regime
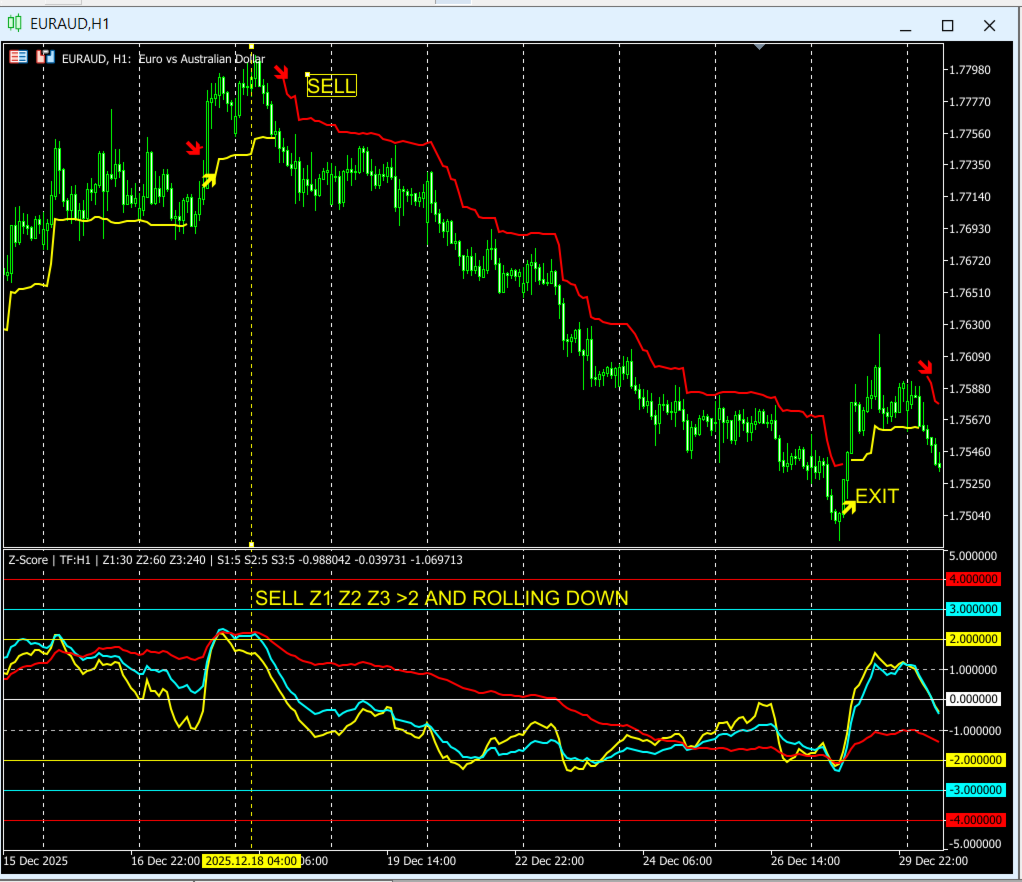
Visual Elements
| Element | Meaning |
|---|---|
| Yellow Line | Bullish structural regime |
| Red Line | Bearish structural regime |
| Yellow Arrow | New bullish regime |
| Red Arrow | New bearish regime |
Simple Trading Logic
Buy Bias
-
Yellow structure active
-
Price above the line
-
Bullish arrow confirms regime shift
Sell Bias
-
Red structure active
-
Price below the line
-
Bearish arrow confirms regime shift
✔ Keeps traders aligned with dominant market direction
✔ Filters out low-quality counter-trend trades
✔ Reduces emotional decision-making
Adaptive Structure
Unlike fixed-window indicators, CRV NRTR dynamically changes its internal period:
✔ Expands during sustained trends
✔ Resets after real structural breaks
✔ Reacts faster in volatility expansion
✔ Smooths during consolidation
This results in:
-
Cleaner trend detection
-
Fewer false reversals
-
Better regime clarity
You are no longer trading price noise — you are trading market structure.
🔴 ADVANCED LEVEL — “MARKET REGIME ENGINE”Each arrow represents:
✔ A volatility envelope violation
✔ A structural extreme reset
✔ A true regime transition
Professional Use Cases
✔ Trend confirmation filter
✔ Dynamic trailing stop / invalidation level
✔ Cycle-based entries (Hurst, Wyckoff, CRV Z-Score)
✔ Prop-firm compliant trend logic
1️⃣ Chandelier Exit vs CRV NRTR
| Feature | Chandelier Exit | CRV NRTR Volatility Engine |
|---|---|---|
| Trailing Stop | ✔ | ✔ |
| Uses ATR | ✔ | ✔ |
| Tracks Extremes | ✔ | ✔ |
| Dynamic Lookback | ❌ | ✔ |
| Regime Detection | ❌ | ✔ |
| Structural Trend Engine | ❌ | ✔ |
| Noise Filtering | Moderate | Adaptive |
| Designed for Entries | ❌ | ✔ |
Chandelier Exit is primarily an exit tool.
CRV NRTR is a full structural trend and regime engine that:
➡ Identifies when the market itself has changed, not just where a stop should trail.
2️⃣ SuperTrend vs CRV NRTR
| Feature | SuperTrend | CRV NRTR Volatility Engine |
|---|---|---|
| ATR-Based | ✔ | ✔ |
| Trend Direction | ✔ | ✔ |
| Fixed Multiplier | ✔ | ❌ (Adaptive) |
| Dynamic Period | ❌ | ✔ |
| Regime Awareness | ❌ | ✔ |
| Structural Extremes | ❌ | ✔ |
| Whipsaw Filtering | Weak in ranges | Strong via adaptive structure |
| Trend Maturity Awareness | ❌ | ✔ |
SuperTrend uses: Price ± Multiplier × ATR …with fixed parameters, making it sensitive to chop.
CRV NRTR:
✔ Adapts both volatility and structure
✔ Resets on true market breaks
✔ Avoids frequent flip-flops in sideways markets
➡ Result: Fewer false signals, cleaner trends, better risk structure.
CRV – Detect Market Cycles. Trade Regime Transitions. Control Volatility Risk.
CRV is built on the principle that markets do not move randomly—they evolve through recurring cycles, shifting regimes, and changing volatility.
“Detect Market Cycles” means identifying the natural expansion and contraction phases in price behavior, where accumulation, trend development, and exhaustion repeat over time. Instead of reacting to individual candles or lagging indicators, CRV focuses on the underlying rhythm of the market, allowing traders to recognize when a move is emerging, maturing, or losing structural strength. By understanding where price is within its cycle, traders gain context: not just what the market is doing, but where it is in its process.
“Trade Regime Transitions” reflects the core trading edge of CRV. Markets alternate between distinct regimes—trending, ranging, accelerating, or reverting. Most losses occur when traders apply the wrong strategy to the wrong regime. CRV is designed to identify when the market structure itself changes: when a range becomes a trend, when a trend becomes exhausted, or when volatility signals a genuine shift in control. By entering at regime transitions rather than during random fluctuations, traders align with the moments where probability and risk-reward are most favorable.
Finally, “Control Volatility Risk” acknowledges that risk is not static—volatility expands and contracts, and position management must adapt accordingly. CRV does not treat price in isolation; it normalizes movement through volatility-aware structure, allowing traders to size risk intelligently, avoid overexposure during unstable conditions, and stay engaged when conditions are favorable. Together, these three pillars—cycles, regimes, and volatility—form a unified framework for disciplined, professional trading: one that replaces noise-driven decisions with structural insight and controlled execution.
All our published products meet one or more of what we stand for.