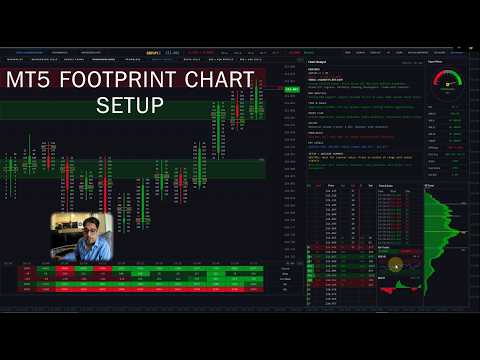
Order flow footprint chart

5
Footprint Chart Pro — Professional OrderFlow EA for MetaTrader 5

Version 6.34 | Professional tool for real traders | Institutional-Grade Visualization

DEMO USERS - PLEASE SELECT EVERY TICK / REAL TICK WHEN TESTING AND YOU HAVE DOWNLOADED HISTORICAL DATA. IF YOU SEE A WAITING SCREEN AND IT IS NOT DOWNLOADING, IT MEANS YOU HAVE LOW HISTORICAL DATA. TRY 1 MIN AND 5 MIN FIRST ON 1 DAY DATA. ONE DAY DATA SHOULD BE THE NEWEST AND MOST CURRENT DATE. PLEASE WAIT UNTIL THE MARKET HAS ROLLED OVER PERIOD.


IMPORTANT - Recommended Price Bucket in Points for Pairs:


XAUUSD - 40 BTCUSD - 1000 UK100 - 30 DE40 - 100 CADJPY - 5
GBPUSD - 5 EURUSD - 5 US30 - 100 AUDCAD -5 EURGBP -3
GBPJPY - 10 USDCAD - 5 NAS100 - 100 AUDJPY - 5 EURJPY - 10
USDJPY - 10 USDCHF - 5 SP500 - 30 AUDUSD - 6 GBPCAD - 5


Overview

Footprint Chart Pro is a comprehensive, institutional-grade order flow visualization Expert Advisor for MetaTrader 5. Built entirely on a high-performance rendering engine, it delivers real-time bid/ask footprint data, market depth analysis, time & sales tracking, volume profiling, and intelligent market analysis — all within a single, fully configurable multi-panel interface. 


Feature Summary

  • 9 switchable footprint styles — Minimalist, Background Cells, Candle Frame, Volume Profile Candle, Frameless, Middle Candle, Delta Cells, Bid x Ask Profile, Bid x Ask Cells.

  • 6-level cell intensity colouring — 3 buyer tiers + 3 seller tiers with configurable percentage thresholds.

  • 3-tier diagonal imbalance detection with per-tier colours and text size boost.

  • Live DOM panel — broker order book feed, bid/ask depth, executed volume, flash alerts, bar totals.

  • Session Volume Profile — 3 modes, 4 display types (Total / Delta / Buy / Sell), POC + VAH + VAL.

  • Time & Sales tape — live tick stream with direction, volume, and large-order highlighting.

  • Embedded RSI and MACD indicators within the panel stack.

  • Signal Meter gauge — MA alignment, ATR regime, POC acceptance, and volume bias combined.

  • Chart Analyst panel — 9-category commentary with a 6-factor scored trade setup summary.

  • Automated Supply & Demand zones — swing detection, volume filter, ATR-scaled width.

  • Economic Fundamentals panel — upcoming news events with auto-refresh.

  • Mini Session Chart — compact overview for a defined session window.

  • Interactive button bar — Supply & Demand Zones, Fundamentals Panel, Mini Chart, Zoom In/Out, Up/Down, Reset, VP, Delta Bars, Side Panels.

  • Fully collapsible interface — style strip, summary table, and side panels each collapse independently.

  • Runtime toggles for per-bar Volume Profile overlay and Delta Bar strip.

  • 16 built-in colour themes, dark/light palette, per-style imbalance colour sets, full per-element control.

  • Tick volume inference engine

  • Coloured Candle countdown timer

  • Dual font system — proportional for labels, monospace for all numerical data.


1. Nine Switchable Footprint Display Styles

The EA provides nine distinct visualisation modes, switchable on the fly via header buttons, each designed for a different analytical preference:

  • Minimalist — Clean text-only Bid x Ask display with no cell backgrounds, ideal for clutter-free reading.

  • Background Cells — Colour-filled cells where intensity is graded across six levels of volume dominance (three buyer tiers and three seller tiers), giving an immediate visual heat map across the bar. High, Medium, and Low thresholds are configurable as percentage values, and each of the six intensity colours is individually adjustable.

  • Candle Frame — Traditional hollow OHLC candle outline overlaid with internal bid/ask data, combining price action and order flow in one view.

  • Volume Profile Candle — Integrates a per-bar volume histogram directly inside the candle body, showing volume distribution by price level. The histogram applies the same six-level intensity colour system (three buyer tiers: High, Medium, Low; three seller tiers: High, Medium, Low) so dominant levels are instantly distinguishable. A neutral colour is applied to balanced levels, and all seven colours are independently configurable or can inherit the global theme.

  • Frameless — Thin candle on the left side with floating bid/ask data with no cell borders, providing a clean open layout.

  • Middle Candle — A compact centre-bar representation with POC outline highlighting, useful on smaller timeframes.

  • Delta Cells — Displays net delta (buy volume minus sell volume) per price level as a single value, cutting through noise to show net aggression.

  • Bid x Ask Profile — A horizontal profile bar chart overlaid on each bar representing cumulative bid and ask volume per level.

  • Bid x Ask Cells — Full cell-based presentation with separate bid and ask columns, mirroring professional footprint chart conventions


2. High-Performance Rendering Engine

The entire interface is drawn using MetaTrader 5's internal rendering engine API rather than chart objects, delivering significant performance advantages:

  • All panels (main footprint, DOM, Volume Profile, Time & Sales, Signal Meter, Analyst) are rendered as layers, minimising redraws.

  • Intelligent  panel caching avoids unnecessary re-renders when data has not changed.

  • Configurable refresh rate in milliseconds (default 100 ms) allows traders to balance real-time responsiveness with CPU overhead.


3. Three-Tier Diagonal Imbalance Detection

The imbalance engine identifies diagonal bid/ask imbalances across adjacent price levels 

  • Three independent ratio thresholds (Level 1, Level 2, Level 3) allow traders to distinguish between moderate, strong, and extreme imbalances.

  • Each imbalance tier renders with a distinct colour and optional text size boost (configurable per-level), making imbalance stacks immediately visible.

  • A minimum volume filter prevents false signals from illiquid price levels with negligible activity.

  • Imbalance colours are independently configurable per footprint style (all 9 styles have individual colour sets), meaning each display mode can carry its own visual language.

  • Once a historical bar's imbalances are computed they are locked, preventing recalculation overhead on bars that are no longer live.

  • The Chart Analyst panel uses imbalance count ratios across the 10 most recent bars to infer institutional directional activity.


4. Live Depth of Market (DOM) Panel

A dedicated DOM panel renders the live order book alongside executed volume data:

  • Supports real broker MarketBook depth feed (OnBookEvent) for live Level II data where available from the broker.

  • Displays pending Bid and Ask orders at each price level together with executed Buy and Sold volume, giving a complete picture of both passive and aggressive activity.

  • Net Delta column and total Volume column shown per level.

  • Current price row highlighted in a distinct colour for instant price location awareness.

  • Flash animation on levels where significant volume hits, providing visual alerts of large order absorption.

  • Configurable number of visible levels (default 12) and panel dimensions.

  • Optional grid lines for easier level-to-level reading.


5. Session Volume Profile (SVP) Panel

A right-side session volume profile provides a statistical view of volume distribution over a configurable time window:

  • Three operating modes: fixed bar count, session start time, or daily reset at 00:00 — covering intraday, session, and daily profile use cases.

  • Four display types: Total Volume, Delta (Buy minus Sell), Buy Volume Only, or Sell Volume Only, switchable via the input settings.

  • Point of Control (POC), Value Area High (VAH), and Value Area Low (VAL) lines drawn across the profile with configurable colours.

  • Bar width scale factor allows the profile histogram width to be expanded or compressed independently of the panel size.

  • Session POC line is also projected across the main footprint chart as a horizontal reference, automatically tracking as new data arrives.

  • Volume intensity colours inherit the global theme or can be overridden independently.


6. Time & Sales (T&S) Panel

A streaming tape panel captures and displays every inferred trade tick in real time:

  • Scrolling list of timestamped trades showing price, volume, and direction (Buy / Sell / Neutral), colour-coded for instant classification.

  • Configurable big-order threshold: trades above the threshold are highlighted with a distinct background to flag large participants.

  • Maximum trade history and visible row count are both configurable, allowing the list to be tuned to screen real estate.

  • Bar totals shown at the bottom of the T&S panel: cumulative Buy volume and Sell volume for the current bar alongside a Buy/Sell ratio.

  • The Chart Analyst panel reads the most recent 50 T&S trades and computes a buy/sell percentage split to generate a qualitative tape sentiment reading.


7. Embedded RSI and MACD Indicators

Two classic momentum indicators are built directly into the panel stack beneath the Time & Sales list:

  • RSI(14) rendered as a line chart with configurable overbought (default 70) and oversold (default 30) reference levels, period length, and line colour.

  • MACD with configurable fast EMA, slow EMA, and signal period displayed as a histogram with zero line for quick divergence spotting.

  • Both indicators share the same panel height settings and update every render cycle, staying in sync with live price action.


8. Signal Meter Panel (Gauge Dial)

A visual sentiment gauge provides an at-a-glance directional reading derived from multiple internal signals:

  • Analogue dial with a sweeping pointer indicating a spectrum from Strong Sell through Neutral to Strong Buy.

  • Signal calculation incorporates three moving averages (MA9, MA21, MA50 by default), ATR regime detection (trend vs. chop), POC acceptance logic, and volume bias.

  • ATR ratio thresholds allow the meter to distinguish between trending and ranging market regimes and modulate signal strength accordingly.

  • POC acceptance parameters (minimum bar count and tick distance) prevent premature signal generation before price has confirmed a level.

  • All colours — bullish, bearish, neutral, pointer, background — are independently configurable.


9. Chart Analyst Panel — Multi-Factor Intelligence Engine

The Chart Analyst is a standalone analysis panel that synthesises data from all active sub-systems into structured, human-readable market commentary:

Sections displayed:

  • Pair Info — Symbol, timeframe, daily price change (points and percentage).

  • Trend + Higher TF | ATR — MA alignment assessment across MA9/21/50 with H4 and D1 higher-timeframe confirmation. ATR(14) value shown in the section header.

  • DOM Analysis — Bid/Ask ratio from the live order book, differentiating between heavy stacking, moderate pressure, and balanced conditions, with near-level focus (within 5 levels of current price).

  • Time & Sales — Buy/sell volume percentage split from the most recent 50 tape trades, classified into five sentiment bands from aggressive buying to aggressive selling.

  • Order Flow — Bar delta and cumulative delta direction used to characterise buying or selling aggression with three intensity bands.

  • Volume — Ask/Bid volume ratio for the current bar, scaled across five categories from heavy buyer dominance to heavy seller dominance.

  • Imbalances — Count of buyer vs. seller imbalances across the 10 most recent visible bars, inferring likely institutional directional activity.

  • Key Levels — Session POC price and daily high/low range.

  • Setup + Advisor Summary — Price position within the daily range combined with trend and flow alignment to generate a directional trade bias recommendation. Final summary scores six independent factors (trend, HTF, order flow, volume, DOM, tape) and outputs a consensus bias label with a score out of six.

The analyst refreshes at a user-defined interval (default 30 seconds) to balance computational load. All commentary text is colour-coded bullish/bearish/neutral for immediate visual classification.


10. Automated Supply & Demand Zones

An integrated swing-based Supply and Demand zone detection engine renders institutional price zones directly on the footprint chart:

  • Zones are identified using swing-high/swing-low detection with configurable swing length and lookback period.

  • Volume ratio filter ensures only swings formed with above-average volume qualify as significant zones.

  • ATR-based zone width scaling adapts zone height to current market volatility rather than using a fixed pip value.

  • Separate colours for Supply (bearish) and Demand (bullish) zones, both defaulting to the active theme colour when set to clrNONE.

  • Zone opacity, maximum number of rendered zones, and volume lookback period are all configurable.

  • Zones render as semi-transparent rectangles on the canvas, updating as price action produces new qualifying swings.


11. Fundamentals Panel

An economic calendar panel displays upcoming fundamental news events relevant to the traded symbol:

  • Configurable panel dimensions and maximum displayed rows.

  • Shows event time, title, affected currency, country code, and importance level.

  • Auto-refreshes at a configurable interval (default 60 seconds).

  • Helps traders contextualise order flow activity against scheduled economic releases.


12. Mini Session Chart

A compact candlestick overview chart provides a higher-level perspective on intraday price action:

  • Renders M1 OHLC data between a configurable session start and end time in local time (HH:MM format).

  • Data is cached for performance, only refreshing when a new tick arrives within the active session window.

  • Panel dimensions are freely resizable.

  • Gives traders a session-level price structure view alongside the tick-by-tick footprint data.


13. Ticker / Info Bar

A header bar at the top of the main panel provides persistent market context:

  • Displays symbol name, current timeframe, and live bid price with up/down change.

  • Daily percentage change shown with bullish/bearish colour coding.

  • Current timeframe trend label (HTF-BULL / HTF-BEAR) derived from the higher-timeframe analysis.

  • MS label (MS-BULL / MS-BEAR) reflecting shorter-timeframe momentum state.

  • Navigation buttons for Zoom In, Zoom Out, scroll Up/Down, Bar Volume Profile toggle, Delta Bars toggle, and Side Panels toggle.


14. Summary Table

A scrollable data table below the main footprint bars displays per-bar statistics:

  • Volume, Delta, Cumulative Delta, and Ask volume rows — one column per visible bar.

  • Positive values rendered with a green background, negative values with a red background for instant sign identification.

  • Cumulative delta is computed and cached across up to 600 bars for historical accuracy.

  • Row height and colour scheme are configurable.

  • Candle countdown timer showing seconds and minutes remaining in the current bar, updating in real time using local clock with color changes with countdown.


15. Per-Bar Volume Profile Overlay

An optional histogram can be rendered inside each footprint bar showing the volume distribution across price levels:

  • Toggle on/off independently of the Session Volume Profile.

  • Configurable histogram width.

  • Separate colours for bid-side and ask-side volume, plus a distinct POC level colour.

  • Uses the same intensity theme as the main cells or a custom override colour set.


16. Delta Bar

A compact bar graphic rendered below each footprint candle provides a quick visual delta summary:

  • Bar fill direction and colour indicate net buying (positive) or net selling (negative) delta for the bar.

  • Configurable height, gap from the candle bottom, and separate positive/negative colours.

  • Delta text label displayed inside the bar, inheriting the global theme colours or using custom overrides.


17. Tick Volume Inference Engine

For brokers that do not provide native real volume, a sophisticated inference system estimates actualised trade volume from tick flow:

  • Each incoming tick is weighted by a scale factor and an additional multiplier for every price-step move in that tick, approximating the size of the market order that caused the movement.

  • Configurable minimum and maximum inferred volume per tick prevent outlier distortion.

  • Toggle switch to enable or disable inference, falling back to raw tick counts when disabled.


18. Extensive Colour Theming System

Every visual element of the EA carries independently configurable colours, with a high-level theme system for rapid global style changes:

  • Six-level cell intensity colour system for the Background Cells and Volume Profile Candle styles: three buyer tiers (Buyer High, Buyer Medium, Buyer Low) and three seller tiers (Seller High, Seller Medium, Seller Low). Each of the six colours is independently configurable. High and Medium intensity thresholds are set as percentage values (default 70% and 40%) — any level with dominance above the High threshold renders in the strongest colour, between High and Medium in the mid tone, and below Medium in the subtle shade, creating a natural visual gradient that immediately reveals where the most aggressive activity occurred within each bar.

  • 16 built-in bull/bear colour themes: Classic Green/Red, Blue/Orange, Cyan/Magenta, Lime/Pink, Gold/Purple, Teal/Coral, Sky/Crimson, Mint/Rose, Orange/Dark Grey, Green/Dark Grey, Navy/Slate, Navy/Gold, White/Dark Grey, Emerald/White, Cherry/Teal, and Olive/Sandy.

  • Dark and Light panel palette modes affect all panel backgrounds simultaneously.

  • A global background colour synchronises all panels to a single base tone, with a one-click reset to defaults.

  • Theme Override All mode forces the selected bull/bear theme colours onto imbalance highlights as well, creating a fully unified visual style.

  • Individual imbalance colour sets for each of the 9 footprint styles, allowing each display mode to carry a unique colour language.

  • Full per-element colour control: candle bodies, fills, wicks, POC highlights, neutral cells, DOM rows, T&S rows, delta bars, signal meter components, and all analyst text states.


19. Flexible Layout and Panel Management

The entire interface is position-aware and freely resizable to accommodate different monitor sizes and chart layouts:

  • Main panel X/Y position and Width/Height configurable via inputs.

  • Each side panel (DOM, SVP, T&S, Signal Meter, Analyst, Fundamentals, Mini Session) has independent width and height settings.

  • Bar width and bar spacing are independently adjustable, allowing the footprint grid density to be tuned to the timeframe and screen resolution.

  • Cell gap and cell padding controls fine-tune spacing within each footprint cell.

  • Candle frame line width (1–4 px) and bid/ask separator width are configurable.

  • Side panels can be hidden as a group via the ticker bar toggle, maximising main chart space when detailed sub-panels are not needed.


20. Font Configuration

Two independent font families are used throughout the interface for typographic clarity:

  • Primary font (default: Segoe UI) used for labels, headers, and analyst commentary.

  • Monospace font (default: Consolas) used for all numerical data — prices, volumes, deltas — ensuring consistent digit-width alignment across all panels.

  • Base, small, and large font sizes configurable independently.

  • Per-level imbalance text size boost: three independent boost values allow imbalance labels to grow with signal severity, making strong imbalances stand out at a glance.


21. Interactive Header Controls & Button Bar

The ticker bar doubles as a full interactive control strip. All buttons are rendered as part of the canvas and respond to mouse clicks without requiring any external chart objects:

Left-Side Feature Toggle Buttons

  • Supply & Demand Zones — Toggles the automated Supply and Demand zone overlay on and off in a single click. The button label reflects the current active state, providing a clear on/off indicator at all times.

  • Fundamentals — Opens and closes the Economic Calendar panel. The panel slides in as an overlay when activated; clicking the button again dismisses it, keeping the main footprint chart unobstructed when macro data is not needed.

  • Mini Session Chart — Toggles the compact intraday candlestick overview panel. The session chart renders a full M1 OHLC view for the defined session window and disappears cleanly when toggled off.

Right-Side Navigation & View Buttons

  • RESET — Instantly restores the footprint chart to its default zoom level and vertical position, snapping the view back to a centred, calibrated baseline in a single click.

  • ZOOM IN — Increases the vertical cell height scale by 20% per click, expanding each price bucket row so individual bid/ask numbers become easier to read on faster timeframes or tighter price ranges.

  • ZOOM OUT — Decreases the vertical cell height scale by 20% per click, compressing the chart to display a wider price range simultaneously — useful for getting a broader context view on slower timeframes.

  • UP — Scrolls the entire footprint chart upward by a fixed pixel step , allowing traders to navigate to higher price levels without losing the current bar's data.

  • DOWN — Scrolls the footprint chart downward by the same step, bringing lower price levels into view. Both UP and DOWN support extended scrolling with a range of ±50,000 px.

  • BAR VOLUME PROFILE — Toggles the per-bar volume histogram overlay on and off at runtime, independently of the input settings. Allows traders to switch between clean cell view and profile view without reloading the EA.

  • DELTA BARS — Toggles the delta bar strip (rendered below each candle) on and off at runtime. Useful when the additional row height is needed for more price levels.

  • SIDE PANELS — Master toggle that shows or hides all right-side panels simultaneously (DOM, Session Volume Profile, Time & Sales, Signal Meter, Chart Analyst). Collapsing all side panels with a single click maximises the horizontal footprint chart area, ideal for focused trade execution or screen recording.


Hover State Feedback

Every button in the header bar responds to mouse hover with a colour highlight transition, giving clear visual confirmation of the active target before clicking. Hover states update continuously as the cursor moves across the panel.


22. Collapsible Panels — Full Minimalist Mode

Every major section of the interface can be collapsed independently, allowing traders to build a minimal, distraction-free layout without removing any functionality. Collapsed panels retain their state and re-expand instantly:

Style Strip (Footprint Style Selector Row)

  • The horizontal row of nine footprint style buttons sits in its own collapsible strip directly below the ticker bar.

  • A small +/− toggle button at the right edge of the strip collapses or expands the entire style row.

  • When collapsed, the strip reduces to a minimal tab height, reclaiming vertical chart space while still being accessible via a single click to re-expand.

Summary Table Strip (Timestamps + Volume/Delta Table)

  • The bottom strip containing bar timestamps, per-bar Volume, Delta, Cumulative Delta, and Ask rows is independently collapsible.

  • A +/− toggle at the right of the timestamp strip collapses the data table rows while keeping the timestamp bar visible as a minimal footer.

  • When collapsed, only the timestamp row remains, preserving time reference without the full statistical rows occupying vertical space.

Side Panels — Individual and Group Collapse

  • All five right-side analysis panels (DOM, Session Volume Profile, Time & Sales, Signal Meter, Chart Analyst) are controlled as a group by the SIDE PANELS button in the header bar.

  • A single click hides the entire side panel column, expanding the footprint chart to fill the full panel width — ideal for a clean chart view or during live trading when panel monitoring is not needed.

  • Clicking SIDE PANELS again instantly restores all panels to their previous positions and dimensions.

Minimalist Workflow

By collapsing the Style Strip, the Summary Table, and the Side Panels simultaneously, the entire interface reduces to a clean footprint chart with only the ticker bar visible — matching a professional minimalist layout while all data and controls remain one click away.


Compatibility & Requirements

  • Platform: MetaTrader 5 (MQL5). Not compatible with MT4.

  • Works on all symbols and all timeframes.

  • Real volume data enhances accuracy; tick volume inference is available for brokers without native volume.

  • Broker DOM feed required for live order book data

  • No external DLLs required.

  • Screen Resolution 1920x1080

  • Good laptop or PC


Best Practices

  • Use on liquid instruments (Forex majors, indices, gold)
  • Lower timeframes (M1-M15) show best order flow detail
  • Combine footprint imbalances with DOM for confirmation
  • Watch for POC tests as support/resistance
  • Use Chart Analyst summary for quick bias assessment
  • Monitor Time & Sales for institutional big orders.


    Updates & Support

    • Regular updates with new features
    • Responsive customer support
    • Detailed documentation included
    • Video tutorials available


    Start Trading Like a Professional

    Stop guessing where the market will go. See the actual order flow and trade with confidence alongside institutional traders.

    Questions? Contact us before purchasing - we're here to help!

    리뷰 2
    zeke21t2
    466
    zeke21t2 2026.04.09 04:04 
     

    I find it invaluable for refining my discretionary scalping tactics by displaying the timeframe in M5. Aside from being difficult for those with presbyopia XD, it's a truly invaluable utility tool, a treasure trove for any trader. Stop guessing where the market will go. See the actual order flow and trade with confidence alongside institutional traders. (by the author) That's absolutely right.

    jackie1289
    24
    jackie1289 2026.02.25 16:04 
     

    excellent supp from dev

    추천 제품
    ClusterSecondForex
    Rafil Nurmukhametov
    4.67 (3)
    The utility allows you to build different types of graphs: Seconds chart from 1 second to 86400 seconds Tick chart from 1 tick and above The volume chart Delta chart Renko chart Range chart Product demo https://www.mql5.com/ru/channels/clustersecondforex Built-in indicators for volumetric analysis: daily market profile and market profile of the selected timeframe, Cluster Search Imbalance VWAP Dynamic POC, VAH, VAL the profile depth of the market vertical volume with various display options, del
    SolarTrade Suite Financial Robot: LaunchPad Market Expert - 거래를 시작하도록 설계되었습니다! 이 거래 로봇은 특별하고 혁신적이며 고급 알고리즘을 사용하여 가치를 계산합니다. 금융 시장의 세계에서 여러분의 조수입니다. SolarTrade Suite 시리즈의 지표 세트를 사용하여 이 로봇을 시작할 순간을 더 잘 선택하세요. 설명 하단에서 SolarTrade Suite 시리즈의 다른 제품을 확인하세요. 투자와 금융 시장의 세계를 자신 있게 탐색하고 싶으신가요? SolarTrade Suite Financial Robot: LaunchPad Market Expert는 정보에 입각한 투자 결정을 내리고 수익을 늘리는 데 도움이 되도록 만들어진 혁신적인 소프트웨어입니다. SolarTrade Suite Financial Robot: LaunchPad Market Expert의 장점: - 정확한 계산: 로봇은 고급 알고리즘과 분석 방법을 사
    표시기는 현재 시세를 작성하여 과거 시세와 비교할 수 있으며 이를 바탕으로 가격 변동을 예측합니다. 표시기에는 원하는 날짜로 빠르게 이동할 수 있는 텍스트 필드가 있습니다. 옵션: 기호 - 표시기가 표시할 기호 선택. SymbolPeriod - 지표가 데이터를 가져올 기간 선택. IndicatorColor - 표시기 색상. HorisontalShift - 지시자가 그린 따옴표를 지정된 막대 수만큼 이동합니다. Inverse - true는 인용 부호를 반대로, false - 원래 보기를 반전합니다. ChartVerticalShiftStep - 차트를 수직으로 이동합니다(키보드의 위/아래 화살표). 다음은 날짜를 입력할 수 있는 텍스트 필드의 설정으로, '엔터'를 누르면 즉시 이동할 수 있습니다.
    ClusterSecond
    Rafil Nurmukhametov
    4.78 (32)
    The utility allows you to build different types of graphs: Seconds chart from 1 second to 86400 seconds Tick chart from 1 tick and above The volume chart Delta chart Renko chart Range chart Demo version of the utility https://www.mql5.com/ru/channels/clustersecond Built-in indicators for volumetric analysis: daily market profile and market profile of the selected timeframe, Cluster Search Imbalance VWAP Dynamic POC, VAH, VAL the profile depth of the market vertical volume with various display op
    Blahtech Market Profile MT5
    Blahtech Limited
    5 (10)
    Was: $249  Now: $99   Market Profile defines a number of day types that can help the trader to determine market behaviour. A key feature is the Value Area, representing the range of price action where 70% of trading took place. Understanding the Value Area can give traders valuable insight into market direction and establish the higher odds trade. It is an excellent addition to any system you may be using. Inspired by Jim Dalton’s book “Mind Over Markets”, this indicator is designed to suit the
    Trading Utility for Forex Currency Pairs Only not for Gold  Functions Auto Lot Calculation based on Risk Auto stoploss  Auto TakeProfit Breakeven Auto Close Half % Close in percentage with respect to the PIPs Pending Orders BuyLimit Sell Limit with distances BuyStop Sell Stop    with distances Trading Informations Risk in percentage For Multiple trades Combine Takeprofit and Combine Stoplosses
    Quantum Levels PRO — 가격이 도달하기 전에 방향을 파악하세요 MT5 노 리페인팅 가격 목표 지표 | 버전 3.10 90%의 지표가 가진 문제: 이미 일어난 일 만 알려줍니다. 이동평균, RSI, MACD — 움직임이 끝난 후 에야 반응합니다. 신호가 나올 때쯤이면 최적의 진입 시점은 지나가 버렸습니다. Quantum Levels PRO는 다릅니다. 움직임이 아직 진행 중일 때 가격이 다음에 향할 정확한 목표가를 계산합니다. 여정이 끝나기 전에 목적지를 미리 볼 수 있습니다. 후행 분석이 아니라 선행 분석입니다. Quantum Levels PRO의 기능 모든 상품——주식, 외환, 암호화폐, 원자재, 지수——의 스윙 구조를 분석하고 매 순간 4가지 정확한 가격 목표를 투사합니다: UP Trend Target — 최근 스윙 에너지 기반 최대 상승 수준. 매수 익절, 또는 매도 반전 진입. UP Correction Target — 최소 상승 수준, 보수적 강세 목표. 매수
    Mine Farm
    Maryna Kauzova
    Mine Farm is one of the most classic and time-tested scalping strategies based on the breakdown of strong price levels. Mine Farm is the author's modification of the system for determining entry and exit points into the market... Mine Farm - is the combination of great potential with reliability and safety. Why Mine Farm?! - each order has a short dynamic Stop Loss - the advisor does not use any risky methods (averaging, martingale, grid, locking, etc.) - the advisor tries to get the most
    Delta Profile Volume
    Teresinha Moraes Correia
    기술 설명 – MetaTrader 5용 Delta Profile Delta Profile 은 MetaTrader 5에서 정의된 캔들 범위 내의 거래량 흐름을 세부적으로 분석하기 위해 설계된 지표입니다. 이 도구는 각 가격 수준에서 양의 거래량(상승과 관련) 과 음의 거래량(하락과 관련) 간의 불균형을 구조화하고 시각화합니다. 이를 통해 사용자는 실제로 거래가 집중되는 가격 영역과 시장 불균형이 형성되는 구간을 명확하게 파악할 수 있습니다. 핵심 개념 지표는 가격 레벨 을 인식하고 이를 양의 거래량, 음의 거래량 및 순 델타(양-음 차이)로 분류합니다. 각 가격 레벨은 수평 막대 로 차트에 표시되며, 거래가 집중되는 구간을 직관적으로 보여줍니다. 사용자는 분석할 캔들의 개수 , 가격 반올림 정밀도 , 최대 표시 레벨 수 , 표시 옵션 등을 직접 설정할 수 있습니다. 주요 기능 가격 레벨 매핑 : 사용자가 지정한 자릿수에 맞게 가격을 반올림하여 거래량을 집계합니다. 순 델타 계산 : 양
    Blahtech Supply Demand MT5
    Blahtech Limited
    4.54 (13)
    Was: $299  Now: $99  Supply Demand uses previous price action to identify potential imbalances between buyers and sellers. The key is to identify the better odds zones, not just the untouched ones. Blahtech Supply Demand indicator delivers functionality previously unavailable on any trading platform. This 4-in-1 indicator not only highlights the higher probability zones using a multi-criteria strength engine, but also combines it with multi-timeframe trend analysis, previously confirmed swings a
    VR Grid Mt5
    Vladimir Pastushak
    3.25 (8)
    VR 그리드 표시기는 사용자 정의 설정으로 그래픽 그리드를 생성하도록 설계 되었습니다. 표준 그리드 와 달리 VR 그리드는 원형 레벨 을 구축하는 데 사용됩니다. 사용자의 선택에 따라 라운드 수준 사이의 단계는 임의적일 수 있습니다. 또한 VR Grid는 다른 인디케이터나 유틸리티와는 달리 기간이 바뀌거나 단말기를 재부팅해도 그리드의 위치 를 유지합니다. 설정, 세트 파일, 데모 버전, 지침, 문제 해결 등은 다음에서 얻을 수 있습니다. [블로그] 다음에서 리뷰를 읽거나 작성할 수 있습니다. [링크] 버전 [MetaTrader 4] 수직 수준 은 실제 시간 간격을 기준으로 하며 누락 또는 존재하지 않는 기간은 무시 합니다. 따라서 레벨 사이의 단계는 사용자가 선택한 값과 엄격하게 일치합니다. VR 그리드 표시기를 사용할 때 트레이더는 모든 수준에서 스타일 , 수직선 및 수평선의 색상 및 두께를 변경할 수 있습니다. 이를 통해 금융 상품의 라운드 수준 을 제어할 수 있습니다. 라운
    FREE
    Time and Sales Tick
    Pablo Filipe Soares De Almeida
    Time & Sales Tick Indicator 는 MetaTrader 5 차트에서 실시간 거래 틱 정보를 표시하는 지표입니다. 가격, 틱 거래량 및 시간을 시각적으로 보여주며, 사용자가 시장 미세 구조를 분석할 수 있도록 도와줍니다. 기능 설명 가격, 거래량 및 시간을 포함한 틱 데이터를 차트 내 패널에 실시간으로 표시합니다. 틱 데이터를 사용자가 지정한 시간 또는 수량 간격으로 그룹화하고, 상승 틱은 녹색, 하락 틱은 빨간색으로 구분하여 표시합니다. 패널은 차트의 네 모서리 중 원하는 위치로 자유롭게 이동할 수 있으며, 표시 크기와 글꼴도 사용자 설정이 가능합니다. 모든 통화쌍 및 상품에 대응하며 MetaTrader 5 플랫폼 내에서 안정적으로 작동합니다. 이 인디케이터는 스캘핑 및 틱 기반 전략을 사용하는 트레이더에게 유용합니다.
    Cumulative Volume Delta CVD
    Jerome Stephane Eric Brivet
    JB Cumulative Volume Delta -- 누가 매수하고 누가 매도하는지 확인하세요 가격은 무엇이 일어났는지 알려줍니다. 거래량은 누가 했는지 알려줍니다. 하지만 표준 거래량 지표(OBV, Volume Profile)는 모든 거래량을 동일하게 취급합니다 -- 매수 압력과 매도 압력을 구분할 수 없습니다. CVD(Cumulative Volume Delta)는 실체/꼬리 분석을 통해 각 캔들의 거래량을 매수 거래량과 매도 거래량으로 분해하여 이 문제를 해결합니다. 큰 실체의 양봉 = 대부분 매수 거래량. 긴 꼬리의 음봉 = 혼합이지만 매도 우세. 이를 통해 가격만으로는 보여줄 수 없는 매수자와 매도자 간의 실시간 전투 그림을 만들어냅니다. 차트에 표시되는 것: 매수/매도 클라우드 -- 두 개의 EMA(매수 압력과 매도 압력)가 컬러 채우기로 그려집니다. 초록색 클라우드 = 매수자 우세. 빨간색 클라우드 = 매도자 우세. 클라우드 너비는 한쪽이 얼마나 우세한지 보여줍
    Quick deals EA
    Aleksandr Slavskii
    Горячие клавиши плюс клик левой кнопки мыши на графике. Советник открывает сделки, выставляет лимитные и стоповые ордера, удаляет ордера и закрывает позиции, также  делает реверс  открытых позиций, выставляет прописанные в настройках стоп лосс и тейк профит. (реверс только на неттинговых счетах) При запуске советника можно посмотреть подсказку как действует советник при нажатии клавиши + клик на графике. Правее последнего бара, ниже цены Ctrl+ЛКМ  - OpenSell Правее последнего бара, выше цены C
    Advanced Volume Profile Analysis Tool for MetaTrader 5 The Kecia Volume Profile Order Finder provides traders with volume profile analysis capabilities. This MT5 indicator combines volume profile visualization with statistical calculations to help identify potential trading opportunities and suggests entry, stop loss, and take profit levels based on market structure. Market Profile Visualization Transform your chart with customizable volume profile visualizations: Multiple visualization options
    TradeControl Pro – MetaTrader용 고급 트레이드 매니저 TradeControl Pro 는 MetaTrader 환경에서 차트 상에서 직접 거래 포지션을 구조적이고 효율적으로 관리할 수 있도록 설계된 트레이드 관리 도구입니다. 이 프로그램은 명확한 사용자 인터페이스와 자동 계산 기능, 그리고 다양한 트레이딩 방식에 대응하는 유연한 제어 옵션을 결합합니다. 내장된 온차트 패널은 표 형식으로 구성되어 있으며, Execution , Close , Info 의 세 가지 주요 탭으로 나뉩니다. 인터페이스는 가독성과 직관적인 조작에 중점을 두고 설계되었습니다. 논리적으로 구성된 명확한 구조 모든 주요 거래 지표의 실시간 업데이트 추가 창 없이 차트에서 직접 제어 가능 탭: Execution (거래 실행 및 계획) Execution 영역은 새로운 거래의 계획과 실행을 담당합니다. Open Calc (대기 주문 설정) Open Calc 를 사용하면 차트에 다음과 같은 세 개의 라
    VolumeProfile MT5
    Robert Hess
    4.14 (7)
    Description: The Volume Profile displays detailed informations of historical trading activities at certain price levels (Market Profile). Locate the areas with the best prices in the market and get an advantage over other market participants. Features: Customizable Market Profile Shows the "fair" Value Area with 70% of all Volume Shows critical low volume zones Shows VPOC, VAL and VAH Points integrated resource management to reduce the load while working with multiple charts Works on all timefr
    Prizmal Logic
    Vladimir Lekhovitser
    5 (1)
    실시간 거래 신호 거래 활동의 공개 실시간 모니터링: https://www.mql5.com/ko/signals/2353471 공식 정보 판매자 프로필 공식 채널 사용자 매뉴얼 설정 안내 및 사용 지침: 사용자 매뉴얼 열기 이 전문가 어드바이저는 규칙 기반 거래 전략에 기반하여 설계되었습니다. 이 전략은 시장에 지속적으로 노출되기보다는 특정 시장 조건을 식별하는 데 초점을 둡니다. 시스템은 가격 움직임, 변동성 특성 및 시간 요소를 분석합니다. 이 요소들은 현재 시장 환경이 거래 참여에 적합한지 판단하는 데 사용됩니다. 여러 사전 정의된 기준이 동시에 충족될 때만 거래가 실행됩니다. 조건이 충족되지 않으면 전문가 어드바이저는 비활성 상태를 유지합니다. 그 결과 거래 활동은 일정하지 않습니다. 거래가 전혀 발생하지 않는 기간이 있을 수 있습니다. 이는 포지션이 전혀 없는 하루 전체를 포함할 수 있습니다. 반대로 적절한 시장 국면에서는 비교적 짧은 시간에 여러 거
    TradePad
    Ruslan Khasanov
    5 (1)
    TradePad는 수동 및 알고리즘 트레이딩을 위한 도구입니다. 여러 거래 상품에 대한 빠른 거래 작업과 포지션 제어를 위한 간단한 솔루션을 제공합니다. 주의, 이 애플리케이션은 전략 테스터에서 작동하지 않습니다! 데모 계정을 위한 애플리케이션의 평가판과 모든 도구에 대한 설명 애플리케이션 인터페이스는 고해상도 모니터에 맞게 조정되었으며 간단하고 직관적입니다. 편안한 작업을 위해 트레이더에게 다음과 같은 도구 세트가 제공됩니다. 거래 작업 관리, 메인 차트 기간 간 전환, TradePad 상품 간 전환을 위한 핫키 관리자; 포지션을 개설하거나 보류 주문을 설정할 때 하락 위험을 평가하고 잠재적 이익을 계산하기 위한 거래 수준 표시 도구; 여러 거래 심볼을 시각적으로 모니터링하고 알고리즘 트레이딩을 위한 거래 신호를 수신하기 위한 MultiCharts 도구. 편의를 위해 거래 쌍 세트를 구성하여 여러 시간대의 가격을 모니터링하고 다중 통화 거래를 수행할 수 있습니다. 확장된 HTML
    Rolling vwap atr market panel
    Florian Alain Bernard Jean-paul Pierre Cuiset
    Rolling VWAP + ATR Bands + Market Panel — powerful visual tool for scalping, extensions detection and intraday market structure analysis. Rolling VWAP + Panel Rolling VWAP + Panel is a professional MetaTrader 5 indicator designed to analyze market structure using a Rolling Volume Weighted Average Price (VWAP) combined with ATR-based volatility bands , a real-time market analysis panel , and an integrated candle countdown timer . This indicator provides a clear and structured view of price beha
    FREE
    This indicator allows you to enjoy the two most popular products for analyzing request volumes and market deals at a favorable price: Actual Depth of Market Chart Actual Tick Footprint Volume Chart This product combines the power of both indicators and is provided as a single file. The functionality of Actual COMBO Depth of Market AND Tick Volume Chart is fully identical to the original indicators. You will enjoy the power of these two products combined into the single super-indicator! Below is
    Deriv Synthetic HTF Candle Projection GMT2 Higher Timeframe Candle Projection & Previous Levels Tool for Deriv Synthetic Indices (MT5) Overview Deriv Synthetic HTF Candle Projection GMT2 is a professional MetaTrader 5 indicator built specifically for Deriv Synthetic indices . It projects the current forming Higher Timeframe (HTF) candle onto the chart and automatically draws key reference levels from previous candles. This indicator is designed to help traders maintain higher timeframe context
    FREE
    Why use virtual SL / TP? Broker stop/freeze level limitations Hidden exits for scalping strategies Advanced trailing logic not available in standard MT tools Additional safety layer for EAs and manual trading Stop Loss modes (4 types): Fixed Stop Loss -  Classic fixed SL defined in points. Trailing Stop Loss -  Standard trailing following the price. Trailing to Breakeven -  Stop Loss moves to the trade open price once profit conditions are met. Trailing by jumps (advanced mode) -  A multi-step t
    TickData Recorder (v1.3): Real Ticks Recording for Reliable Backtesting in MT5 Elevate the accuracy of your strategy testing significantly! Tired of unrealistic backtest results on standard MetaTrader 5 data that don't match your broker's conditions? "TickData Recorder" is your tool to solve this problem. This Expert Advisor meticulously records   every single tick price change   (time with milliseconds, Bid, Ask, Last, Volume) directly from   your broker's   server (FTMO, RoboForex, IC Markets,
    SMC Venom Model BPR 지표는 Smart Money(SMC) 개념 내에서 일하는 트레이더를 위한 전문 도구입니다. 가격 차트에서 두 가지 주요 패턴을 자동으로 식별합니다. FVG (공정 가치 갭)는 3개의 캔들의 조합으로, 첫 번째와 세 번째 캔들 사이에 갭이 있습니다. 이는 볼륨 지원이 없는 레벨 사이에 구역을 형성하여 종종 가격 수정으로 이어집니다. BPR (균형 가격 범위)은 두 개의 FVG 패턴의 조합으로, "브리지"를 형성합니다. 이는 가격이 낮은 볼륨 활동으로 움직일 때 브레이크아웃과 레벨로의 복귀 구역으로, 캔들 사이에 갭을 생성합니다. 이러한 패턴은 거래자가 차트에서 거래량과 가격 역학을 분석하여 주요 지지/저항 수준, 돌파 구역 및 진입 지점을 식별하는 데 도움이 되며, 여기서 대형 시장 참여자와 일반 참여자 간의 상호 작용이 발생합니다. 이 지표는 사각형과 화살표 형태로 패턴을 시각화하며 유연한 경고 설정도 지원합니다. 주요 특징: 패턴 표시 모드
    Exclusive Imperium MT5 — 자동화 거래 시스템 Exclusive Imperium MT5 는 MetaTrader 5용 전문가 어드바이저(EA)로, 시장 분석 알고리즘과 리스크 관리에 기반합니다. EA는 완전히 자동으로 작동하며 트레이더의 개입은 최소화됩니다. 주의! 구매 후 즉시 저에게 연락하세요 — 설정 지침을 받으실 수 있습니다! 중요: 모든 예시, 스크린샷 및 테스트는 데모 목적일 뿐입니다. 특정 통화쌍이 한 브로커에서 좋은 결과를 보여도 다른 브로커에서도 동일하다는 의미는 아닙니다. 각 브로커는 고유한 시세, 스프레드 및 거래 조건을 가지고 있습니다. 따라서 각 통화쌍은 사용자가 개별적으로 최적화해야 합니다 그리고 실제 계좌에서는 단일 통화 모드 로만 실행해야 합니다 — 각 쌍을 별도로 실행하세요. 다중 통화 모드 스크린샷은 단순히 예시입니다. 시장 상황은 변하기 때문에 최적화는 최소 연 1회 반복하는 것이 좋습니다. 중요 정보: EA의 데모 버전은 평가용으로
    BoxChart MT5
    Evgeny Shevtsov
    5 (7)
    The market is unfair if only because 10% of participants manage 90% of funds. An ordinary trader has slim changes to stand against these "vultures". This problem can be solved. You just need to be among these 10%, learn to predict their intentions and move with them. Volume is the only preemptive factor that faultlessly works on any timeframe and symbol. First, the volume appears and is accumulated, and only then the price moves. The price moves from one volume to another. Areas of volume accumu
    Harmonic Pattern Structure Harmonic Pattern Structure is a professional MetaTrader 5 indicator that automatically detects classic harmonic patterns using strict Fibonacci ratio validation and XABCD price structure. Designed for traders who value precision, clean visuals, and structured analysis, the indicator highlights potential reversal zones based on price geometry, supporting consistent and objective decision-making. SUPPORTED HARMONIC PATTERNS Gartley (222) Butterfly Bat Crab Shark Cy
    The Simple Bot as the name suggests follows a very simple strategy, which guarantees the bot will work in the long run. The EA uses the below simple philosophy to guarantee profits for the user. 1. Odds of success inversely proportional to size of TP. The EA aims to capture just 250 points in GOLD(XAUUSD) when conditions are met.  2.  Avoids over-trading, takes utmost one trade per day 3. Only one trade managed at a time 4.  Robust risk management, every trade is protected with a tight SL Gue
    Local Copy Trader Utility - Professional Copy Trading System Overview Local Copy Trader Utility is the complete solution for mirroring trades between MetaTrader 5 accounts. With both Master and Slave functionality in one powerful Expert Advisor, it delivers reliable, lightning-fast trade copying with zero external dependencies. Perfect for managing multiple accounts, following trading signals, or transferring trades between brokers, this system ensures your positions stay perfectly synchronized
    이 제품의 구매자들이 또한 구매함
    Farmed Hedge Yield Farming | All Markets (Manual - Hybrid - Semi/Automated EA) MULTI-ASSET SUPPORT Trade any asset available on your broker - Forex: Major, Minor, Exotic pairs - Crypto: BTC, ETH, XRP, SOL, BNB - Stocks: Apple, Tesla, Amazon, Google, etc. - Commodities: Gold, Silver, Oil, Gas - Indices: US30, NAS100, SPX500, DAX40 - Any CFD your broker offers VERIFIED TRADING RESULTS - Farmed Hedge Yield Axi Copy:  https://www.mql5.com/en/signals/2356376 - Farmed Hedge Yield Exn Copy:   https:/
    HINN Lazy Trader
    ALGOFLOW OÜ
    5 (2)
    The core idea: using the user interface, you configure the parameters the chart must meet before entering a position (or positions), choose which entry models to use, and set the rules for when trading and planning should end. Lazy Trader  handles the rest: it  takes over all the routine chart watching and execution! full description  :: 3 key videos [1] ->  [2]   ->  [3] What can it do? - Understands Larry Williams market structure - Understands swing market structure by Michael Huddleston
    The product will copy all telegram signal to MT5 ( which you are member) , also it can work as remote copier.  Easy to set up, copy order instant, can work with almost signal formats, image signal,  s upport to translate other language to English Work with all type of channel or group, even channel have "Restrict Saving Content", work with  multi channel, multi MT5 Work as remote copier: with signal have ticket number, it will copy exactly via ticket number. Support to backtest signal. How to s
    Custom Alerts AIO: 다중 시장을 동시에 모니터링 – 설정 없이 즉시 사용 가능 개요 Custom Alerts AIO 는 복잡한 설정 없이 즉시 사용할 수 있는 통합 시장 모니터링 도구입니다. FX Power, FX Volume, FX Dynamic, FX Levels, IX Power 등 필요한 모든 지표가 내장되어 있어 별도의 설치나 구성 없이 알림 기능을 바로 사용할 수 있습니다. 차트 그래픽 없이 작동하며, Forex, 금속, 지수, 암호화폐 등 주요 자산군을 모두 지원합니다. 주식(Symbols)은 별도로 입력하여 추가할 수 있으나, MetaTrader에서는 일반적으로 제한적으로만 사용됩니다. 1. 왜 Custom Alerts AIO를 선택해야 하나요? 추가 라이선스가 필요 없습니다 • 모든 Stein Investments 지표가 내장되어 있어 별도 구매가 필요 없습니다. • 즉시 알림 기능을 시작할 수 있어 빠르고 간편합니다. 모든 시장을 하나의 도구로
    ManHedger MT5
    Peter Mueller
    4.83 (6)
    THIS EA IS A SEMI-AUTO EA, IT NEEDS USER INPUT. Manual & Test Version Please TEST this product before BUYING  and watch my video about it. The price of the ManHedger will increase to 250$ after 20 copies sold. Contact me for user support or bug reports or if you want the MT4 version! MT4 Version  I do not guarantee any profits or financial success using this EA. With this Expert Advisor, you can: Implement your own Zone Recovery strategy to capitalize on trending markets. Create Grid trading s
    YuClusters
    Yury Kulikov
    4.93 (43)
    Attention: You can view the program operation in the free version  YuClusters DEMO .  YuClusters is a professional market analysis system. The trader has unique opportunities to analyze the flow of orders, trade volumes, price movements using various charts, profiles, indicators, and graphical objects. YuClusters operates on data based on Time&Sales or ticks information, depending on what is available in the quotes of a financial instrument. YuClusters allows you to build graphs by combining da
    The product will copy all  Discord  signal   to MT5   ( which you are member  ) , also it can work as remote copier.  Easy to set up. Work with almost signal formats, support to translate other language to English Work with multi channel, multi MT5. Work with Image signal. Copy order instant, auto detect symbol. Work as remote copier: with signal have ticket number, it will copy exactly via ticket number. How to setup and guide: Let read all details about setup and download Discord To MetaTrader
    EasyInsight AIO MT5
    Alain Verleyen
    4.92 (12)
    EASY Insight AIO – 스마트하고 손쉬운 트레이딩을 위한 올인원 솔루션 개요 외환, 금, 암호화폐, 지수, 심지어 주식까지 — 전 시장을 몇 초 만에, 수동 차트 확인이나 복잡한 설치, 인디케이터 설정 없이 스캔할 수 있다고 상상해 보세요. EASY Insight AIO 는 AI 기반 트레이딩을 위한 궁극의 플러그 앤 플레이(Plug & Play) 데이터 내보내기 도구입니다. 단 하나의 깔끔한 CSV 파일로 전체 시장 스냅샷을 제공하며, ChatGPT, Claude, Gemini, Perplexity 등 다양한 AI 플랫폼에서 즉시 분석할 수 있습니다. 창 전환, 복잡함, 차트 오버레이는 더 이상 필요 없습니다. 자동으로 내보내지는 순수하고 구조화된 데이터 인사이트만으로, 반복적인 차트 감시 대신 데이터 기반의 스마트한 의사결정에 집중할 수 있습니다. 왜 EASY Insight AIO인가요? 진정한 올인원 • 별도의 설정, 인디케이터 설치, 차트 오버레이가 필요 없습
    PropFolio Command Manager Pro PropFolio Command Manager Pro is an advanced, multi-symbol execution terminal designed to automate your custom arrow indicators. Simply enter the name of your arrow indicator into the settings, and the Command Manager will monitor up to 30 currency pairs, indices, or metals simultaneously from a single chart. When your indicator generates a signal, the EA verifies the trend using the built-in Higher Timeframe (HTF) algorithm, checks the live spread, and manages the
    Crystal Trade Manager – Advanced MT5 Risk and Trade Control Utility Overview Crystal Trade Manager (CTM) is a professional MetaTrader 5 utility designed for risk management, trade automation, and instant execution control. It provides traders with an integrated system for protecting equity, managing daily drawdowns, controlling lot sizes, and applying automation features such as automatic SL/TP, break-even, and trailing stop. The tool is suitable for manual traders, prop-firm challenge particip
    ************************************************************************************************************************************** GoldMine Train은 Gold를 위한 트렌드 트레이딩 전략 EA입니다. 운영자는 주요 트렌드 방향을 결정하고 Train에 이동을 지시합니다. Train은 해당 방향으로 지속적으로 매수/매도를 합니다. Lot 볼륨은 계정 잔액과 사전 설정된 레버리지 비율에 따라 달라집니다. 운영자가 트렌드 방향을 변경하면 Train이 멈추고 이익을 잠급니다. 사용자는 차트의 버튼을 사용하여 트렌드 방향을 쉽게 선택할 수 있습니다. ******************************* ***************** ********************** ***************** ********************** *********
    Unlimited Trade Copier Pro MT5 is a tool to copy trade remotely to multiple MT4, MT5 and cTrader accounts at different computers/locations over internet. This is an ideal solution for you if you are a signal provider and want to copy your trades to other receivers globally on your own rules. One provider can copy trades to multiple receivers and one receiver can get trade from multiple providers as well. The provider can even set the subscription expiry for each receiver, so that receiver will n
    Mt5 To InterativeBrokers Copier allows you to copy deals from MT5 account to Interactive Brokers. With this, you can run your EA strategy on a MT5 Demo/Real Account, then copy all the deals to Interactive Brokers account real time. Features: 1. Copy or Invert-Copy deals Realtime from MT5 to IB Account. 2. Synchronizing positions of both accounts periodicaly, in case any missing copying. 3. You can choose only Buy position or Sell position. Symbols Setup: General Format:  {MT Symbol} -> {IB S
    Mentfx Mmanage mt5
    Anton Jere Calmes
    4.25 (8)
    The added video will showcase all functionality, effectiveness, and uses of the trade manager. Drag and Drop Trade Manager. Draw your entry and have the tool calculate the rest. Advanced targeting and close portions of a trade directly available in tool (manage trades while you sleep). Market order or limit order on either side with factored spread. Just draw the entry, the tool does the rest. Hotkey setup to make it simple. Draw where you want to enter, and the stop loss, the tool calculates al
    GRat Crypto
    Ivan Titov
    4.5 (2)
    Trade on crypto exchanges in MT5! GRat_Crypto is a tool for manual and automated trading , including ANY available EA, ANY  cryptocurrency  on most popular crypto exchanges in the familiar MT5 environment 24/7. Features 1. ALL instruments of the 9 most popular crypto exchanges are available: Binance, BingX, Bybit, Coinbase, CoinEx, Kraken,   KuCoin, MEXC and OKX . 2. The ability to place ANY type of order available in MT5, both market and pending, to modify orders and positions, to delete order
    Features   With MT5 to Interactive Brokers(IB) Trader, you can: 1. Load chart data from IB to MT5, and Analyze with all standard or customer Indicators. 2. Place Orders to IB Account Directly in MT5. 3. Make your Own EAs upon IB Securities by only making minus changes of the trading function. Usage 1) Installation Copy the "Mt5ToIBTraderEn.ex4" and sample files to [MT5 Data Folder]->MQL5->Experts.  2)  MT5 Settings Add the IP Address to the MT5 Allowed URLs in 'Tools->Options->Expert Adviso
    CRT Pro Trading EA Ultimate v10 - 전문 패턴 스캐너 개요 CRT Pro Trading EA Ultimate v10은 Helios Technologies가 개발한 고급 멀티 심볼 Expert Advisor로, 지능형 추세 정렬을 갖춘 CRT(통합-조작-분배) 패턴을 감지하고 거래하는 데 특화되어 있습니다. 이 EA는 기관 거래 개념과 스마트 신호 관리를 결합하여 여러 시장에서 고확률 거래 기회를 제공합니다. 주요 기능 추세 정렬 신호 생성 스마트 추세 분석: 지배적인 시장 추세와 일치하는 신호만 생성 다중 타임프레임 확인: 상위 타임프레임 분석을 사용하여 낮은 확률 설정 필터링 적응형 신호 방향: 강세 추세 = 매수 신호만, 약세 추세 = 매도 신호만, 중립 추세 = 양방향 허용 다중 심볼 시장 스캐너 12개 이상의 상품 지원: EURUSD, GBPUSD, USDJPY, USDCHF, AUDUSD, USDCAD, EURGBP, XAUUSD, US30
    Strategy Builder offers an incredible amount of functionality. It combines a trade panel with configurable automation (covert indicators into an EA), real-time statistics (profit & draw down) plus automatic optimization of SL, TP/exit, trading hours, indicator inputs. Multiple indicators can be combined into an single alert/trade signal and can include custom indicators, even if just have ex4 file or purchased from Market. The system is easily configured via a CONFIG button and associated pop-u
    Telegram Broadcast MT5
    Volodymyr Hrybachov
    3.67 (3)
    TELEGRAM BROADCAST 유틸리티를 사용하면 거래를 Telegram 채널에 즉시 게시할 수 있습니다. FOREX 신호로 자신의 Telegram 채널을 오랫동안 만들고 싶었다면 이것이 필요한 것입니다. TELEGRAM BROADCAST는 다음과 같은 메시지를 보낼 수 있습니다. 거래 개시 및 종료 대기 중인 주문의 배치 및 삭제 손절매 수정 및 준비금(라스트 오더) 손실을 막고 증명을 발동합니다. 보류 중인 주문의 활성화 및 삭제: 거래 보고서 보내기 입금 및 출금에 대한 메시지 보내기 인출 또는 이익이 N 값에 도달하면 메시지를 보냅니다. 계정 모니터링 - N분마다 통계를 보냅니다. 각 메시지에 자신의 텍스트를 추가하고 몇 분 안에 지연을 게시할 수 있습니다. 모든 메시지는 유연합니다. 유틸리티는 하나의 차트에만 설치되지만 모든 기호에서 메시지를 보냅니다. 설정에서 기호를 숨길 수 있습니다. 유틸리티 구성: 서비스 -> 설정 -> 전문가 자문 -> 다음 URL에
    Remote Trade Copier is an advanced tool designed for efficiently copying trades between accounts in both local and remote modes. It allows for lightning-fast order replication from a master account to a slave account. In local mode, trades are copied instantly, while in remote mode, the copying process takes less than 1 second. MT4 Version (Only Local) MT5 Version (Only Local) MT4 Full Version (Local & Remote) Local mode refers to both MetaTrader platforms being installed on the same system,
    Partial Close Expert는   여러 기능을 하나의 자동화 시스템으로 결합한 도구입니다. 이 EA는 위험 관리 및 잠재 수익 극대화를 위한 다양한 옵션을 제공하여 트레이더가 포지션을 더욱 효과적으로 관리할 수 있도록 지원합니다. Partial Close Expert를 사용하면 거래자는 다음을 설정할 수 있습니다.       부분 폐쇄       이익을 확보하기 위한 수준       트레일링 스톱       이익을 보호하고 손실을 제한하는 수준       손익분기점       가격이 불리하게 변동하더라도 거래가 손익분기점을 넘지 않도록 보장하는 수준과 여러 가지 다른 기능이 있습니다. 이 올인원 EA를 사용하면 트레이더는 거래를 지속적으로 모니터링할 필요가 없으므로 시간과 노력을 절약할 수 있습니다. EA는 시장 상황에 따라 미리 설정된 지시를 실행하여 트레이더에게 거래에 대한 유연성과 통제력을 제공합니다. 부분 닫기 전문가 첨부,       키보드의 "p"를 누르고  
    EA price is reduced to 50% discount for limited time period. Spot vs Future Arbitrage EA for MT5 Spot vs Future Arbitrage EA is an automated Expert Advisor designed for MetaTrader 5 that operates using price differences between Gold spot and Gold futures instruments. The strategy opens positions on both instruments simultaneously to take advantage of temporary differences between spot and futures prices. Requirements The trading account must provide both Gold spot and Gold futures instruments
    [ MT4 Version ] DoIt Trade Coach AI (MT5/MT4) — AI Trade Validator for Manual Traders You are the trader. The AI is your second opinion. Intro price valid until 26.12.2025. After that, price updates to 197 USD. DoIt Trade Coach AI is a MetaTrader utility that helps you validate your trade ideas before you enter: you propose direction + Entry/SL/TP, the AI analyzes the setup, explains what’s strong/weak, suggests improvements, and lets you execute directly from the panel. This is NOT an autom
    Gold instrument scanner is the chart pattern scanner to detect the triangle pattern, falling wedge pattern, rising wedge pattern, channel pattern and so on. Gold instrument scanner uses highly sophisticated pattern detection algorithm. However, we have designed it in the easy to use and intuitive manner. Advanced Price Pattern Scanner will show all the patterns in your chart in the most efficient format for your trading. You do not have to do tedious manual pattern detection any more. Plus you
    INTRODUCTION : This Panel is made to detect the spike presence and escape the time occuring a spike presence and open sell or buy trade transaction automatically after providing  a signal control to operate autonomously the trade. It is a best scalper and a good spike escaper.     There are another functionalities as  Martingale strategy and a deep indicator called DeepMovingAverage , it last is triggered automatically when the control is checked. These are made to help users   to notify and t
    SSFx Ultimate Hedge Manager EA Description: The SSFx Ultimate Hedge Manager EA is the pinnacle of trade management tools for the MT5 platform. Combining the advanced trade management features of the SSFx Hedge Manager EA with the comprehensive backtesting capabilities of the SSFx Manual Backtester, this ultimate product empowers traders to refine and optimize their strategies with unmatched flexibility. This EA focuses on a hedging-based approach to risk management, providing traders with a dyn
    FiboPlusWaves MT5
    Sergey Malysh
    5 (1)
    FiboPlusWave Series products Ready-made trading system based on Elliott waves and Fibonacci retracement levels . It is simple and affordable. Display of the marking of Elliott waves (main or alternative option) on the chart. Construction of horizontal levels, support and resistance lines, a channel. Superposition of Fibonacci levels on waves 1, 3, 5, A Alert system (on-screen, E-Mail, Push notifications).    Features: without delving into the Elliott wave theory, you can immediately open one of
    PineChart
    Muhammad Minhas Qamar
    Developed by MMQ —  PineChart: Run PineScript Inside MT5 With A Modern Charting Experience An MQL5 Expert Advisor that runs Pine Script indicators and strategies directly inside MetaTrader 5. PineChart includes a full Pine Script interpreter so you can use your existing Pine Script v5/v6 source code without manually rewriting anything in MQL5. Links [  Website  |  Documentation  |  Demo ] NOTE: Downloading demo through MQL5 will give you limited functionality. To experience PineChart fully, dow
    Trading Chaos Expert
    Gennadiy Stanilevych
    5 (11)
    This software has no equals in the world and represents a universal trade "console" covering trading signals, automated market entry, setting of Stop Loss and Take Profit, as well as Trailing Profit for multiple trades at the same time in a single open window. Intuitive control of the Expert Advisor in "three clicks" ensures a comprehensive use of all its functions on different computers, including tablets PCs. Interacting with additional signal indicators that mark the chart to give a real mark
    The program is use to copy trading from MT5 to MT4 and MT5 on local PC or copy  over the Internet .  Now you can easy copy trades to any where or share to friends. Only run one Flash Server on VPS, also need allow the apps if you turn on Windows Firewall. Can not add more than 20 account copier to server at same time,  include both  MT4 and MT5 Get free Copier EA  for MT4 and MT5 (only  receive signal), download here Instants copy, speed smaller 0.1 seconds, easy to setup How to setup and guide
    제작자의 제품 더 보기
    Poc Breakout Signal: The Ultimate Institutional Order Flow & Price Action System Elevate your trading with Poc Breakout, a comprehensive technical analysis tool designed to bridge the gap between retail trading and institutional market understanding. This all-in-one system combines powerful Buy/Sell signals, advanced Volume Profile analysis, real-time Order Flow (Depth of Market), and critical macroeconomic data to give you a clear, unambiguous edge in the markets. Poc Breakout Signal decodes c
    VOLUME BUBBLES ORDERFLOW FOOTPRINT PROFESSIONAL Expert Advisor for MetaTrader 5 Complete Feature Documentation Introduction: Volume Bubbles OrderFlow Footprint Professional is an advanced order flow visualization tool designed for the MetaTrader 5 platform. It provides institutional-grade market analysis through real-time volume bubbles visualization, volume profiling, and sophisticated order flow analysis. This Expert Advisor transforms raw market data into actionable trading intelligence, hel
    필터:
    zeke21t2
    466
    zeke21t2 2026.04.09 04:04 
     

    I find it invaluable for refining my discretionary scalping tactics by displaying the timeframe in M5. Aside from being difficult for those with presbyopia XD, it's a truly invaluable utility tool, a treasure trove for any trader. Stop guessing where the market will go. See the actual order flow and trade with confidence alongside institutional traders. (by the author) That's absolutely right.

    Abdul Jalil
    614
    개발자의 답변 Abdul Jalil 2026.04.09 16:25
    Hi Thank you so much for the feedback, greatly appreciated. Take care AJ
    jackie1289
    24
    jackie1289 2026.02.25 16:04 
     

    excellent supp from dev

    Abdul Jalil
    614
    개발자의 답변 Abdul Jalil 2026.04.09 16:25
    Thank you for the feedback. Take care AJ
    리뷰 답변