Order flow footprint chart

4.4
  • Yardımcı programlar
  • Abdul Jalil
    Abdul Jalil
    4.5 (7)
    I am a multidisciplinary creator and market technician, combining the visual clarity of a graphics designer with the analytical depth of a trader and trading‑tools developer. My work lives at the intersection of design, technology, and financial markets.
  • Sürüm: 6.34
  • Güncellendi: 27 Şubat 2026
  • Etkinleştirmeler: 5
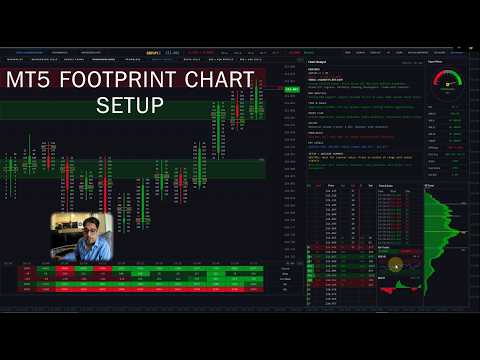
Footprint Chart Pro — Professional OrderFlow EA for MetaTrader 5

Version 6.34 | Professional tool for real traders | Institutional-Grade Visualization

DEMO USERS - PLEASE SELECT EVERY TICK / REAL TICK WHEN TESTING AND YOU HAVE DOWNLOADED HISTORICAL DATA. IF YOU SEE A WAITING SCREEN AND IT IS NOT DOWNLOADING, IT MEANS YOU HAVE LOW HISTORICAL DATA. TRY 1 MIN AND 5 MIN FIRST ON 1 DAY DATA. ONE DAY DATA SHOULD BE THE NEWEST AND MOST CURRENT DATE. PLEASE WAIT UNTIL THE MARKET HAS ROLLED OVER PERIOD.


IMPORTANT - Recommended Price Bucket in Points for Pairs:


XAUUSD - 40 BTCUSD - 1000 UK100 - 30 DE40 - 100 CADJPY - 5
GBPUSD - 5 EURUSD - 5 US30 - 100 AUDCAD -5 EURGBP -3
GBPJPY - 10 USDCAD - 5 NAS100 - 100 AUDJPY - 5 EURJPY - 10
USDJPY - 10 USDCHF - 5 SP500 - 30 AUDUSD - 6 GBPCAD - 5

My Futures OrderFlow Footprint Chart: https://www.mql5.com/en/market/product/174307


Overview

Footprint Chart Pro is a comprehensive, institutional-grade order flow visualization Expert Advisor for MetaTrader 5. Built entirely on a high-performance rendering engine, it delivers real-time bid/ask footprint data, market depth analysis, time & sales tracking, volume profiling, and intelligent market analysis — all within a single, fully configurable multi-panel interface. 


Feature Summary

  • 9 switchable footprint styles — Minimalist, Background Cells, Candle Frame, Volume Profile Candle, Frameless, Middle Candle, Delta Cells, Bid x Ask Profile, Bid x Ask Cells.

  • 6-level cell intensity colouring — 3 buyer tiers + 3 seller tiers with configurable percentage thresholds.

  • 3-tier diagonal imbalance detection with per-tier colours and text size boost.

  • Live DOM panel — broker order book feed, bid/ask depth, executed volume, flash alerts, bar totals.

  • Session Volume Profile — 3 modes, 4 display types (Total / Delta / Buy / Sell), POC + VAH + VAL.

  • Time & Sales tape — live tick stream with direction, volume, and large-order highlighting.

  • Embedded RSI and MACD indicators within the panel stack.

  • Signal Meter gauge — MA alignment, ATR regime, POC acceptance, and volume bias combined.

  • Chart Analyst panel — 9-category commentary with a 6-factor scored trade setup summary.

  • Automated Supply & Demand zones — swing detection, volume filter, ATR-scaled width.

  • Economic Fundamentals panel — upcoming news events with auto-refresh.

  • Mini Session Chart — compact overview for a defined session window.

  • Interactive button bar — Supply & Demand Zones, Fundamentals Panel, Mini Chart, Zoom In/Out, Up/Down, Reset, VP, Delta Bars, Side Panels.

  • Fully collapsible interface — style strip, summary table, and side panels each collapse independently.

  • Runtime toggles for per-bar Volume Profile overlay and Delta Bar strip.

  • 16 built-in colour themes, dark/light palette, per-style imbalance colour sets, full per-element control.

  • Tick volume inference engine

  • Coloured Candle countdown timer

  • Dual font system — proportional for labels, monospace for all numerical data.


1. Nine Switchable Footprint Display Styles

The EA provides nine distinct visualisation modes, switchable on the fly via header buttons, each designed for a different analytical preference:

  • Minimalist — Clean text-only Bid x Ask display with no cell backgrounds, ideal for clutter-free reading.

  • Background Cells — Colour-filled cells where intensity is graded across six levels of volume dominance (three buyer tiers and three seller tiers), giving an immediate visual heat map across the bar. High, Medium, and Low thresholds are configurable as percentage values, and each of the six intensity colours is individually adjustable.

  • Candle Frame — Traditional hollow OHLC candle outline overlaid with internal bid/ask data, combining price action and order flow in one view.

  • Volume Profile Candle — Integrates a per-bar volume histogram directly inside the candle body, showing volume distribution by price level. The histogram applies the same six-level intensity colour system (three buyer tiers: High, Medium, Low; three seller tiers: High, Medium, Low) so dominant levels are instantly distinguishable. A neutral colour is applied to balanced levels, and all seven colours are independently configurable or can inherit the global theme.

  • Frameless — Thin candle on the left side with floating bid/ask data with no cell borders, providing a clean open layout.

  • Middle Candle — A compact centre-bar representation with POC outline highlighting, useful on smaller timeframes.

  • Delta Cells — Displays net delta (buy volume minus sell volume) per price level as a single value, cutting through noise to show net aggression.

  • Bid x Ask Profile — A horizontal profile bar chart overlaid on each bar representing cumulative bid and ask volume per level.

  • Bid x Ask Cells — Full cell-based presentation with separate bid and ask columns, mirroring professional footprint chart conventions


2. High-Performance Rendering Engine

The entire interface is drawn using MetaTrader 5's internal rendering engine API rather than chart objects, delivering significant performance advantages:

  • All panels (main footprint, DOM, Volume Profile, Time & Sales, Signal Meter, Analyst) are rendered as layers, minimising redraws.

  • Intelligent  panel caching avoids unnecessary re-renders when data has not changed.

  • Configurable refresh rate in milliseconds (default 100 ms) allows traders to balance real-time responsiveness with CPU overhead.


3. Three-Tier Diagonal Imbalance Detection

The imbalance engine identifies diagonal bid/ask imbalances across adjacent price levels 

  • Three independent ratio thresholds (Level 1, Level 2, Level 3) allow traders to distinguish between moderate, strong, and extreme imbalances.

  • Each imbalance tier renders with a distinct colour and optional text size boost (configurable per-level), making imbalance stacks immediately visible.

  • A minimum volume filter prevents false signals from illiquid price levels with negligible activity.

  • Imbalance colours are independently configurable per footprint style (all 9 styles have individual colour sets), meaning each display mode can carry its own visual language.

  • Once a historical bar's imbalances are computed they are locked, preventing recalculation overhead on bars that are no longer live.

  • The Chart Analyst panel uses imbalance count ratios across the 10 most recent bars to infer institutional directional activity.


4. Live Depth of Market (DOM) Panel

A dedicated DOM panel renders the live order book alongside executed volume data:

  • Supports real broker MarketBook depth feed (OnBookEvent) for live Level II data where available from the broker.

  • Displays pending Bid and Ask orders at each price level together with executed Buy and Sold volume, giving a complete picture of both passive and aggressive activity.

  • Net Delta column and total Volume column shown per level.

  • Current price row highlighted in a distinct colour for instant price location awareness.

  • Flash animation on levels where significant volume hits, providing visual alerts of large order absorption.

  • Configurable number of visible levels (default 12) and panel dimensions.

  • Optional grid lines for easier level-to-level reading.


5. Session Volume Profile (SVP) Panel

A right-side session volume profile provides a statistical view of volume distribution over a configurable time window:

  • Three operating modes: fixed bar count, session start time, or daily reset at 00:00 — covering intraday, session, and daily profile use cases.

  • Four display types: Total Volume, Delta (Buy minus Sell), Buy Volume Only, or Sell Volume Only, switchable via the input settings.

  • Point of Control (POC), Value Area High (VAH), and Value Area Low (VAL) lines drawn across the profile with configurable colours.

  • Bar width scale factor allows the profile histogram width to be expanded or compressed independently of the panel size.

  • Session POC line is also projected across the main footprint chart as a horizontal reference, automatically tracking as new data arrives.

  • Volume intensity colours inherit the global theme or can be overridden independently.


6. Time & Sales (T&S) Panel

A streaming tape panel captures and displays every inferred trade tick in real time:

  • Scrolling list of timestamped trades showing price, volume, and direction (Buy / Sell / Neutral), colour-coded for instant classification.

  • Configurable big-order threshold: trades above the threshold are highlighted with a distinct background to flag large participants.

  • Maximum trade history and visible row count are both configurable, allowing the list to be tuned to screen real estate.

  • Bar totals shown at the bottom of the T&S panel: cumulative Buy volume and Sell volume for the current bar alongside a Buy/Sell ratio.

  • The Chart Analyst panel reads the most recent 50 T&S trades and computes a buy/sell percentage split to generate a qualitative tape sentiment reading.


7. Embedded RSI and MACD Indicators

Two classic momentum indicators are built directly into the panel stack beneath the Time & Sales list:

  • RSI(14) rendered as a line chart with configurable overbought (default 70) and oversold (default 30) reference levels, period length, and line colour.

  • MACD with configurable fast EMA, slow EMA, and signal period displayed as a histogram with zero line for quick divergence spotting.

  • Both indicators share the same panel height settings and update every render cycle, staying in sync with live price action.


8. Signal Meter Panel (Gauge Dial)

A visual sentiment gauge provides an at-a-glance directional reading derived from multiple internal signals:

  • Analogue dial with a sweeping pointer indicating a spectrum from Strong Sell through Neutral to Strong Buy.

  • Signal calculation incorporates three moving averages (MA9, MA21, MA50 by default), ATR regime detection (trend vs. chop), POC acceptance logic, and volume bias.

  • ATR ratio thresholds allow the meter to distinguish between trending and ranging market regimes and modulate signal strength accordingly.

  • POC acceptance parameters (minimum bar count and tick distance) prevent premature signal generation before price has confirmed a level.

  • All colours — bullish, bearish, neutral, pointer, background — are independently configurable.


9. Chart Analyst Panel — Multi-Factor Intelligence Engine

The Chart Analyst is a standalone analysis panel that synthesises data from all active sub-systems into structured, human-readable market commentary:

Sections displayed:

  • Pair Info — Symbol, timeframe, daily price change (points and percentage).

  • Trend + Higher TF | ATR — MA alignment assessment across MA9/21/50 with H4 and D1 higher-timeframe confirmation. ATR(14) value shown in the section header.

  • DOM Analysis — Bid/Ask ratio from the live order book, differentiating between heavy stacking, moderate pressure, and balanced conditions, with near-level focus (within 5 levels of current price).

  • Time & Sales — Buy/sell volume percentage split from the most recent 50 tape trades, classified into five sentiment bands from aggressive buying to aggressive selling.

  • Order Flow — Bar delta and cumulative delta direction used to characterise buying or selling aggression with three intensity bands.

  • Volume — Ask/Bid volume ratio for the current bar, scaled across five categories from heavy buyer dominance to heavy seller dominance.

  • Imbalances — Count of buyer vs. seller imbalances across the 10 most recent visible bars, inferring likely institutional directional activity.

  • Key Levels — Session POC price and daily high/low range.

  • Setup + Advisor Summary — Price position within the daily range combined with trend and flow alignment to generate a directional trade bias recommendation. Final summary scores six independent factors (trend, HTF, order flow, volume, DOM, tape) and outputs a consensus bias label with a score out of six.

The analyst refreshes at a user-defined interval (default 30 seconds) to balance computational load. All commentary text is colour-coded bullish/bearish/neutral for immediate visual classification.


10. Automated Supply & Demand Zones

An integrated swing-based Supply and Demand zone detection engine renders institutional price zones directly on the footprint chart:

  • Zones are identified using swing-high/swing-low detection with configurable swing length and lookback period.

  • Volume ratio filter ensures only swings formed with above-average volume qualify as significant zones.

  • ATR-based zone width scaling adapts zone height to current market volatility rather than using a fixed pip value.

  • Separate colours for Supply (bearish) and Demand (bullish) zones, both defaulting to the active theme colour when set to clrNONE.

  • Zone opacity, maximum number of rendered zones, and volume lookback period are all configurable.

  • Zones render as semi-transparent rectangles on the canvas, updating as price action produces new qualifying swings.


11. Fundamentals Panel

An economic calendar panel displays upcoming fundamental news events relevant to the traded symbol:

  • Configurable panel dimensions and maximum displayed rows.

  • Shows event time, title, affected currency, country code, and importance level.

  • Auto-refreshes at a configurable interval (default 60 seconds).

  • Helps traders contextualise order flow activity against scheduled economic releases.


12. Mini Session Chart

A compact candlestick overview chart provides a higher-level perspective on intraday price action:

  • Renders M1 OHLC data between a configurable session start and end time in local time (HH:MM format).

  • Data is cached for performance, only refreshing when a new tick arrives within the active session window.

  • Panel dimensions are freely resizable.

  • Gives traders a session-level price structure view alongside the tick-by-tick footprint data.


13. Ticker / Info Bar

A header bar at the top of the main panel provides persistent market context:

  • Displays symbol name, current timeframe, and live bid price with up/down change.

  • Daily percentage change shown with bullish/bearish colour coding.

  • Current timeframe trend label (HTF-BULL / HTF-BEAR) derived from the higher-timeframe analysis.

  • MS label (MS-BULL / MS-BEAR) reflecting shorter-timeframe momentum state.

  • Navigation buttons for Zoom In, Zoom Out, scroll Up/Down, Bar Volume Profile toggle, Delta Bars toggle, and Side Panels toggle.


14. Summary Table

A scrollable data table below the main footprint bars displays per-bar statistics:

  • Volume, Delta, Cumulative Delta, and Ask volume rows — one column per visible bar.

  • Positive values rendered with a green background, negative values with a red background for instant sign identification.

  • Cumulative delta is computed and cached across up to 600 bars for historical accuracy.

  • Row height and colour scheme are configurable.

  • Candle countdown timer showing seconds and minutes remaining in the current bar, updating in real time using local clock with color changes with countdown.


15. Per-Bar Volume Profile Overlay

An optional histogram can be rendered inside each footprint bar showing the volume distribution across price levels:

  • Toggle on/off independently of the Session Volume Profile.

  • Configurable histogram width.

  • Separate colours for bid-side and ask-side volume, plus a distinct POC level colour.

  • Uses the same intensity theme as the main cells or a custom override colour set.


16. Delta Bar

A compact bar graphic rendered below each footprint candle provides a quick visual delta summary:

  • Bar fill direction and colour indicate net buying (positive) or net selling (negative) delta for the bar.

  • Configurable height, gap from the candle bottom, and separate positive/negative colours.

  • Delta text label displayed inside the bar, inheriting the global theme colours or using custom overrides.


17. Tick Volume Inference Engine

For brokers that do not provide native real volume, a sophisticated inference system estimates actualised trade volume from tick flow:

  • Each incoming tick is weighted by a scale factor and an additional multiplier for every price-step move in that tick, approximating the size of the market order that caused the movement.

  • Configurable minimum and maximum inferred volume per tick prevent outlier distortion.

  • Toggle switch to enable or disable inference, falling back to raw tick counts when disabled.


18. Extensive Colour Theming System

Every visual element of the EA carries independently configurable colours, with a high-level theme system for rapid global style changes:

  • Six-level cell intensity colour system for the Background Cells and Volume Profile Candle styles: three buyer tiers (Buyer High, Buyer Medium, Buyer Low) and three seller tiers (Seller High, Seller Medium, Seller Low). Each of the six colours is independently configurable. High and Medium intensity thresholds are set as percentage values (default 70% and 40%) — any level with dominance above the High threshold renders in the strongest colour, between High and Medium in the mid tone, and below Medium in the subtle shade, creating a natural visual gradient that immediately reveals where the most aggressive activity occurred within each bar.

  • 16 built-in bull/bear colour themes: Classic Green/Red, Blue/Orange, Cyan/Magenta, Lime/Pink, Gold/Purple, Teal/Coral, Sky/Crimson, Mint/Rose, Orange/Dark Grey, Green/Dark Grey, Navy/Slate, Navy/Gold, White/Dark Grey, Emerald/White, Cherry/Teal, and Olive/Sandy.

  • Dark and Light panel palette modes affect all panel backgrounds simultaneously.

  • A global background colour synchronises all panels to a single base tone, with a one-click reset to defaults.

  • Theme Override All mode forces the selected bull/bear theme colours onto imbalance highlights as well, creating a fully unified visual style.

  • Individual imbalance colour sets for each of the 9 footprint styles, allowing each display mode to carry a unique colour language.

  • Full per-element colour control: candle bodies, fills, wicks, POC highlights, neutral cells, DOM rows, T&S rows, delta bars, signal meter components, and all analyst text states.


19. Flexible Layout and Panel Management

The entire interface is position-aware and freely resizable to accommodate different monitor sizes and chart layouts:

  • Main panel X/Y position and Width/Height configurable via inputs.

  • Each side panel (DOM, SVP, T&S, Signal Meter, Analyst, Fundamentals, Mini Session) has independent width and height settings.

  • Bar width and bar spacing are independently adjustable, allowing the footprint grid density to be tuned to the timeframe and screen resolution.

  • Cell gap and cell padding controls fine-tune spacing within each footprint cell.

  • Candle frame line width (1–4 px) and bid/ask separator width are configurable.

  • Side panels can be hidden as a group via the ticker bar toggle, maximising main chart space when detailed sub-panels are not needed.


20. Font Configuration

Two independent font families are used throughout the interface for typographic clarity:

  • Primary font (default: Segoe UI) used for labels, headers, and analyst commentary.

  • Monospace font (default: Consolas) used for all numerical data — prices, volumes, deltas — ensuring consistent digit-width alignment across all panels.

  • Base, small, and large font sizes configurable independently.

  • Per-level imbalance text size boost: three independent boost values allow imbalance labels to grow with signal severity, making strong imbalances stand out at a glance.


21. Interactive Header Controls & Button Bar

The ticker bar doubles as a full interactive control strip. All buttons are rendered as part of the canvas and respond to mouse clicks without requiring any external chart objects:

Left-Side Feature Toggle Buttons

  • Supply & Demand Zones — Toggles the automated Supply and Demand zone overlay on and off in a single click. The button label reflects the current active state, providing a clear on/off indicator at all times.

  • Fundamentals — Opens and closes the Economic Calendar panel. The panel slides in as an overlay when activated; clicking the button again dismisses it, keeping the main footprint chart unobstructed when macro data is not needed.

  • Mini Session Chart — Toggles the compact intraday candlestick overview panel. The session chart renders a full M1 OHLC view for the defined session window and disappears cleanly when toggled off.

Right-Side Navigation & View Buttons

  • RESET — Instantly restores the footprint chart to its default zoom level and vertical position, snapping the view back to a centred, calibrated baseline in a single click.

  • ZOOM IN — Increases the vertical cell height scale by 20% per click, expanding each price bucket row so individual bid/ask numbers become easier to read on faster timeframes or tighter price ranges.

  • ZOOM OUT — Decreases the vertical cell height scale by 20% per click, compressing the chart to display a wider price range simultaneously — useful for getting a broader context view on slower timeframes.

  • UP — Scrolls the entire footprint chart upward by a fixed pixel step , allowing traders to navigate to higher price levels without losing the current bar's data.

  • DOWN — Scrolls the footprint chart downward by the same step, bringing lower price levels into view. Both UP and DOWN support extended scrolling with a range of ±50,000 px.

  • BAR VOLUME PROFILE — Toggles the per-bar volume histogram overlay on and off at runtime, independently of the input settings. Allows traders to switch between clean cell view and profile view without reloading the EA.

  • DELTA BARS — Toggles the delta bar strip (rendered below each candle) on and off at runtime. Useful when the additional row height is needed for more price levels.

  • SIDE PANELS — Master toggle that shows or hides all right-side panels simultaneously (DOM, Session Volume Profile, Time & Sales, Signal Meter, Chart Analyst). Collapsing all side panels with a single click maximises the horizontal footprint chart area, ideal for focused trade execution or screen recording.


Hover State Feedback

Every button in the header bar responds to mouse hover with a colour highlight transition, giving clear visual confirmation of the active target before clicking. Hover states update continuously as the cursor moves across the panel.


22. Collapsible Panels — Full Minimalist Mode

Every major section of the interface can be collapsed independently, allowing traders to build a minimal, distraction-free layout without removing any functionality. Collapsed panels retain their state and re-expand instantly:

Style Strip (Footprint Style Selector Row)

  • The horizontal row of nine footprint style buttons sits in its own collapsible strip directly below the ticker bar.

  • A small +/− toggle button at the right edge of the strip collapses or expands the entire style row.

  • When collapsed, the strip reduces to a minimal tab height, reclaiming vertical chart space while still being accessible via a single click to re-expand.

Summary Table Strip (Timestamps + Volume/Delta Table)

  • The bottom strip containing bar timestamps, per-bar Volume, Delta, Cumulative Delta, and Ask rows is independently collapsible.

  • A +/− toggle at the right of the timestamp strip collapses the data table rows while keeping the timestamp bar visible as a minimal footer.

  • When collapsed, only the timestamp row remains, preserving time reference without the full statistical rows occupying vertical space.

Side Panels — Individual and Group Collapse

  • All five right-side analysis panels (DOM, Session Volume Profile, Time & Sales, Signal Meter, Chart Analyst) are controlled as a group by the SIDE PANELS button in the header bar.

  • A single click hides the entire side panel column, expanding the footprint chart to fill the full panel width — ideal for a clean chart view or during live trading when panel monitoring is not needed.

  • Clicking SIDE PANELS again instantly restores all panels to their previous positions and dimensions.

Minimalist Workflow

By collapsing the Style Strip, the Summary Table, and the Side Panels simultaneously, the entire interface reduces to a clean footprint chart with only the ticker bar visible — matching a professional minimalist layout while all data and controls remain one click away.


Compatibility & Requirements

  • Platform: MetaTrader 5 (MQL5). Not compatible with MT4.

  • Works on all symbols and all timeframes.

  • Real volume data enhances accuracy; tick volume inference is available for brokers without native volume.

  • Broker DOM feed required for live order book data

  • No external DLLs required.

  • Screen Resolution 1920x1080

  • Good laptop or PC


Best Practices

  • Use on liquid instruments (Forex majors, indices, gold)
  • Lower timeframes (M1-M15) show best order flow detail
  • Combine footprint imbalances with DOM for confirmation
  • Watch for POC tests as support/resistance
  • Use Chart Analyst summary for quick bias assessment
  • Monitor Time & Sales for institutional big orders.


    Updates & Support

    • Regular updates with new features
    • Responsive customer support
    • Detailed documentation included
    • Video tutorials available


    Start Trading Like a Professional

    Stop guessing where the market will go. See the actual order flow and trade with confidence alongside institutional traders.

    Questions? Contact us before purchasing - we're here to help!
    Değerlendirmeler 5
    Digital Revolution
    68
    Digital Revolution 2026.05.12 10:46 
     

    Great Tool and A++ service

    裕文 潘
    424
    裕文 潘 2026.04.20 12:17 
     

    This is a powerful tool.

    zeke21t2
    633
    zeke21t2 2026.04.09 04:04 
     

    I find it invaluable for refining my discretionary scalping tactics by displaying the timeframe in M5. Aside from being difficult for those with presbyopia XD, it's a truly invaluable utility tool, a treasure trove for any trader. Stop guessing where the market will go. See the actual order flow and trade with confidence alongside institutional traders. (by the author) That's absolutely right.

    Önerilen ürünler
    Volume Profile Utility
    AL MOOSAWI ABDULLAH JAFFER BAQER
    Volume Profile Discover where the market really trades. Make decisions based on volume, not guesswork. Volume Profile is a professional MetaTrader utility that analyzes trading activity across different price levels, allowing traders to identify where the highest concentration of market participation has occurred. Instead of focusing only on price movement over time, Volume Profile reveals the price levels where buyers and sellers have been most active, providing valuable insight into market str
    ClusterSecondForex
    Rafil Nurmukhametov
    4.67 (3)
    The utility allows you to build different types of graphs: Seconds chart from 1 second to 86400 seconds Tick chart from 1 tick and above The volume chart Delta chart Renko chart Range chart Product demo https://www.mql5.com/ru/channels/clustersecondforex Built-in indicators for volumetric analysis: daily market profile and market profile of the selected timeframe, Cluster Search Imbalance VWAP Dynamic POC, VAH, VAL the profile depth of the market vertical volume with various display options, del
    Master Edition, piyasa yapısını hacim ve para akışı merceğinden görselleştirmek için tasarlanmış profesyonel kalitede bir analiz aracıdır. Standart hacim göstergelerinin aksine, bu araç doğrudan grafiğinizde bir Günlük Hacim Profili görüntüleyerek, fiyat keşfinin tam olarak nerede gerçekleştiğini ve "akıllı paranın" nerede konumlandığını görmenizi sağlar. Bu Master Edition, netlik ve hız için tasarlanmıştır ve yüklendiğinde grafik düzeninizi anında güzelleştiren benzersiz bir Otomatik Tema Senkr
    ALIEN Dashboard
    Youssef Esseghaiar
    ALIEN DASHBOARD FULL EDITION – Professional ICT & Precision Trading Dashboard for MT5 ( HYBRID ENGINE ) Overview The   Alien Dashboard Full Edition   is a comprehensive, all‑in‑one technical indicator for MetaTrader 5 that merges the most powerful concepts from Inner Circle Trader (ICT) methodology with advanced precision‑entry logic, multi‑timeframe analysis, and an intuitive on‑chart dashboard. Designed for serious traders who want to visualise institutional order flow, identify high‑probabili
    SolarTrade Suite Finansal Robot: LaunchPad Market Expert - işlemleri açmak için tasarlanmıştır! Bu, değerlerini hesaplamak için özel yenilikçi ve gelişmiş algoritmalar kullanan bir işlem robotudur, Finans Piyasaları Dünyasındaki Asistanınız. Bu robotu başlatmak için anı daha iyi seçmek için SolarTrade Suite serisindeki gösterge setimizi kullanın. Açıklamanın alt kısmında SolarTrade Suite serisindeki diğer ürünlerimize göz atın. Yatırım ve finans piyasaları dünyasında güvenle gezinmek ister m
    Here   our more valuable tools SMC Trend Trading   ,  Easy SMC Trading  ,  Institutional SMC Architect Volume Analysis Tools  ,  Volume flow Profile  ,  Market volume profile  , FVG with Volume  , Liquidity Heatmap Profile  ,  Volume Spread Analysis 2. Key Features Dynamic Filtering : The core feature. As soon as the current price crosses a historical liquidity level, that level disappears. This reduces chart clutter and prevents you from trading off "dead" support/resistance. Liquidity Heatma
    Gösterge, tarihsel olanlarla karşılaştırılabilecek güncel teklifler oluşturur ve bu temelde bir fiyat hareketi tahmini yapar. Gösterge, istenen tarihe hızlı navigasyon için bir metin alanına sahiptir. Seçenekler: Sembol - göstergenin göstereceği sembolün seçimi; SymbolPeriod - göstergenin veri alacağı dönemin seçimi; GöstergeRenk - gösterge rengi; Ters - doğru tırnakları tersine çevirir, yanlış - orijinal görünüm; Sonraki, tarihi girebileceğiniz ve 'enter' tuşuna basarak hemen atlayab
    NRP Risk Manager Pro Institutional-Grade Trade Management & Prop Firm Protection Get the MetaTrader 4 Version Here: https://www.mql5.com/en/market/product/179888 Get the MetaTrader 5 Version Here: https://www.mql5.com/en/market/product/179885 Trading isn't just about finding the right entry; it is about flawlessly executing your edge while fiercely protecting your capital. NRP Risk Manager Pro is not an automated trading robot—it is a comprehensive, institutional-grade trade terminal d
    ClusterSecond
    Rafil Nurmukhametov
    4.78 (32)
    The utility allows you to build different types of graphs: Seconds chart from 1 second to 86400 seconds Tick chart from 1 tick and above The volume chart Delta chart Renko chart Range chart Demo version of the utility https://www.mql5.com/ru/channels/clustersecond Built-in indicators for volumetric analysis: daily market profile and market profile of the selected timeframe, Cluster Search Imbalance VWAP Dynamic POC, VAH, VAL the profile depth of the market vertical volume with various display op
    Binary Rise Fall
    Israr Hussain Shah
    Here   our more valuable tools SMC Trend Trading   ,  Easy SMC Trading  ,  Institutional SMC Architect Volume Analysis Tools  ,  Volume flow Profile  ,  Market volume profile  , FVG with Volume  , Liquidity Heatmap Profile  ,  Volume Spread Analysis The Fractals_Price indicator is a technical analysis tool that identifies fractal patterns on price charts. Fractals are recurring patterns that signal potential trend reversals or continuation points. This indicator marks both upward and downward
    Was: $249  Now: $99   Market Profile defines a number of day types that can help the trader to determine market behaviour. A key feature is the Value Area, representing the range of price action where 70% of trading took place. Understanding the Value Area can give traders valuable insight into market direction and establish the higher odds trade. It is an excellent addition to any system you may be using. Inspired by Jim Dalton’s book “Mind Over Markets”, this indicator is designed to suit the
    Here   our more valuable tools SMC Trend Trading   ,  Easy SMC Trading  ,  Institutional SMC Architect Volume Analysis Tools  ,  Volume flow Profile  ,  Market volume profile  , FVG with Volume  , Liquidity Heatmap Profile  ,  Volume Spread Analysis The    Liquidity Heatmap   is a sophisticated institutional trading tool designed to reveal where over-leveraged traders are trapped. By calculating estimated liquidation levels based on volume spikes and leverage, this indicator draws a dynamic "h
    Trading Utility for Forex Currency Pairs Only not for Gold  Functions Auto Lot Calculation based on Risk Auto stoploss  Auto TakeProfit Breakeven Auto Close Half % Close in percentage with respect to the PIPs Pending Orders BuyLimit Sell Limit with distances BuyStop Sell Stop    with distances Trading Informations Risk in percentage For Multiple trades Combine Takeprofit and Combine Stoplosses
    Here   our more valuable tools SMC Trend Trading   ,  Easy SMC Trading  ,  Institutional SMC Architect Volume Analysis Tools  ,  Volume flow Profile  ,  Market volume profile  , FVG with Volume  , Liquidity Heatmap Profile  ,  Volume Spread Analysis You Give an Instruction: When you run the script, a window pops up with a dropdown menu. You choose exactly what you want it to do from the list (e.g., "Close Profit Only" or "Delete Pending Orders"). It Scans Your Positions: The script then reads
    Overview of "TPS Manual Pro" TPS Manual Pro is an advanced MQL5 Expert Advisor (EA) designed for the MetaTrader 5 (MT5) platform. It serves as a comprehensive "trading cockpit" that combines manual trade execution with automated risk management and institutional-grade market analysis tools. Unlike a fully automated bot that makes trading decisions on its own, this EA is designed to assist you—the trader—by automating the repetitive, high-stress tasks of order management, risk calculation, and st
    Painel Profit is an operational trading panel for MetaTrader 5 created to make manual execution and visual order management easier directly on the chart. The operating principle is simple: the trader selects the symbol, timeframe, volume, entry type, and exit strategy. Based on these commands, the panel sends or organizes the trade through the interface, displaying the entry, take profit, and stop loss levels on the chart for visual monitoring. This product is not a signal robot and does not mak
    Mine Farm
    Maryna Kauzova
    Mine Farm is one of the most classic and time-tested scalping strategies based on the breakdown of strong price levels. Mine Farm is the author's modification of the system for determining entry and exit points into the market... Mine Farm - is the combination of great potential with reliability and safety. Why Mine Farm?! - each order has a short dynamic Stop Loss - the advisor does not use any risky methods (averaging, martingale, grid, locking, etc.) - the advisor tries to get the most
    VOLUME PROFILE SAF-XII MT5 için Profesyonel Market Profile Analizi (Grid tarzı yatırımcılar için rüya indikatör) VOLUME PROFILE (HACİM PROFİLİ) NEDİR? Volume Profile, hacmi zamana göre gösteren geleneksel hacim indikatörlerinin aksine, belirli fiyat seviyelerindeki işlem faaliyetlerini görüntüleyen profesyonel bir kurumsal araçtır. Seçtiğiniz pencere içinde işlemlerin NEREDE gerçekleştiğini ortaya çıkararak şunları belirlemenize yardımcı olur: ADİL DEĞER ALANLARI (VAH/VAL) – İşlemlerin çoğunun
    Delta Profile Volume
    Teresinha Moraes Correia
    Technical Description of the Indicator – Delta Profile for MetaTrader 5 The Delta Profile is an indicator developed for MetaTrader 5 focused on detailed analysis of volume flow within a defined range of candles. It organizes and displays information about the imbalance of positive volumes (associated with upward movements) and negative volumes (associated with downward movements) at different price levels. The result is a clear view of the chart points where the highest concentration of trades o
    Blahtech Supply Demand MT5
    Blahtech Limited
    4.54 (13)
    Was: $299  Now: $99  Supply Demand uses previous price action to identify potential imbalances between buyers and sellers. The key is to identify the better odds zones, not just the untouched ones. Blahtech Supply Demand indicator delivers functionality previously unavailable on any trading platform. This 4-in-1 indicator not only highlights the higher probability zones using a multi-criteria strength engine, but also combines it with multi-timeframe trend analysis, previously confirmed swings a
    VR Grid Mt5
    Vladimir Pastushak
    3.25 (8)
    VR Izgara göstergesi, kullanıcı tanımlı ayarlarla grafiksel bir ızgara oluşturmak için tasarlanmıştır . Standart ızgaradan farklı olarak, VR Izgarası dairesel seviyeler oluşturmak için kullanılır. Kullanıcının seçimine bağlı olarak tur seviyeleri arasındaki adım isteğe bağlı olabilir. Ek olarak, diğer göstergeler ve yardımcı programlardan farklı olarak VR Grid, zaman dilimi değiştiğinde veya terminal yeniden başlatıldığında bile ızgaranın konumunu korur . Ayarlar, set dosyaları, demo versiyonlar
    FREE
    Time and Sales Tick
    Pablo Filipe Soares De Almeida
    Time & Sales Tick Indicator, MetaTrader 5 için geliştirilen bir göstergedir ve gerçek zamanlı tick verilerini gösterir. Fiyat, tick hacmi ve zamanı doğrudan grafikte görüntüler. Özellikler Fiyat, hacim ve zaman bilgilerini içeren tick verilerini grafik üzerindeki bir panelde gösterir. Tick verilerini kullanıcı tarafından belirlenen aralıklara göre gruplandırır, yükselişler yeşil, düşüşler kırmızı renkle gösterilir. Panel, grafiğin istenilen köşesine yerleştirilebilir.
    Горячие клавиши плюс клик левой кнопки мыши на графике. Советник открывает сделки, выставляет лимитные и стоповые ордера, удаляет ордера и закрывает позиции, также  делает реверс  открытых позиций, выставляет прописанные в настройках стоп лосс и тейк профит. (реверс только на неттинговых счетах) При запуске советника можно посмотреть подсказку как действует советник при нажатии клавиши + клик на графике. Правее последнего бара, ниже цены Ctrl+ЛКМ  - OpenSell Правее последнего бара, выше цены C
    Cumulative Volume Delta MA-X MTF (Gradient Momentum ile) Bu indikatör, MetaTrader 5 için çoklu zaman dilimi (MTF) Kümülatif Hacim Deltası (CVD) analizi gerçekleştirir. Tick veya gerçek hacim verilerini analiz ederek alış ve satış baskısı arasındaki net farkı hesaplar ve emir akışı duyarlılığının görsel bir temsilini sunar. İndikatör Mantığı ve Özellikleri İndikatör, hacim analizi için matematiksel bir yaklaşım kullanır: Veri Kaynağı: Hem Gerçek Hacim (Borsa varlıkları için Real Volume ) hem de
    Advanced Volume Profile Analysis Tool for MetaTrader 5 The Kecia Volume Profile Order Finder provides traders with volume profile analysis capabilities. This MT5 indicator combines volume profile visualization with statistical calculations to help identify potential trading opportunities and suggests entry, stop loss, and take profit levels based on market structure. Market Profile Visualization Transform your chart with customizable volume profile visualizations: Multiple visualization options
    TradeControl Pro – MetaTrader için Gelişmiş Trade Yönetim Aracı TradeControl Pro , MetaTrader platformu için geliştirilmiş bir trade yönetim aracıdır ve işlemlerin doğrudan grafik üzerinden düzenli ve verimli bir şekilde yönetilmesini sağlar. Uygulama, açık ve anlaşılır bir kullanıcı arayüzünü otomatik hesaplamalar ve farklı işlem yaklaşımlarına uygun esnek kontrol seçenekleri ile birleştirir. Grafik üzerine entegre edilen panel, tablo yapısında tasarlanmış olup üç ana sekmeden oluşur: Execution
    Here   our more valuable tools SMC Trend Trading   ,  Easy SMC Trading  ,  Institutional SMC Architect Volume Analysis Tools  ,  Volume flow Profile  ,  Market volume profile  , FVG with Volume  , Liquidity Heatmap Profile  ,  Volume Spread Analysis Transform Your Trading with Intelligent Market Insights! The 2025 Spike Killer Dashboard is a powerful MQL5 indicator that combines cutting-edge signal generation with an intuitive crystal dashboard for real-time market analysis. Designed for tra
    VolumeProfile MT5
    Robert Hess
    4.14 (7)
    Description: The Volume Profile displays detailed informations of historical trading activities at certain price levels (Market Profile). Locate the areas with the best prices in the market and get an advantage over other market participants. Features: Customizable Market Profile Shows the "fair" Value Area with 70% of all Volume Shows critical low volume zones Shows VPOC, VAL and VAH Points integrated resource management to reduce the load while working with multiple charts Works on all timefr
    TradePad
    Ruslan Khasanov
    5 (1)
    TradePad hem manuel hem de algoritmik ticaret için bir araçtır. Size hızlı ticaret işlemleri ve çeşitli ticaret enstrümanlarındaki pozisyonların kontrolü için basit bir çözüm sunuyoruz. Dikkat, uygulama strateji test cihazında çalışmıyor! Demo hesabı için uygulamanın deneme sürümü ve tüm araçların açıklaması Uygulama arayüzü yüksek çözünürlüklü monitörler için uyarlanmıştır, basit ve sezgiseldir. Rahat bir çalışma için, tüccara aşağıdaki araç seti sunulur: Ticaret işlemlerini yönetmek, ana grafi
    Tick Volume Chart - MetaTrader 5 için tick hacmine dayalı grafikler oluşturmaya yarayan benzersiz bir araçtır. Tick Volume Chart sayesinde, her bir mumun zamana göre değil, belirli sayıda tick'e göre oluştuğu grafikler inşa edebilirsiniz. Bu, standart zaman tabanlı grafiklerde bulunmayan, piyasa aktivitesini analiz etmede ideal bir hassasiyet sağlar. Özel sembolleri destekleyen tüm indikatörleri ve Expert Advisor'ları kullanabilirsiniz. Oluşturulan grafiklerle çalışmak, standart grafikler kadar
    Bu ürünün alıcıları ayrıca şunları da satın alıyor
    Farmed Hedge Yield Farming | All Markets (Manual - Hybrid - Semi/Automated EA) MULTI-ASSET SUPPORT Trade any asset available on your broker - Forex: Major, Minor, Exotic pairs - Crypto: BTC, ETH, XRP, SOL, BNB - Stocks: Apple, Tesla, Amazon, Google, etc. - Commodities: Gold, Silver, Oil, Gas - Indices: US30, NAS100, SPX500, DAX40 - Any CFD your broker offers VERIFIED TRADING RESULTS - Farmed Hedge Yield Axi Copy:  https://www.mql5.com/en/signals/2356376 - Farmed Hedge Yield Exn Copy:   https:/
    The product will copy all telegram signal to MT5 ( which you are member) , also it can work as remote copier.  Easy to set up, copy order instant, can work with almost signal formats, image signal,  s upport to translate other language to English Work with all type of channel or group, even channel have "Restrict Saving Content", work with  multi channel, multi MT5 Work as remote copier: with signal have ticket number, it will copy exactly via ticket number. Support to backtest signal. How to s
    EASY Insight AIO – Akıllı ve zahmetsiz yatırım için hepsi bir arada çözüm Genel Bakış Tüm piyasayı — Forex, Altın, Kripto, Endeksler ve hatta Hisseler — saniyeler içinde, manuel grafik incelemesi, gösterge kurulumu ya da karmaşık ayarlar olmadan analiz edebildiğinizi hayal edin. EASY Insight AIO , yapay zekâ destekli yatırım için nihai, kullanıma hazır dışa aktarma aracınızdır. Tüm piyasanın kapsamlı bir anlık görüntüsünü tek bir temiz CSV dosyasında sunar; bu dosya ChatGPT, Claude, Gemini, Pe
    LIMITED SUMMER SALE -40% ! ONLY $470 insead of $790!  Maximum real discount! The core idea: using the user interface, you configure the parameters the chart must meet before entering a position (or positions), choose which entry models to use, and set the rules for when trading and planning should end. Lazy Trader  handles the rest: it  takes over all the routine chart watching and execution! full description  :: 3 key videos [1] ->  [2]   ->  [3] What can it do? - Understands Larry Williams
    Quant AI Agents are independent trading Expert Advisors. Instead of trading using a fixed strategy like other conventional EAs, Quant AI Agents   is a   multi-agent AI trading framework   that turns natural-language strategy prompts into live.  WANT THE SAME RESULTS AS MY LIVE SIGNAL?   Use the exact same brokers I do:   IC MARKETS , IC TRADING   .  Unlike the centralized stock market, Forex has no single, unified price feed.  Every broker sources liquidity from different providers, creating un
    YuClusters
    Yury Kulikov
    4.93 (43)
    Attention: You can view the program operation in the free version  YuClusters DEMO .  YuClusters is a professional market analysis system. The trader has unique opportunities to analyze the flow of orders, trade volumes, price movements using various charts, profiles, indicators, and graphical objects. YuClusters operates on data based on Time&Sales or ticks information, depending on what is available in the quotes of a financial instrument. YuClusters allows you to build graphs by combining da
    FUTURES ORDERFLOW FOOTPRINT CHART Professional OrderFlow EA for MetaTrader 5 Version 1.01| Professional tool for real traders | Institutional-Grade Visualization STRATEGY TESTER USERS - PLEASE SELECT EVERY REAL TICK WHEN TESTING AND YOU HAVE DOWNLOADED HISTORICAL DATA. IF YOU SEE A WAITING SCREEN AND IT IS NOT DOWNLOADING, IT MEANS YOU HAVE LOW HISTORICAL DATA. TRY 1 MIN AND 5 MIN FIRST ON 1 DAY DATA. ONE DAY DATA SHOULD BE THE NEWEST AND MOST CURRENT DATE. PLEASE WAIT UNTIL THE MARKET HAS ROL
    AI Agent Supervisor is NOT an Expert Advisor. AI Agent Supervisor   is a   multi-agent AI risk & portfolio supervisor   that watches every EA on your account and intervenes in real time.  WANT AN AI PORTFOLIO MANAGER WATCHING YOUR FLEET 24/7?   Run your fleet on the same brokers I do:   IC MARKETS , IC TRADING   .  Unlike the centralized stock market, Forex has no single, unified price feed.  Every broker sources liquidity from different providers, creating unique data streams. The Supervisor r
    Telegram to MT5 Pro — Advanced Telegram Signal Copier with Auto-Fix, Multi-TP, Risk Control and Full Trade Management Telegram to MT5 Pro — Profesyonel Telegram Sinyal Kopyalayıcı Telegram to MT5 Pro, Telegram’dan gelen sinyalleri MetaTrader 5 hesabına otomatik olarak doğrudan uygulayan yüksek performanslı bir trade kopyalayıcıdır ve risk, işlem yürütme ve trade yönetimi üzerinde tam kontrol sağlar. Sistem iki bileşenden oluşur: • MetaTrader 5 içinde çalışan Expert Advisor (EA) • Telegram’a bağ
    QCML Assistant
    Maxime Turcotte-lafreniere
    QCML Assistant MT5 Your Trading. Our Assistant. Your Edge. Looking for a tool that completely transforms your experience on MetaTrader 5? QCML Assistant is the all-in-one solution built by traders, for traders. Just one tool installed on your chart, and you get access to an ultra-complete, ultra-fast, and ultra-simple trading platform. No more hours wasted setting up your workspace. No more complicated trade entries. With QCML Assistant, everything becomes simple, smooth, and efficient right fro
    Royal Copier
    Janet Abu Khalil
    5 (1)
    Royal Copier — Profesyonel MT5 Trade Copier Royal Copier, MetaTrader 5 için profesyonel, gerçek zamanlı yerel bir trade copier çözümüdür. Artık her iki işlev de tek bir MT5 Expert Advisor içinde yer almaktadır. Giriş ayarlarından EA’nın Master Modu veya Client Modu ile çalışmasını seçmeniz yeterlidir. Bu, aynı EA’nın kaynak hesapta da alıcı hesapta da kullanılabileceği ve orijinal copier davranışının korunacağı anlamına gelir. Royal Copier, hesaplar arasında en yaygın tüm kopyalama kombinasyonla
    Custom Alerts AIO: Tüm Piyasaları Takip Et — Hiçbir Kurulum Gerekmez Genel Bakış Custom Alerts AIO , hiçbir ek yapılandırma gerektirmeyen, kullanıma hazır bir piyasa izleme çözümüdür. Gerekli tüm göstergeler — FX Power, FX Volume, FX Dynamic, FX Levels, IX Power — iç yapısına gömülüdür. Grafik görüntülemesi olmadan çalışır, bu da onu sessiz ve verimli bir şekilde gerçek zamanlı alarm üretimi için mükemmel hale getirir. Brokerınızın sunduğu tüm varlık sınıflarını destekler: Forex, Metaller, End
    Prop Firm Os
    Gayathiri Gopalakrishnan
    5 (1)
    PROP FIRM OS Structured Trading Assistant for MetaTrader 5 PROP FIRM OS is a structured trading assistant designed for MetaTrader 5 users who prefer rule-based market analysis and organized trading workflows. The Expert Advisor combines market analysis tools, scanner functions, dashboard monitoring, alerts, risk-control settings, and trade management features inside one system. PROP FIRM OS is designed to help traders follow selected rules, filters, and monitoring conditions during trading activ
    ManHedger MT5
    Peter Mueller
    4.83 (6)
    THIS EA IS A SEMI-AUTO EA, IT NEEDS USER INPUT. Manual & Test Version Please TEST this product before BUYING  and watch my video about it. The price of the ManHedger will increase to 250$ after 20 copies sold. Contact me for user support or bug reports or if you want the MT4 version! MT4 Version  I do not guarantee any profits or financial success using this EA. With this Expert Advisor, you can: Implement your own Zone Recovery strategy to capitalize on trending markets. Create Grid trading s
    Discord Signal Notifications — это мощный инструмент для трейдеров, проповодов и управляющих счетами, который автоматически отправляет все ваши торговые события в канал или чат Discord. Главное преимущество — Глобальный мониторинг. Вам не нужно устанавливать советник на каждый график. Достаточно запустить одну копию утилиты на одном любом окне, и она будет отслеживать действия по всем инструментам и всем счетам в вашем терминале одновременно. Основные возможности Глобальный мониторинг счёта Ути
    Crystal Trade Manager – Advanced MT5 Risk and Trade Control Utility Overview Crystal Trade Manager (CTM) is a professional MetaTrader 5 utility designed for risk management, trade automation, and instant execution control. It provides traders with an integrated system for protecting equity, managing daily drawdowns, controlling lot sizes, and applying automation features such as automatic SL/TP, break-even, and trailing stop. The tool is suitable for manual traders, prop-firm challenge particip
    Global Investing FX Terminal , MetaTrader 5 için hepsi bir arada bir FX dashboard'udur — merkez bankası politika faizleri, CFTC COT pozisyonlanması, carry sıralamaları, ekonomik sürprizler, opsiyon skew'u, perakende duyarlılığı ve korelasyonlar, toplamda on üç panel — titremesiz tek bir canvas katmanında görüntülenir ve tek bir ekli EA'dan her 10 saniyede bir güncellenir. Harici yazılım gerekmez. Profesyonel FX analizi, normalde ayrı platformlarda bulunan verilere eş zamanlı erişim gerektirir: f
    DİKKAT : Ücretsiz deneme sürümü için web sitemi ziyaret edin. Kullanım Kılavuzu RiskGuard Management — Tavizsiz bir ticaret için nihai yardımcınız. Lot Calculator — Otomatik lot büyüklüğü hesaplama. Quantum — Kârı maksimize etmek ve drawdown'u azaltmak için otomatik risk. Automatic Journal — Dahil edilmiştir ve web sitemden ücretsiz indirilebilir. Automatic Screenshot — İki ekran görüntüsü: biri işlem açılışında, diğeri kapanışında. Partial Profit — Akıllı şekilde yönetilen kısmi çıkışlar. Sma
    One button. One trade. MT5 Trading Deck is a hotkey trading panel for MetaTrader 5 that turns the platform into a keyboard-driven execution cockpit. Stop loss, take profit and lot size are pre-calculated for every key; the moment you press, a market order is live on the broker. A complete technical user manual is attached in the product Comments section. It documents every input parameter, the full hotkey map, the recommended Stream Deck XL layout, and the advanced workflows for Pre-Limit orders
    Gamma Edge Pro MT5 — GexBot Classic API Integration Gamma Edge Pro   brings institutional-grade   Gamma Exposure (GEX) data   directly onto your MetaTrader 5 chart — the same data used by professional options traders to anticipate price magnets, hedging flows, and dealer positioning. Powered by the   GexBot Classic API , this indicator automatically maps options market data from US-listed instruments onto any   MT5 CFD instrument   — Forex pairs, Gold, indices, and more — with intelligent price
    # If you have any other requirements or are interested in collaboration, please contact  dev.quantech.london@gmail.com . Flash Trade (FT) Most friendly manual trading tool. Easy operation to secure your funds. Features of FT Click the chart to trade fast FT supports market orders and pending orders Click twice to complete the order and set SL and TP Click trice to complete the pending order and set SL and TP Automatically set the stop-loss amount of each order to a fixed percentage of the bala
    Trend Cue Basket Manager
    Mohammadreza Faghanimakrani
    5 (1)
    Trend Cue Basket Manager is a semi-automatic basket management utility for MT5 hedging accounts. After purchase, please send me a message.  I will send you the bonus package and basic setup guidance. The idea is very simple: You open the first trade manually. Trend Cue Basket Manager manages the basket after entry. It does not give buy or sell signals by itself. It does not choose the market direction for you. It does not open the first trade automatically. The first decision is always yours. Af
    The Performance Logger is a utility for MetaTrader 5 designed to track and report account metrics. It identifies trades based on specific criteria and provides summaries of account activity. Main Functions Automated Reporting : Generates summaries of account performance and sends them to specified communication channels (Telegram or Discord) on a weekly, monthly, or yearly basis. Strategy Analysis : Organizes performance data based on the specific Expert Advisor or strategy used for each trade.
    The product will copy all  Discord  signal   to MT5   ( which you are member  ) , also it can work as remote copier.  Easy to set up. Work with almost signal formats, support to translate other language to English Work with multi channel, multi MT5. Work with Image signal. Copy order instant, auto detect symbol. Work as remote copier: with signal have ticket number, it will copy exactly via ticket number. How to setup and guide: Let read all details about setup and download Discord To MetaTrader
    What Exactly Is A Smart Trading Tool? Smart Trading Tool   was developed for fast and comfortable trading of the financial markets especially for   ORDER BLOCKS TRADERS .   It provides traders functionalities, such as: A Drawing Tool One-Click Trading Panel Automated Lot Sizes Calculation   based on your risk appetite & Money Management ( Watch this video , how this tool can help manage your risk per trade better!) Built in PRICE LEVELS (Fibonacci, Round Numbers, Daily hi-low, etc) Shows Trading
    The real‑time view of what is happening inside the market. Footprint Secrets brings detailed analysis directly into MetaTrader 5. It shows where volume is trading, how buyers and sellers are interacting, and how liquidity shifts as the market evolves. Designed for traders who want a precise, real‑time understanding of market behavior. Check out the free preview version here:  https://www.mql5.com/en/market/product/172398 Benefits for the Trader See the real activity behind price . Footprint ch
    Features   With MT5 to Interactive Brokers(IB) Trader, you can: 1. Load chart data from IB to MT5, and Analyze with all standard or customer Indicators. 2. Place Orders to IB Account Directly in MT5. 3. Make your Own EAs upon IB Securities by only making minus changes of the trading function. Usage 1) Installation Copy the "Mt5ToIBTraderEn.ex4" and sample files to [MT5 Data Folder]->MQL5->Experts.  2)  MT5 Settings Add the IP Address to the MT5 Allowed URLs in 'Tools->Options->Expert Adviso
    Mt5 To InterativeBrokers Copier allows you to copy deals from MT5 account to Interactive Brokers. With this, you can run your EA strategy on a MT5 Demo/Real Account, then copy all the deals to Interactive Brokers account real time. Features: 1. Copy or Invert-Copy deals Realtime from MT5 to IB Account. 2. Synchronizing positions of both accounts periodicaly, in case any missing copying. 3. You can choose only Buy position or Sell position. Symbols Setup: General Format:  {MT Symbol} -> {IB S
    Introduction Our system is more than just a tool—it’s your personal guide in the dynamic trading landscape. Expertly developed and optimized using advanced strategies, this groundbreaking predictor gives traders a powerful edge. It’s not just about the features; it’s about a trading journey that stands out from the crowd. Get ready for an enhanced trading experience like never before! What It Does Next Candle Prediction: Imagine gaining insights into the market’s next move before it happens. Our
    Here is the corrected, MQL5-compliant version of your second product description. I have removed the custom bullet point symbols, cleaned up the list formatting to use standard markdown, and organized the setup guide into clean, numbered steps. PropFolio Command Manager Pro is an advanced, multi-symbol execution terminal designed to automate your custom arrow indicators. Simply enter the name of your arrow indicator into the settings, and the Command Manager will monitor up to 30 currency pairs
    Yazarın diğer ürünleri
    ================================================================================ POC BREAKOUT - V20.72. Full Professional Grade Toolkit ================================================================================ POC Breakout is a full MetaTrader 5 trading dashboard for discretionary traders who want breakout signals, Point of Control (POC) context, volume profiles, order flow, market structure, news, alerts, and advanced trade planning in one professional workspace. Attached directly to you
    FUTURES ORDERFLOW FOOTPRINT CHART Professional OrderFlow EA for MetaTrader 5 Version 1.01| Professional tool for real traders | Institutional-Grade Visualization STRATEGY TESTER USERS - PLEASE SELECT EVERY REAL TICK WHEN TESTING AND YOU HAVE DOWNLOADED HISTORICAL DATA. IF YOU SEE A WAITING SCREEN AND IT IS NOT DOWNLOADING, IT MEANS YOU HAVE LOW HISTORICAL DATA. TRY 1 MIN AND 5 MIN FIRST ON 1 DAY DATA. ONE DAY DATA SHOULD BE THE NEWEST AND MOST CURRENT DATE. PLEASE WAIT UNTIL THE MARKET HAS ROL
    VOLUME BUBBLES ORDERFLOW FOOTPRINT PROFESSIONAL Expert Advisor for MetaTrader 5 Complete Feature Documentation Introduction: Volume Bubbles OrderFlow Footprint Professional is an advanced order flow visualization tool designed for the MetaTrader 5 platform. It provides institutional-grade market analysis through real-time volume bubbles visualization, volume profiling, and sophisticated order flow analysis. This Expert Advisor transforms raw market data into actionable trading intelligence, hel
    Filtrele:
    Agus Triono
    43
    Agus Triono 2026.07.01 17:50 
     

    Don't take this shitv if you want orderflow bacause this not Tell you the area of absorption of exhaustion area Plus they don't teach you how to use it effectively instead they tell you to find out for yourself. Can't a seller make a live trade video and teach the buyers? It's just the imbalance of supply and demand that's confusing you.

    Abdul Jalil
    1202
    Geliştiriciden yanıt Abdul Jalil 2026.07.14 10:35
    Hi This is second review you have of my product. You also purchased my futures footprint chart. You have both left negative feedback because you can't read the footprint. Either you are delibertley leaving negative feedback on both of my orderflow. I advised you to learn about orderflow and footprint. You should not have purchased before learning how to read an orderflow. I would advised you that footprint principles are the same and there are tons of resources you can find. If you confuse yourself from orderflow, it will be best to familiar your self to read and understand footprint. My products does not require a negative feedback because you failed to read the orderflow.Both my footprint charts are the best you will get here the quality, the visuals, the the performance umatched in the marketplace. Good day
    Digital Revolution
    68
    Digital Revolution 2026.05.12 10:46 
     

    Great Tool and A++ service

    Abdul Jalil
    1202
    Geliştiriciden yanıt Abdul Jalil 2026.05.12 10:47
    Thank you my friend. Greatly appreciated. Kind regards AJ
    裕文 潘
    424
    裕文 潘 2026.04.20 12:17 
     

    This is a powerful tool.

    Abdul Jalil
    1202
    Geliştiriciden yanıt Abdul Jalil 2026.04.20 12:43
    Thank you so much Kind regards AJ
    zeke21t2
    633
    zeke21t2 2026.04.09 04:04 
     

    I find it invaluable for refining my discretionary scalping tactics by displaying the timeframe in M5. Aside from being difficult for those with presbyopia XD, it's a truly invaluable utility tool, a treasure trove for any trader. Stop guessing where the market will go. See the actual order flow and trade with confidence alongside institutional traders. (by the author) That's absolutely right.

    Abdul Jalil
    1202
    Geliştiriciden yanıt Abdul Jalil 2026.04.09 16:25
    Hi Thank you so much for the feedback, greatly appreciated. Take care AJ
    jackie1289
    27
    jackie1289 2026.02.25 16:04 
     

    excellent supp from dev

    Abdul Jalil
    1202
    Geliştiriciden yanıt Abdul Jalil 2026.04.09 16:25
    Thank you for the feedback. Take care AJ
    Değerlendirmeye yanıt