Early Reversal Detector
- Indicators
- Version: 1.10
- Activations: 5

Catch Reversals Before They Happen
What This Indicator Does NOT Do
This is not a buy/sell signal generator. It doesn't tell you when to enter or exit trades automatically.
What This Indicator DOES Do
Early Reversal Detector identifies shifts in price behavior to pinpoint optimal entry points with precision.
How It Works
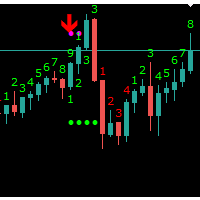
The indicator creates candles in a separate panel that look similar to price candles on your main chart - but with a crucial difference:
Regular chart candles form with every single tick movement.
Early Reversal Detector candles only form when price jumps by your specified threshold amount.
For example: If you set the threshold to "5" on EURUSD, the indicator only registers a tick when price moves 0.00005 or more between ticks. Smaller movements are filtered out entirely.
Why does this matter?
By filtering out noise and focusing only on significant price movements, you can see the real pressure behind price action. This reveals something critical that most traders miss:
Even when substantial volume enters against the current trend, price often continues in the original direction for 1-2 more bars before reversing.
Early Reversal Detector catches this shift approximately 1-2 bars BEFORE the actual reversal occurs on your main chart.
The Story Behind This Indicator
I originally developed this indicator to identify high-volume trades in Forex markets (since Forex lacks the volume data available in Futures markets). But like Viagra being discovered while researching heart medication, I discovered something far more valuable:
This indicator is extraordinarily effective at catching reversal points.
For the past two years, I've used it exclusively for this purpose. While you'll discover multiple ways to use this tool, reversal detection is where it truly shines - so much so that other applications pale in comparison.
How To Use It
The indicator offers two powerful entry strategies:
Strategy 1: Conservative Approach (Dual Confirmation)
- Wait until you see potential reversal patterns in price action on your main chart
- Critical Step: Even if price appears to be reversing on the main chart, if the indicator panel is still showing downward movement, the pressure hasn't shifted yet - stay out
- Look for a proper reversal pattern in the indicator panel itself - this could be a doji followed by 2 bullish candles, or any classic price action reversal signal
- Only enter when BOTH panels confirm the reversal
This approach gives you the highest probability setups with maximum confidence.
Strategy 2: Aggressive Approach (Early Entry)
- Watch the indicator panel for reversal signals
- If you see a reversal pattern in the indicator panel BUT the main chart hasn't reversed yet, you can enter immediately to catch price at the absolute bottom
- This works because the indicator often signals the reversal 1-2 bars BEFORE it appears on the main chart
Why does this work? The indicator detects the fundamental change in price behavior - the shift in pressure - before it becomes obvious in regular price action.
Both strategies give you incredible confidence with tight stop-losses. Because you're entering at the precise point where pressure shifts, your stops can be much tighter than traditional entries. Tighter stops mean you can trade with larger position sizes while maintaining proper risk management.
Settings Guide
The indicator offers two filtering modes:
Manual Threshold (Advanced Users)
- threshold: Enter a specific point value (e.g., 5 for 0.00005 movement)
- When set above 0, this overrides the Auto Filter
- Gives you direct control over sensitivity
Auto Filter (Recommended for Most Users)
When Manual Threshold = 0, the indicator automatically calculates optimal thresholds based on recent price behavior.
Four Filter Levels:
- Whale: Only extreme price jumps (strongest filter) - Best for catching major reversals
- Tsunami: Large movements (strong filter) - Balanced approach for significant moves
- Wave: Moderate changes (default) - Good all-around sensitivity
- Whisper: Small movements (most sensitive) - Catches subtle shifts
Display Settings
- Customize candle colors (Neutral/Bullish/Bearish)
- max_bar_to_look_back: Number of historical bars to display (default: 100)
Pro Tip: Start with the "Wave" auto filter. Adjust to "Tsunami" or "Whale" if you're getting too many signals, or "Whisper" if you're missing reversals.
Important Notes:
- This indicator works on timeframes up to Daily (D1). It requires tick data analysis and is not supported on Weekly or Monthly timeframes.
- First Load: When you first add the indicator to your chart, it analyzes historical tick data for all lookback bars. This may take a few moments to complete - the processing time depends on your max_bar_to_look_back setting. Higher values will take longer to initialize.