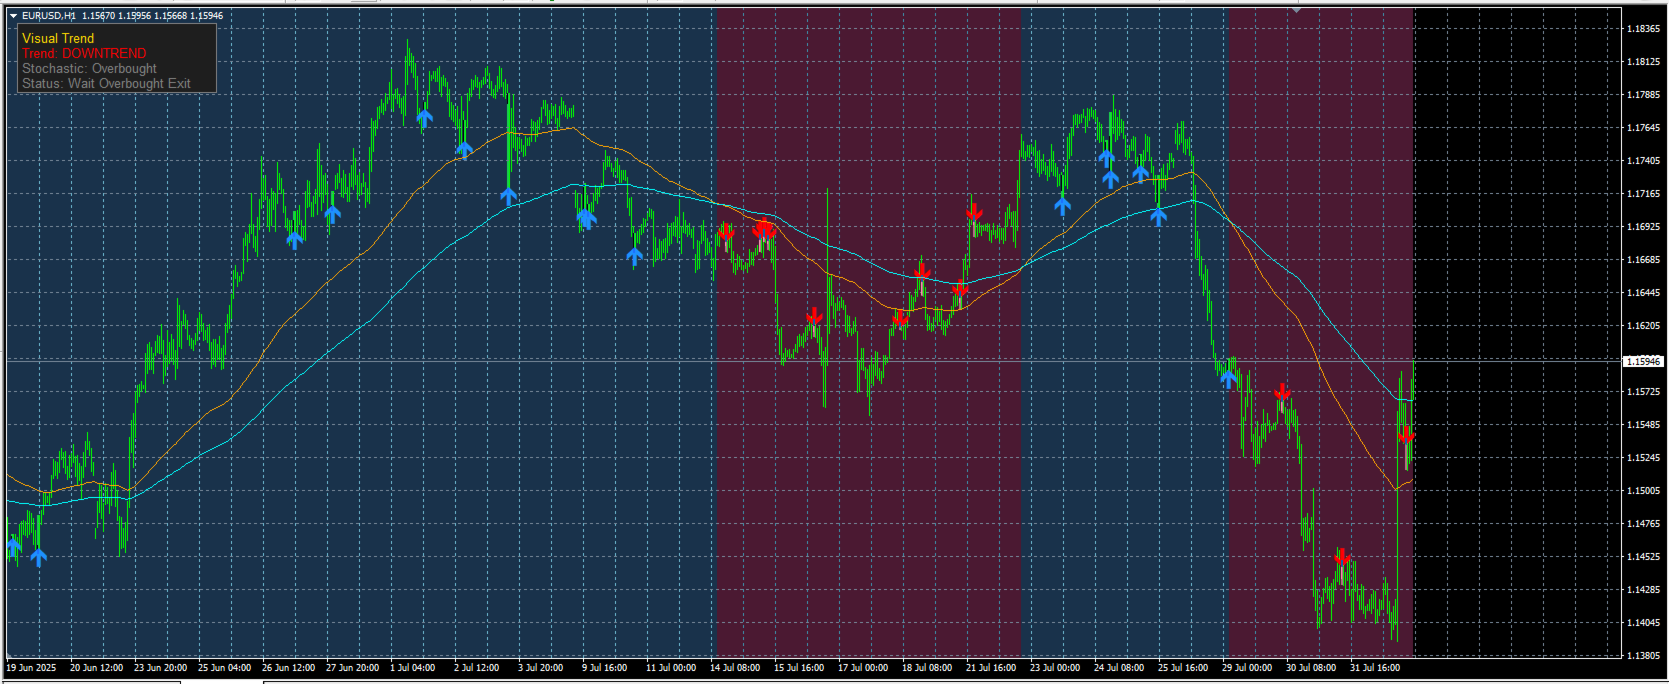
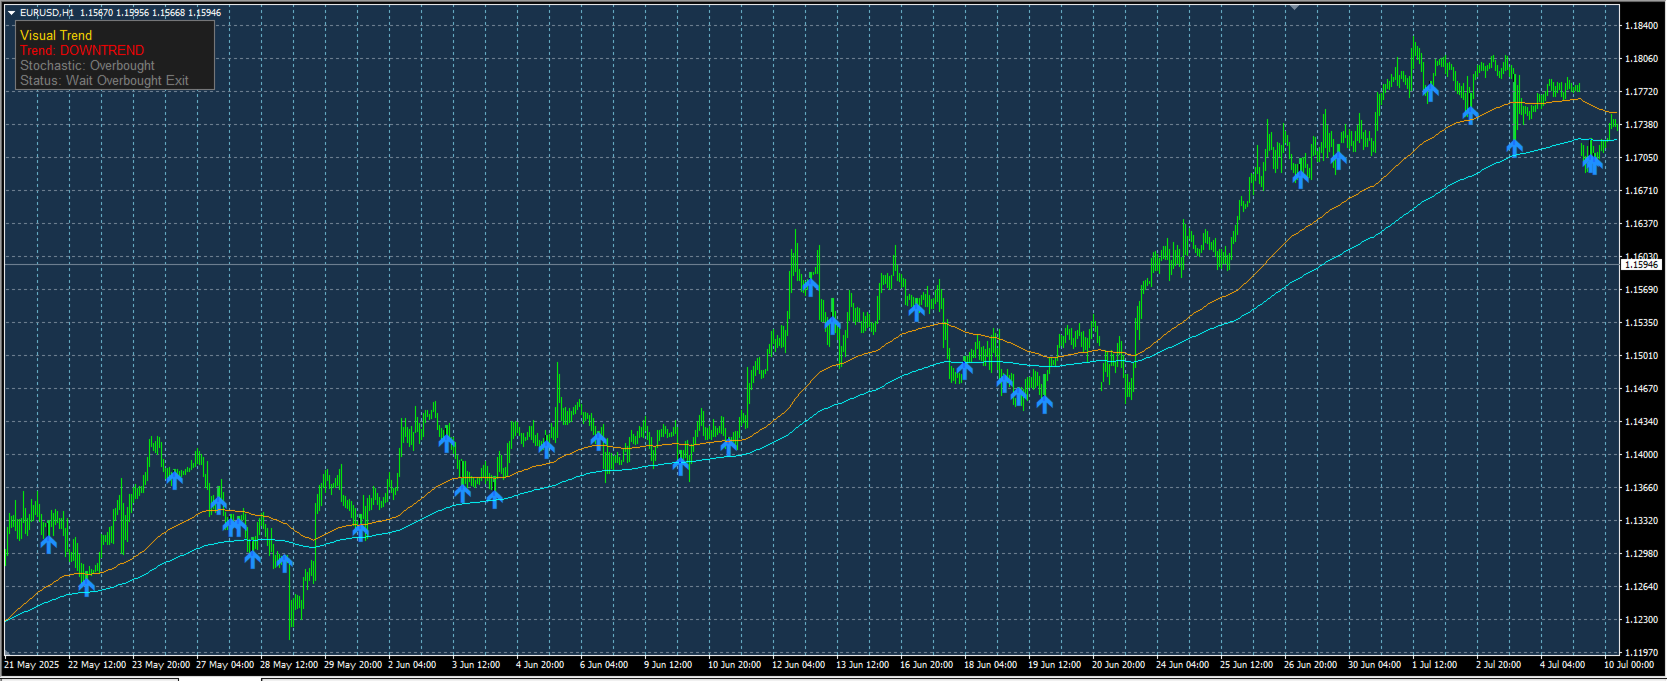
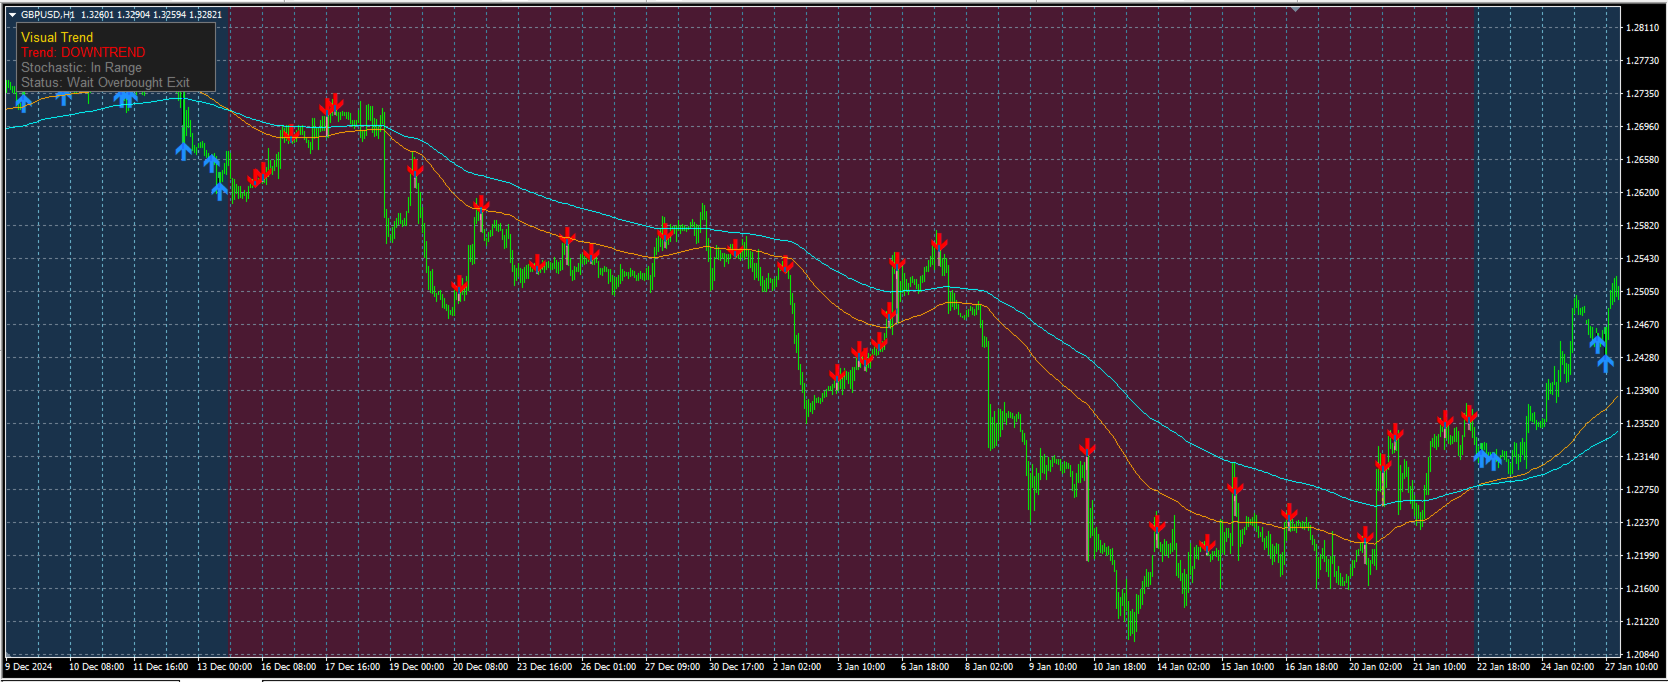
Visual Trend
- Indicators
- Gennady Filimonov
- Version: 1.0
- Activations: 5
Visual Trend is a simple and effective tool that helps you quickly assess the market situation and find trend-based entry points. It eliminates the need to use multiple indicators at once by combining all the essentials in one place.
Key Features:
-
Background Coloring: The chart background automatically changes color based on the trend direction (blue for uptrend, pink for downtrend).
-
Clear Signals: Trend-following entry points are marked with arrows.
-
Signal Candle Highlight: The candle on which a signal appears is highlighted with a bright color so you won't miss it.
-
Info Dashboard: A compact panel in the corner displays the current trend and stochastic status.
How It Works:
The indicator is based on two classic tools:
-
Moving Averages define the overall trend direction.
-
Stochastic Oscillator finds the entry moment after a price pullback.
A signal only appears when both conditions align. Arrows do not repaint.
Settings:
The indicator is ready to use out of the box and requires no complex configuration. In the input parameters, you can adjust only the colors of all elements to match your personal chart theme.
Disclaimer: This indicator is an auxiliary tool. Please use it as part of your trading strategy and risk management rules.