Fractals MTF

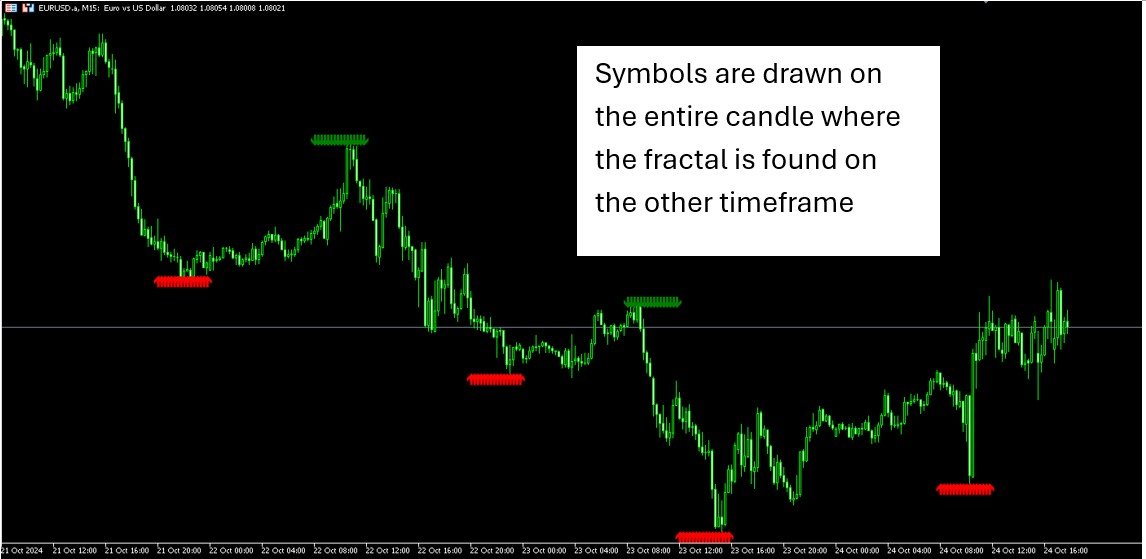
Multi-Timeframe Fractal Indicator Description for MQL5

Introducing the Multi-Timeframe Fractal Indicator!

Key Features:

  • Multi-Timeframe Analysis: Analyze Fractals on a timeframe independent of your chart's current timeframe. Gain insights from higher timeframes for informed trading decisions.
  • Customizable Parameters:
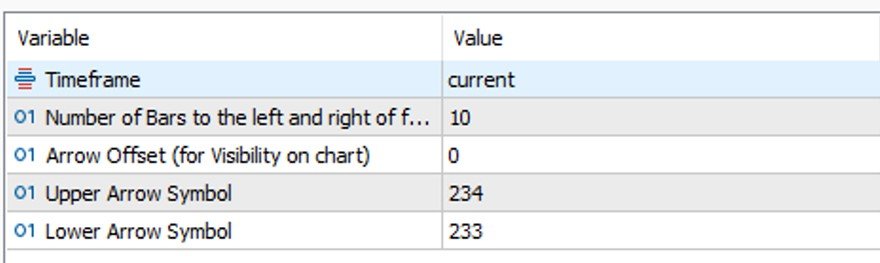
    • Timeframe: Choose the timeframe on which Fractals will be calculated (e.g., Daily, H4, etc.).
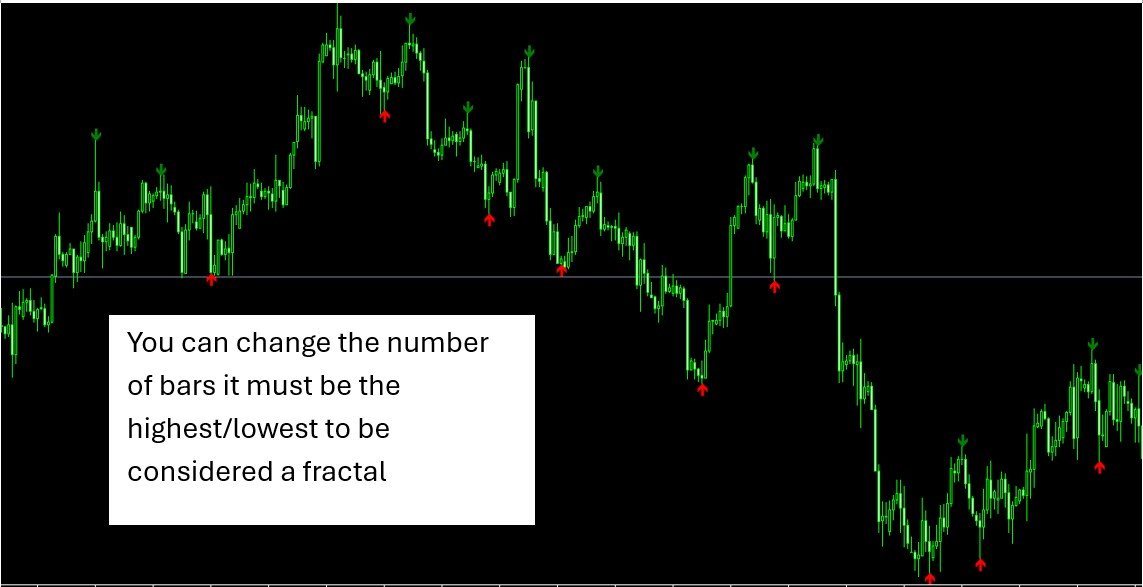
    • Number of Bars: Specify the number of bars considered around a potential Fractal for confirmation.
    • Arrow Shift: Adjust the position of the indicator's arrows for better visibility on your chart.
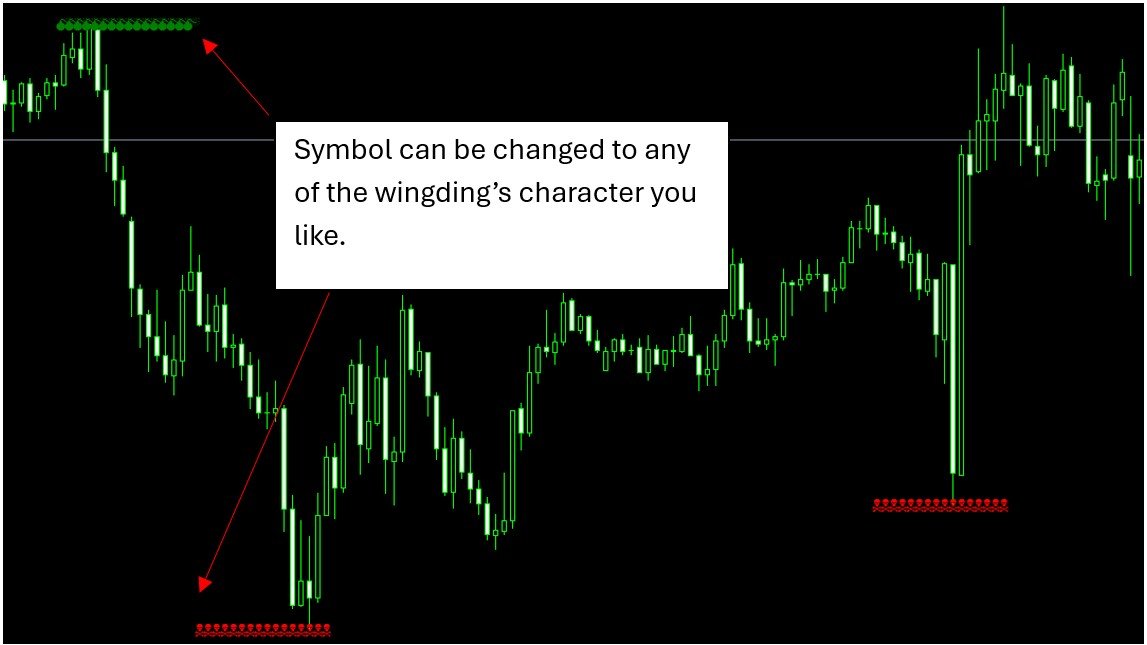
    • Arrow Symbols: Select from a variety of arrow styles to represent Fractals.

Benefits:

  • Improved Trade Timing: Identify potential turning points earlier by leveraging Fractals from different timeframes.
  • Enhanced Confirmation: Customize the indicator's parameters to refine your Fractal identification and strengthen your trading signals.
  • Clear Visualization: Easily spot Fractals with visually distinct arrows placed directly on your chart.

Who is this Indicator For?

This indicator is ideal for traders who:

  • Utilize Fractal analysis in their trading strategy.
  • Want to analyze Fractals on a timeframe independent of their chart view.
  • Seek a customizable tool to refine their Fractal identification.

Recommended products
is a versatile analytical tool designed for both advanced traders and beginners. It combines classic trend line analysis with automatic Fibonacci level plotting to deliver precise market entries and structural clarity. Built as an intuitive and clean on-screen dashboard, this indicator simplifies multi-timeframe analysis without cluttering your main workspace. Technical Analysis and Entry Points The indicator automates the most critical aspects of price action and structural trading: Trend L
Market Scoring System
Vincent Jose Proenca
MARKET SCORING SYSTEM - Advanced Multi-Timeframe Trading Indicator Professional market analysis system combining technical indicators, machine learning patterns, and multi-timeframe confirmation for precise trading signals. KEY FEATURES: - Multi-Timeframe Analysis: Confirms signals across different timeframes (M5, H1) for higher probability trades - Smart Scoring Engine: Calculates Trend, Range, and Uncertainty scores with weighted analysis over 25 candles - Market Intention Detection: Re
TIF – Trend Integrity Filter Trade With the Trend. Filter the Noise. TIF (Trend Integrity Filter) is a professional trend-analysis indicator designed to help traders identify the dominant market direction and filter out lower-quality trades that go against the prevailing trend. TIF can be used as a standalone trend filter or combined with your existing trading strategy, entry indicator, price action system or Expert Advisor. KEY FEATURES Trend Integrity Analysis Helps identify the cur
All in One Multi Indicator
Teerathad Booranawisedkul
Overview Comprehensive technical analysis indicator combining 20+ essential trading tools in a single chart display. Moving Averages EMA (Exponential Moving Average): 9, 21, 50, 200 periods SMA (Simple Moving Average): configurable period Customizable colors and line widths Price position indicators (above/below) Oscillators & Momentum RSI (Relative Strength Index): adjustable overbought/oversold levels MACD (Moving Average Convergence Divergence): customizable fast/slow/signal periods Stochasti
Fabulous Four FAB4 Indicator
Daniel Raimundo De Oliveira
The Exclusivissimo FAB4 (Fabulous Four) Indicator is an institutional-grade chart analysis tool designed for MetaTrader 5. Built for professional traders who demand precision, this indicator automatically maps the most critical liquidity zones and momentum shifts in the market, keeping your chart clean and your entries surgical. Whether you are trading Forex, Indices, or Stocks, the FAB4 Indicator provides a complete institutional roadmap right on your screen, highlighting true market intent wit
NQX Retracement Entry Burst
Marcel De Oliveira Farias
NQX Retracement Entry Burst is a signal indicator for MetaTrader 5: retracement entry signals (it only signals when volatility is expanding above its recent average). Proprietary NQX logic that detects a pullback into a key retracement zone that holds. It only signals when volatility is expanding above its recent average. It draws the suggested entry, a short stop and long targets (3:1, 5:1, 10:1, up to 20:1 on swing); you decide. What it draws on the chart - An arrow on the closed signal candle
Boom Rocket
Cairo Neto Sergio Ndava
This Expert Advisor is designed exclusively for trading the Boom market on the 1-minute timeframe. It operates solely in the sell direction, focusing on precise exits at specific moments in time. Unlike typical signal bots, this EA doesn’t generate buy/sell alerts but executes trades based on a well-defined strategy to take advantage of price movements during market pullbacks. Key Features: Works exclusively for Boom market : The EA is tailored for Boom markets and functions only on the Boom as
HTF Open Markers + ICT Silver Bullet Zones — Usage & Strategy Guide What it draws Session 1 / Session 2 lines : vertical lines at the open of every bar on two independently configurable higher timeframes (defaults: H4 and D1), including a projected line for the rest of today's not-yet-opened bars on sub-daily timeframes, so you can see where the next candle will open before it happens. ICT Silver Bullet zones : shaded rectangles over the three classic ICT kill-zone windows, converted from New Yo
FREE
FTS Delta Hyper Second Overview FTS Delta Hyper Second is a lightweight, fast, and highly accurate rendering tool that provides a “second‑based chart that can be overlaid directly on a minute chart.” In standard MT5, second charts must be displayed in a separate window. This tool includes a second‑chart canvas that can be overlaid directly on the existing minute chart . Within the flow of the minute chart, you can visually confirm fine‑grained waveforms such as 5‑second, 15‑second, and 30‑
FREE
High And Low MT5
Dmitriy Parfenovich
On the current chart, this indicator displays candlestick highs and lows of another time frame. Input Parameters: TimeFrame - chart time frame whose data will be displayed on the current price chart (by default, H12). Time Zone - shift of the indicator by time zone relative to the broker's time (by default, Broker-1). If the broker's time zone is UTC+1 and the Time Zone parameter is set to Broker-1, the bends of the indicator will be plotted in multiples of Greenwich Time. Indicator buffer value
Xausd pro EA
Sushil Kushawaha
Use only RAW Spread AC use SL 270 & TP 2700 1:30 risk Reward EA Key Advantages Automated, hands-free trading — no manual monitoring required once attached to the chart. Multi-layer signal confirmation — combines an RSI oscillator, Ichimoku Kinko Hyo, and a time filter before entering a trade, reducing false signals. Step trailing stop protection — profits are locked in gradually as price moves in your favor, rather than using a single static trailing distance. Built-in risk controls — fixed Stop
Fibonacci levels, entry rules, and automated execution on one chart. Dynamic Fibonacci Levels EA for MetaTrader 5 selects two confirmed swing points, draws a Fibonacci grid between them, and trades near the selected levels. The Expert Advisor assesses price structure, momentum, the age of swing points, range, and volatility. The working grid can be rebuilt when market structure changes. Its anchor points can also be moved manually. Main features Anchor selection. Analyzes up to 220 bars. Candida
Boom Boom BTC X EA
Kamalesh Bhupatbhai Mevada
BTC X EA BTC X EA is an automated Bitcoin trading system for MetaTrader 5. It evaluates current market conditions, places pending orders and manages trades through stop loss, take profit and trailing protection. Trading Specifications Platform: MetaTrader 5 Instrument: Bitcoin against the US dollar Symbol: BTCUSD, including broker suffixes such as BTCUSDm and BTCUSD# Timeframe: M30 — 30 minutes Tested starting capital: USD 1,000 Leverage used in testing: 1:500 Tested account type: Hedging Test a
The indicator is designed to close positions on the market in time. For example: to take profits ahead of schedule if the price has not reached TakeProfit, and the market is turning around. The indicator analyzes the momentum, not the trend. He does not give any information about the trend. The indicator is well suited for finding divergence. The Ershov 38 Parrots indicator dynamically adjusts to the market and detects price movement impulses of medium and high amplitude. It almost does not rea
Pivot Scenario Dashboard is a compact trading indicator designed to display daily pivot-based market structure in a clean and professional dashboard. It automatically calculates the main pivot level, support and resistance zones, and scenario-based market bias for the current symbol. The indicator helps traders quickly identify: main pivot level bullish and bearish trigger areas support and resistance levels target projection levels current market scenario in a compact dashboard Main Features: D
ProfileScope MT5 Compare volume distributions across two areas you choose on the chart. ProfileScope MT5 combines a selected-area volume profile, numerical A/B comparison and alerts for confirmed interactions with profile levels. Choose the area that matters Choose Select A , drag across the chart and release to create A. Use Select B the same way to compare another period. Use Time range for the full price range of selected candles, or Time + price to keep only the estimated volume within a pri
AI Break and Retest Trader
Fadi Hassan Khaled Ghanem
Trades the classic break and retest: price closes through a key level, comes back to test it, and continues. How it works On each closed bar of the signal timeframe (H1 by default) the EA looks for a candle that closed above the high, or below the low, of the previous range (20 bars by default). It then waits for price to return to the broken level within a few bars. The retest candle must touch the level within an ATR based tolerance and close back on the breakout side. If price closes back ins
FREE
My Products: View My Products My Profile / Support / Contact: Visit My Profile My Channel: Follow My Channel MA Ultra Trend is a professional technical indicator for MetaTrader 5 designed to help traders identify market trend, momentum shifts, pullback opportunities and potential reversal points through a combination of a configurable Moving Average and a normalized oscillator. Instead of relying on a single traditional indicator, MA Ultra Trend combines trend direction + oscillator momentu
FREE
Pivot Point Hybrid MT5 Pivot Point Hybrid MT5 is an institutional-grade, multi-model pivot indicator engineered for precision chart analysis and automated trading. It calculates key support and resistance levels across standard or multi-year anchor periods, displaying clean visual lines on your chart while seamlessly communicating all pivot data to your Expert Advisors. Unlike standard indicators that only draw basic lines, this hybrid tool combines clear chart visualization with built-in data i
Utilities
Douglas Lucio De Araujo
Indicator with 3 features - Clock : Clock independent of the chart, counting continues even when the market is closed. - Template : After setting up a configuration in any graphic, be it color patterns, indicators, zoom ... The configuration will be copied to all active graphics. - TimeFrame : Set the TimeFrame on a chart, and with just one click all the active charts will be changed to the same TimeFrame.
这是一个基于前一个交易日的最高价、最低价和收盘价来计算的枢轴点指标,具体公式如下: 计算前一日的 Pivot Point (枢轴点): Pivot = (High + Low + Close) / 3 计算 Resistance 1 (R1) 、 Support 1 (S1) ​ 等: R1 = (2 * Pivot) - Low S1 = (2 * Pivot) - High R2 = Pivot + (High - Low) S2 = Pivot - (High - Low) 与市面上其他的枢轴点指标相比,该指标主要有以下4个特点: 1、可以修改交易日的开始时间; 2、可以设定支撑压力线的颜色; 3、可以设定是否显示各个支撑压力线对应的价格; 4、可以设定天数用以显示枢轴点的历史记录; 开发这个指标的最初目的是为了解决设定交易日开始时间的问题,接下来会进一步说明。基于计算公式,我们需要获得上一个交易日的最高价、最低价和收盘价,在夏令时,北京时间6点是开市时间,大多数交易平台服务器的0点对应的是北京时间的6点,但是香港的服务器6点才是对应的是北京时间的6点。如果你有多个平台,且存在
The Brilliant Reversals MultiCurrency Scanner MT5 is a state-of-the-art trading indicator designed for traders looking to identify potential reversal points across multiple currency pairs. By leveraging advanced algorithms, this tool provides instant insights, making it invaluable for both novice and experienced traders aiming to optimize their trading strategies. This indicator empowers traders by delivering real-time buy and sell signals based on market conditions, enhancing decision-making an
Rocket Two – Entry Point Indicator for MT5 Identify Market Direction. Track Dynamic Stops. Recognize Potential Entry Opportunities. Rocket Two is a technical analysis indicator for MetaTrader 5 designed to help traders identify potential trend changes and visualize market direction through dynamic stop levels and clear Buy/Sell signals. Built for traders who value a clean chart and straightforward technical analysis, Rocket Two combines volatility-based calculations with price action to help you
Why the RSI Alert Indicator is Essential for Your Trading Toolkit In the fast-paced world of trading, timely and accurate information is crucial. The RSI Alert Indicator is a powerful tool designed to help you stay ahead of the market by providing real-time alerts when the Relative Strength Index (RSI) reaches critical levels. Whether you're a novice trader or a seasoned professional, this indicator can significantly enhance your trading strategy by pinpointing potential market reversals with
The trend filter
Vincent Albert Feugier
Trend Filter By HYPOLITE MAKER (v3.00) Trend Filter is a visual indicator for MetaTrader 5 designed to clean up your charts and display the market's true trend. It eliminates market noise and visual traps to help you stay on the right side of the market, with significantly less lag than standard moving averages. Visuals & Key Features The Central Line: It changes color to give you the market direction at a glance. Green for an uptrend, Red for a downtrend, and Yellow when the market is hesitatin
รองรับโครงสร้างตลาดอัจฉริยะ AI PRO MT5 ไอดิเคเตอร์นี้รวม 3 ส่วนหลัก: โครงสร้างตลาด → HH / HL / LH / LL สัญญาณรูปแบบ → 2B / 123 / ตัดและทดสอบใหม่ AI Forecast (NN) → ทิศทาง + กรองสัญญาณ วิธีใช้งานจริง (เข้าใจง่าย) 1. ดูโครงสร้างตลาด (ตัวหลัก) HH + HL ต่อเนื่อง → เทรนขึ้น (หาจังหวะ ซื้อ) LH + LL ต่อเนื่อง → เทรนลง (หาจังหวะขาย) ใช้เป็น “ในหลัก” ก่อนที่จะดูสัญญาณ 2. ใช้รูปแบบการป้อนเข้า 2B ( กลับตัว) 2B บน → ขาย 2B ล่าง → ซื้อ ใช้ตอน “ตลาดเริ่มกลับ” แพทเทิร์น 123 เบรกจุด 2 → เข้าเ
Professional VWAP Trading System with Advanced Signal Detection Transform your trading with the most comprehensive VWAP indicator available for MetaTrader 5. Magic VWAP Key Levels Pro combines multiple timeframe analysis, intelligent signal detection, and professional-grade visualization to give you the edge in modern markets. CORE FEATURES: Multi-Timeframe VWAP Analysis Session, Weekly, and Monthly VWAP calculations Previous 10-day VWAP support/resistance Dynamic anchor periods (Session/Week/Mo
ARIPoint is a powerful trading tool designed to generate high-probability entry signals with dynamic TP/SL/DP levels based on price volatility. The integrated performance tracking function displays win/loss statistics, number of PP1/PP2 hits, and success rate, all updated in real time. Key Features: Buy/sell signals with adaptive volatility range Real-time TP/SL/DP levels based on ATR Integrated MA filter with ATR/StdDev volatility option. Performance statistics table (Success, Profit/Loss,
Veltrion Smart Fibonacci   is a clean automatic Fibonacci structure overlay for MetaTrader 5. It automatically detects recent swing highs and swing lows, then draws key Fibonacci retracement levels directly on the chart. The indicator is designed to help traders visualize market structure, retracement zones, and the golden zone without manually drawing Fibonacci tools. Key Features Automatic swing high and swing low detection Clean Fibonacci retracement overlay Horizontal Fibonacci levels for a
THE NUMBER CHANGES. THE MEANING DOESN’T. Change timeframes. Keep your reference. SAME PERIOD. DIFFERENT MEANING. Change the timeframe, and the MA you trusted is no longer measuring the same market horizon. The problem The same MA period measures a different amount of market time when the chart timeframe changes. The solution Equivalent MA changes the number — so your reference keeps the same meaning. H4 EMA 50 = H1 EMA 200 = M15 EMA 800 USER MANUAL Complete setup instructions, feature details,
Buyers of this product also purchase
Trend Sniper X
Sarvarbek Abduvoxobov
4.86 (44)
Trend Sniper X is a multi-timeframe trend-following indicator for MetaTrader 5 that helps traders identify trend direction and potential reversal points with clarity and precision. for MT4: https://www.mql5.com/en/market/product/193245 Price Information: The current price is promotional and is subject to change as upcoming updates and new features are released. Bonus Offer: To get the FREE Auto-Trade Assistant EA for this indicator, please message the author after purchasing. Code2Profit Channe
A new King in town - Indicator + Order management indications(tp1+tp2+tp3) + Optional Telegram Signal sender   INCLUDED (FREE) + Bonus EA Robot ( FULL TRADING  and SIGNAL SYSTEM ) Our best EA for Gold: Gold Slayer TRY > Reversion Queen  Expert advisor >JOIN Community Channel < NEW Free Automation EA link < click here ( disclaimer: this is new and still on testing and phase , use at your risk on demo) Free Telegram Bridge < click here  This indicator includes an advanced Strategy, a trading sys
Entry Points Pro shows you where to enter, where to put the stop and what lot to trade — before you place the order. PRICE Now 199 USD: 8 copies at this price, then 249 USD. The final price is 349 USD. I make my money trading the markets, and I show it, so I don't need to sell this indicator to everyone. It is a tool for traders who think for themselves, not a magic button. No breakout, no trade. A gray arrow is a cancelled signal: price did not break the signal candle, so there was no entry
Gann Made Easy   is a professional and easy to use Forex trading system which is based on the best principles of trading using the theory of W.D. Gann. The indicator provides accurate BUY and SELL signals including Stop Loss and Take Profit levels. You can trade even on the go using PUSH notifications. PLEASE CONTACT ME AFTER PURCHASE TO GET TRADING  INSTRUCTIONS   AND GREAT EXTRA INDICATORS  FOR FREE! Probably you already heard about the Gann trading methods before. Usually the Gann theory is a
Ultra Indicator
Ihor Otkydach
5 (1)
ULTRA is a technical indicator that operates on an “all-in-one” basis—it independently analyzes the market, generates trading signals, displays levels for setting stop-loss orders, and suggests when to close trades to lock in profits or minimize losses. In other words, it doesn't matter if you don't know how to analyze the market, determine levels—where to set your stop-loss—or struggle with money management. ULTRA will do all of that for you! BUYER BONUS: After purchasing the ULTRA indicator, s
SuperScalp Pro
Van Minh Nguyen
4.54 (37)
SuperScalp Pro - Professional Multi-Layer Confluence Scalping System SuperScalp Pro is an advanced scalping indicator that upgrades the classic Supertrend with multiple intelligent confirmation filters. It helps you identify higher-probability Buy/Sell opportunities while significantly reducing false signals. Clear Buy and Sell arrows appear directly on the chart, along with automatic ATR-based Stop Loss and Take Profit levels calculated in real time. After purchase, please message me on MQL5 to
Boba Analysis Suite
Trade Ready Solutions LLC
5 (2)
Boba Analysis Suite Boba Analysis Suite is an analytical indicator for MetaTrader 5. It brings market structure, relevant price zones and broader market context together in a single chart view. Developed through practical experience as a trader and trading coach, it supports a structured analysis process: assessing market direction, identifying important levels and considering multiple timeframes together. Analysis in Context Individual signals gain meaning through context. Boba Analysis Suite h
FX Power MT5 NG
Daniel Stein
5 (33)
FX Power: Analyze Currency Strength for Smarter Trading Decisions Overview FX Power is your go-to tool for understanding the real strength of currencies and Gold in any market condition. By identifying strong currencies to buy and weak ones to sell, FX Power simplifies trading decisions and uncovers high-probability opportunities. Whether you’re looking to follow trends or anticipate reversals using extreme delta values, this tool adapts seamlessly to your trading style. Don’t just trade—trade
FiboSniper Pro
Van Minh Nguyen
5 (4)
FiboSniper Pro - Multi-Filter Fibonacci System with Auto SL/TP and Control Panel FiboSniper Pro is a technical indicator that combines dynamic Fibonacci Envelopes with multiple confirmation filters to generate selective Buy and Sell signals. Fibonacci levels are calculated from Moving Average and ATR, then filtered by ADX, EMA, RSI, ATR, Volume, Time and Candle structure. The indicator displays automatic ATR-based Stop Loss and Take Profit levels directly on the chart, along with an interactive
M1 Sniper MT5
Oleg Rodin
5 (7)
M1 SNIPER  is an easy to use trading indicator system. It is an arrow indicator which is designed for M1 time frame. The indicator can be used as a standalone system for scalping on M1 time frame and it can be used as a part of your existing trading system. Though this trading system was designed specifically for short-term trading, it still can be helpful for all traders. This trading system can be used with any forex pair and time frame, though lower time frames are recommended from M1 up to M
Apex Patterns PRO Buy Indicator - Get Expert Advisor Based on it for FREE. Self-Optimizing Chart Pattern & Breakout Intelligence Traditional pattern scanners rely on fixed inputs, often underperforming when market volatility and structures shift. Apex Patterns PRO is designed to adapt to changing market conditions by combining structural chart pattern recognition, momentum filtering, and statistical self-optimization into one analytical framework. Adaptive Scanning Engine Self-Optimizing Patter
SQN Max indicator for MT5 by ITC
Renaud Herve Francois Candel
Sqn Max Indicator Sqn Max is an exclusive indicator to trade the market with high effectiveness. The indicator is based on price action, volatility and trend. This indicator is as simple as possible but not too simple. The indicator can generate alerts to ease the trading process. You don't have to stay all day in front of your screen. The indicator can be used with any class of assets and with any time frame. It is possible to achieve better results trading our list of selected assets. We achi
Adaptive Price Action Engine Buy Indicator- Get EA Based on it for FREE. Self-Optimizing Multi-Timeframe Trend & Candlestick Intelligence Markets do not behave the same way all the time—and not every price-action pattern has the same value in every market regime. Adaptive Price Action Engine is designed to adapt to changing market conditions by combining trend structure, multi-timeframe analysis, candlestick patterns, and statistical optimization into one analytical framework. Two Adaptive Mode
Welcome to Entry In The Zone & SMC Multi Timeframe —  COMPLETE SMC ANALYSIS SYSTEM — ALL IN ONE INDICATOR Entry In The Zone & SMC Multi Timeframe  An indicator designed for market analysis based on Smart Money Concepts (SMC), displaying Market Structure, Key Zones (Order Blocks, Supply & Demand Zones, and Fair Value Gaps), Liquidity, and real-time BUY / SELL signals. It supports both Single-Timeframe and Multi-Timeframe analysis, along with the Confluence at Zone feature, which helps you evaluat
Divergence Bomber
Ihor Otkydach
4.89 (94)
Each buyer of this indicator also receives the following for free: The custom utility "Bomber Utility", which automatically manages every trade, sets Stop Loss and Take Profit levels, and closes trades according to the rules of this strategy Set files for configuring the indicator for various assets Set files for configuring Bomber Utility in the following modes: "Minimum Risk", "Balanced Risk", and "Wait-and-See Strategy" A step-by-step video manual to help you quickly install, configure, and
Power Candles MT5
Daniel Stein
4.58 (12)
Power Candles - Self-Optimizing Strength Indicator Strength usually lives in a sub-window. The line runs below, the candle above, and your eye keeps connecting the two. Power Candles puts the strength into the candle itself, colored from dark red to dark green, so the chart reads at a glance and the sub-window stays closed. The indicator also finds its own settings for the symbol and timeframe in front of you. One click on [ Apply Best ] draws entry, Stop Loss and Take Profit at the exact prices
Currency Strength Wizard   is a very powerful indicator that provides you with all-in-one solution for successful trading. The indicator calculates the power of this or that forex pair using the data of all currencies on multiple time frames. This data is represented in a form of easy to use currency index and currency power lines which you can use to see the power of this or that currency. All you need is attach the indicator to the chart you want to trade and the indicator will show you real s
Crystal Heikin Ashi Signals
Muhammad Jawad Shabir
5 (5)
Crystal Heikin Ashi Signals—Professional Trend & Signal Detection Indicator Advanced Heikin Ashi Visualization with Intelligent Signal System for Manual & Automated Trading Final Price: $149 ---------> Price goes up $10 after every 10 sales . Limited slots available — act fast . Overview User Guide PDF Crystal Heikin Ashi Signals is a professional-grade MetaTrader 5 indicator that combines pure Heikin Ashi candle visualization with an advanced momentum-shift detection system. Designed for both m
Auto Optimized SpeedAngle is an institutional-grade momentum vectoring system that eliminates curve-fitting through continuous Walk-Forward Optimization (WFO). Rather than relying on static inputs that degrade when market regimes shift, the indicator dynamically recalibrates its parameters using Out-of-Sample (OOS) validation, ensuring the displayed signals represent genuine statistical edges rather than historical anomalies. By shifting the focus from subjective visual angles to normalized, qua
Multi Currency Strength and Momentum Indicator MT5 Dynamic Forex28 Navigator is the evolution of our long-time, popular indicators, combining the power of five in one: Advanced Currency Strength28 Indicator (700 reviews) Advanced Currency IMPULSE with ALERT (530 reviews) Currency Strength EXOTICS GOLD Impulse with Alert CS28 Combo Signals (recent Bonus) No need to buy four indicators and stack them on your charts. All of it is merged into one powerful indicator: the strength of the 28 Forex pair
Azimuth Pro
Ottaviano De Cicco
5 (7)
Azimuth Pro V2: Synthetic Fractal Structure and Confirmed Entries for MT5 Overview Azimuth Pro is a multi-level swing structure indicator by Merkava Labs . Four nested swing layers, swing-anchored VWAP, ABC pattern detection, three-timeframe structural filtering, and closed-bar confirmed entries — one chart, one workflow from micro-swings to macro-cycles. This is not a blind signal product. It is a structure-first workflow for traders who care about location, context, and timing. 1. What Change
DayTrader PRO
Davit Beridze
5 (4)
DayTrader PRO (Buy DayTrader PRO and get Another Paid Self Optimizing indicator for FREE as BONUS!) DayTrader PRO is an advanced trading indicator that combines John Ehlers' Laguerre Filter with a powerful Auto-Optimization Engine. Instead of using fixed parameters, the indicator automatically searches for the best settings based on recent market conditions, helping you adapt to changing volatility without constant manual adjustments. The indicator generates clear BUY and SELL signals together
ARICoins
Temirlan Kdyrkhan
ARICoin is a powerful trading companion designed to generate high-probability entry signals with dynamic TP/SL/DP levels based on volatility. Built-in performance tracking shows win/loss stats, PP1/PP2 hits, and success rates all updated live. Key Features: Buy/Sell signals with adaptive volatility bands Real-time TP/SL/DP levels based on ATR Built-in MA Filter with optional ATR/StdDev volatility Performance stats panel (Success, Profit/Loss, PP1/PP2) Alerts via popup, sound, push, or email Cust
FX Trend MT5 NG
Daniel Stein
5 (6)
FX Trend NG: The Next Generation Multi-Market Trend Intelligence Overview FX Trend NG is a professional multi-timeframe trend and market monitoring tool designed to give you a complete structural overview of the market in seconds. Instead of switching between dozens of charts, you instantly see which symbols are trending, where momentum is fading, and where strong alignment exists across timeframes. This tool is part of the Stein Investments ecosystem: setup guides, videos, workshops and Max,
PZ Swing Trading MT5
PZ TRADING SLU
5 (5)
Protect against whipsaws: revolutionize your swing trading approach Swing Trading is the first indicator designed to detect swings in the direction of the trend and possible reversal swings. It uses the baseline swing trading approach, widely described in trading literature. The indicator studies several price and time vectors to track the aggregate trend direction and detects situations in which the market is oversold or overbought and ready to correct. [ Installation Guide | Update Guide | Tro
FX Volume MT5
Daniel Stein
4.79 (24)
FX Volume: Experience Genuine Market Sentiment from a Broker’s Perspective Quick Overview Looking to elevate your trading approach? FX Volume provides real-time insights into how retail traders and brokers are positioned—long before delayed reports like the COT. Whether you’re aiming for consistent gains or simply want a deeper edge in the markets, FX Volume helps you spot major imbalances, confirm breakouts, and refine your risk management. Get started now and see how genuine volume data can
Profit from market structure changes as price reverses and pulls back. The Market Reversal Alerts indicator identifies when a trend or extended price move is approaching exhaustion, alerts you the moment market structure shifts, and confirms the entry when price re-tests the reversal zone, so you trade defined areas instead of guesses. How it works As price forms new highs or lows near potential exhaustion points, the indicator identifies the breakout and momentum, then draws a rectangle on the
Neuro Poseidon MT5
Daria Rezueva
4.68 (53)
Neuro Poseidon is a new indicator by Daria Rezueva. It combines precise trading signals with adaptive TP/SL levels - creating best possible trades as a result! Message me and get  Neuro Poseidon Assistant  as a gift to automize your trading process! What makes it stand out? 1. Proven profitability on all assets and timeframes 2. Only confirmed BUY and SELL signals present on the chart 3. Adaptive TP & SL levels generated by the software for each trade 4. Easy to understand - suitable for al
SIO Oscillator: Self-Optimizing Semivariance Imbalance Oscillator Buy the indicator and get the Expert Advisor based on it for FREE. Most oscillators treat all price movement the same. SIO separates upside and downside market pressure and measures the imbalance between them, showing which side is really in control: buyers or sellers. When the imbalance reaches an extreme, SIO prints a clear signal with entry, Stop Loss and Take Profit levels. What makes SIO different is that it doesn’t rely on f
HyperPOWER
Alfred Charano
HyperPOWER — See the Power. Ride the Trend. Stop guessing direction. See which currency is driving the move, ride the trend and get clean BUY/SELL arrows — all in one beautiful indicator. Description Too many indicators. Too many signals. Still no idea where to enter? HyperPOWER replaces the clutter with one clear answer: who is strong, who is weak, and when the trend agrees. See the power behind every move A live strength score for 9 assets: XAU, EUR, GBP, AUD, NZD, USD, CAD, CHF and JPY. You
More from author
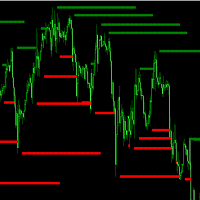
Previous High and Previous Low in the charts usually forms an area of interest for trading on the chart. Price usually move quickly then stall around these areas. This indicator identify Bars which are highest or lowest of the surrounding bars and extend a line out to visualize it. Extend line for how many bars: Define how many bars to extend the bars to the right of the extreme bar. Width of Extreme: Define how many bars it should be the highest/lowest to the left and right of the bar Keep line
inp_timeframe: Set Timeframe of indicator MA Parameters: (Same as standard moving average indicator) inp_MA_period, inp_MA_shift, inp_MA_method, inp_MA_price: Moving Average Period, Moving Average Shift, Moving Average Method, Moving Average Price Please take note that using a MA_shift of 0 will result in a different result when the indicator is reloaded for higher time frame This indicator only accepts shift>0 This is due to the indicator showing the current time moving average and atr at the c
place a vwap line starting from the line placed on the chart parameters: tick_mode: enable to use ticks instead of bars. this uses a lot more cpu processing power prefix: prefix to add for line created by indicator line_color: set the color of the line created line_style: set the line style of the line created applied_price: set the price of bar to use of the bar std_dev_ratio: set the multiplier for the std dev channel
Filter:
No reviews
Reply to review