• Overview
  • Reviews (5)
  • Comments (3)
  • What's new

FT ROC Histogram

3.75

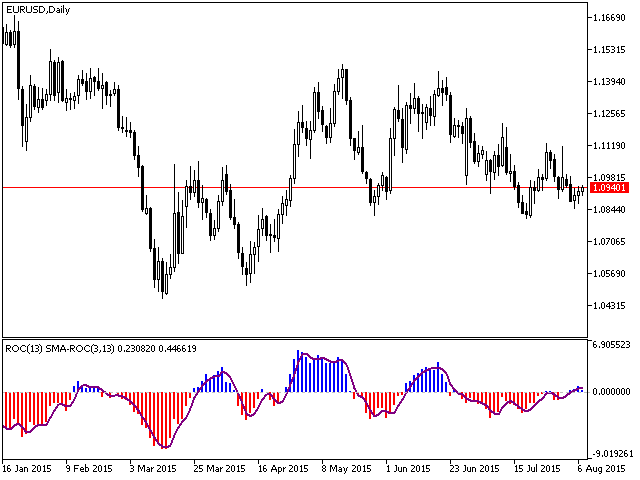
The indicator displays the value of ROC (Rate of change) from the selected price or moving average as a histogram. You can plot the moving average ROC values for smoothing indicator.


Displayed Data

  • ExtROC - rate of change
  • ExtMAROC - smoothing line
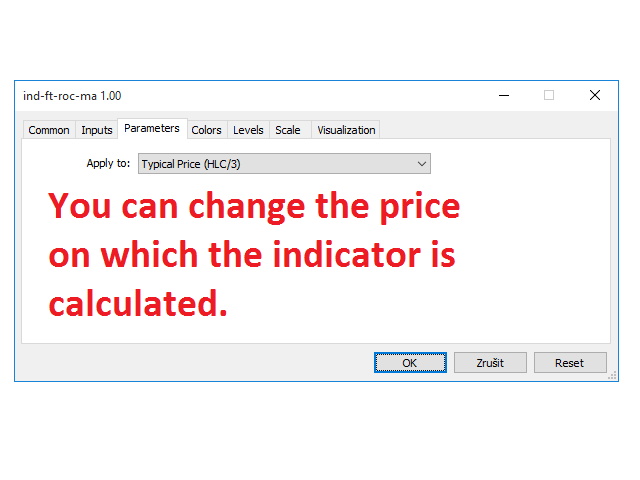

Parameters

You can change the price, on which the indicator is calculated.
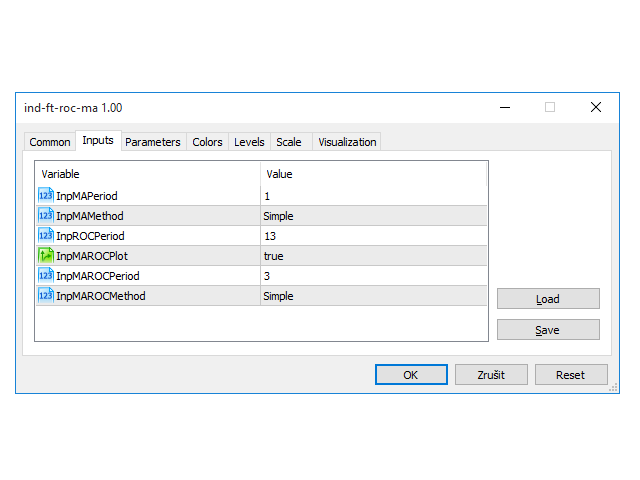

Inputs

  • InpMAPeriod - in case you want to calculate the moving average ROC, enter averaging period. Enter 1 for the calculation of the specified prices.
  • InpMAMethod - smoothing type (SMA, EMA, LWMA, SMMA).
  • InpROCPeriod - rate of change period.
  • InpMAROCPlot - show smoothing line (true/false).
  • InpMAROCPeriod - averaging period.
  • InpMAROCMethod - smoothing type (SMA, EMA, LWMA, SMMA).
Recommended products
ToolBot Probabilistic Analysis
Josue De Matos Silva
4.33 (3)
ToolBot   Probabilistic Analysis -  FREE   An effective indicator for your negotiations The toolbot indicator brings the calculation of candles and a probabilistic analysis so that you have more security on your own. Also test our   FREE   tops and bottoms indicator: :    https://www.mql5.com/pt/market/product/52385#description Also test our   FREE   (RSI, ATR, ADX, OBV)  indicator :    https://www.mql5.com/pt/market/product/53448#description Try our EA ToolBot for free:   https://www.mql
FREE
This is addition of  Effective SV squeeze momentum  that add bolliger band and Keltner channel to chart window.  Squeeze momentum introduced by “John Carter”, the squeeze indicator for MT5 represents a volatility-based tool. Regardless, we can also consider the squeeze indicator as a momentum indicator, as many traders use it to identify the direction and strength of price moves. In fact, the Tradingview  squeeze indicator shows when a financial instrument is willing to change from a trending ma
FREE
TSO Moving Average Slope MT5
Dionisis Nikolopoulos
4.4 (5)
The Moving Average Slope (MAS) subtracts the moving average level n-periods ago from the current moving average level. This way, the trend of the moving average can be drawn on the moving average line. Features Observe uptrends and downtrends at a glance. The indicator is non-repainting. Returns buffer values for the trend of the moving average to be used as part of an EA. (see below) Inputs Moving Average Period : The period of the moving average (MA). Slope Period : Number of periods betwe
FREE
The Moving Average Convergence Divergence (MACD) trading strategy is a popular technical analysis tool that is used to identify changes in momentum and trend direction. The MACD is calculated by subtracting the 26-period exponential moving average (EMA) from the 12-period EMA. A 9-period EMA, called the "signal line," is then plotted on top of the MACD to act as a trigger for buy and sell signals. The MACD is considered to be in bullish territory when the MACD line is above the signal line an
FREE
This is an ordinary MACD indicator displayed in the main window according to the selected chart style, i.e. Bars, Candlesticks or Line. When you switch the chart type, the indicator display also changes. Unfortunately I could not improve the chart type switching speed. After switching, there are delays before the arrival of a new tick. The indicator parameters Fast EMA period Slow EMA period Signal SMA period Applied price
FREE
PFKBreakOut
Stanislav Korotky
This indicator displays breakouts on Point-And-Figure-like or Kagi-like custom symbol charts, generated by special expert advisers, such as PointFigureKagiCharts . This indicator is applicable only for custom instruments generated in appropriate way (with time-invariant bars which are multiples of a predefined box size). It makes no sense to apply it to other charts. The breakouts in up or down direction are marked by arrows. The breakout price is found at crossing of one of imaginary lines of
FREE
Tunnel Warrens MT5
Dariel Iserne Carrera
4 (1)
This is MT5 version Get Tunnel Warrens MT4 here Here are several indicators that work together. It basically works with moving averages and various levels of ATR creating a dynamic channel through which the price is drained. As I always recommend, you should try it before using it in live so that you understand how it works. The market entry signal is similar to other MA indicators, but with this one you also have a graphical analysis of the moment when the trend is found and dynamic levels to
FREE
PZ Oscillator MT5
PZ TRADING SLU
4 (7)
This is a smooth and responsive accelerometer which reveals the market trend and strength. [ Installation Guide | Update Guide | Troubleshooting | FAQ | All Products ] Two moving averages indicate trend direction The histogram represents strength of the price movement It draws buy and sell zones as colored vertical lines Should be used as a confirmation indicator Customizable line widths and colors It implements alerts of all kinds This indicator is similar to MACD but aims to react faster t
FREE
Follow The Line MT5
Oliver Gideon Amofa Appiah
4.36 (28)
This indicator obeys the popular maxim that: "THE TREND IS YOUR FRIEND" It paints a GREEN line for BUY and also paints a RED line for SELL. (you can change the colors). It gives alarms and alerts of all kinds. IT DOES NOT REPAINT and can be used for all currency pairs and timeframes. Yes, as easy and simple as that. Even a newbie can use it to make great and reliable trades. NB: For best results, get my other premium indicators for more powerful and reliable signals. Get them here: https://www.m
FREE
The indicator identifies when a divergence occurs between price and an indicator or oscillator. It identifies both regular and hidden divergences. Combined with your own rules and techniques, this indicator will allow you to create (or enhance) your own powerful system. Features Can detect divergences for the following oscillators/indicators:   MACD, OsMA, Stochastics, RSI, CCI, RVI, Awesome, ADX, ATR, OBV, Composite index, MFI and Momentum. Only one oscillator/indicator can be selected. Draws
FREE
。。。。。。。。。。。。。。。。。。。。。。。。。。。。。。。。。。。。。。。。。。。 This indicator is based on Bollinger Bands indicator. It helps user clearly know the Band is expand or contract. The method of use is the same as the traditional Brin channel index. Users can use different color areas to distribute forest channel indicators in expansion or contraction stage. -------------------------------------------------------------------------------------------
FREE
MWC COX 5
Joerg Hamann
3.75 (4)
The MWC COX indicator shows the extreme zones of net short/long positions of the Commitments of Traders Report released by the CFTC once a week for four periods of time. Default settings are periods of 12, 26, 52 and 156 weeks. Additional Features Displays the sum of all 4 periods in one line MA, MOM and RSI indicators are integrated ( not in the MQL5 Version 1.0 ) Please make sure that you download the MWC_Demo.zip file and unpack it into   [...]/MQL5/Files   folder.  ->  www.myweeklycot.com/
FREE
Indicator and Expert Adviser  EA Available in the comments section of this product. Download with Indicator must have indicator installed for EA to work. Mt5 indicator alerts for bollinger band and envelope extremes occurring at the same time. Buy signal alerts occur when A bullish candle has formed below both the lower bollinger band and the lower envelope  Bar must open and close below both these indicators. Sell signal occur when A bear bar is formed above the upper bollinger band and upp
FREE
TrailingStop MA
Andrej Nikitin
3.8 (5)
The indicator draws two simple moving averages using High and Low prices. The MA_High line is displayed when the moving average is directed downwards. It can be used for setting a stop order for a sell position. The MA_Low line is displayed when the moving average is directed upwards. It can be used for setting a stop order for a buy position. The indicator is used in the TrailingStop Expert Advisor. Parameters Period - period of calculation of the moving average. Deviation - rate of convergence
FREE
Spire
Sergey Ponomarev
Spire - показывает трендовый, сигнальный, свечной прорыв в сторону верхней или нижней границы канала, а так же временную или долгую консолидацию в виде прямоугольного канала. Сигналы тренда не перерисовываются. В основу идеи индикатора входит  Bollinger  Bands.  Изменяемые параметры Signal trend -изменение цветовой гаммы сигнального символа тренда Lower limit - изменение цветовой гаммы нижней границы канала Upper limit - изменение цветовой гаммы верхней границы канала Internal field -изменение
FREE
MWC Ratio 5
Joerg Hamann
3.5 (6)
The Commitments of Traders Ratio Indicator is one of these things you never thought about it before you really see the magic behind it. The indicator shows the Ratio of long/short positions released by the CFTC once a week. If you have a look on the Sreenshot you can see two (three) zones of interest. Important note: MAs are not available in version 1.0. Zone 1: The Switches (Red -> Green, Green -> Red) Zone 2: MA cross Zone 3: If you combine this with the COX indicator an additional zone will
FREE
Donchian Channel DC is the indicator of Donchian Channels, that plots maximum and minimum values of a specific period, besides mean value line. It´s possible to configure simple period for analysis and the indicator will plot all three values. You can trade with this indicator as trend or reversal, according to each strategy. Do not let to test others indicators as soon as others expert advisors.
30 USD
Original MACD
Kirill Paskhin
5 (3)
Moving Average Convergence/Divergence — схождение/расхождение скользящих средних — технический индикатор, разработанный Джеральдом Аппелем (Gerald Appel), используемый в техническом анализе для проверки силы и направления тренда, а также определения разворотных точек. Встроенный в MetaTrader 5 индикатор MACD не соответствует задумке автора (Gerald Appel): -линия MACD графически изображена в виде гистограммы, однако гистограммой отражается разница между линией MACD и сигнальной линией;  -сигнал
FREE
RSI with alerts BDA
Laron Demetris Burrows
4.75 (8)
This free algorithm predicts short term changes in price with a 86%* accuracy. When there is a large move as determined by the ATR, during an overbought or oversold condition, the indicator will alert you. Predicts if price will be higher or lower than the signal candle. Perfect for mean reversion trading, binary options or futures contracts on larger time frames. The indicator was backtested on 5 years of data and has a 90% accuracy for predicting price reversals over time. Features: Simple set
FREE
VolumenTrend
Anastasiya Schneider
Volume Trend Indicator: The "Volume Trend" indicator is a powerful tool designed to assist traders in identifying optimal entry points for trades. By monitoring changes in volumes on every tick, this indicator provides valuable insights into market dynamics. When combined with other technical indicators such as moving averages or RSI, the "Volume Trend" indicator can yield exceptional results, especially when used on the 30-minute timeframe. Key Features: Real-time Volume Analysis: The "Volume
FREE
Curver Arrows
Francis Dube
4 (9)
This indicator is a straight port of a well known MetaTrader 4 indicator that is freely available on the Internet. It does not redraw at all. It implements a type of breakout strategy. The arrows indicate market direction. Use the indicator on M15 charts and higher. The indicator draws two bands near price action and generates signals when the price closes below the lower band and also above the upper band. The indicator uses periodic highs and lows to calculate upper and lower threshold bands.
FREE
This indicator is based on the Heiken Ashi indicator. It helps the user identifying whether to buy or sell. It comes with an alert that will sound whenever a new signal appears. It also features an email facility. Your email address and SMTP Server settings should be specified in the settings window of the "Mailbox" tab in your MetaTrader 5. Blue arrow up = Buy. Red arrow down = Sell. Line = Trailing Stop. You can use one of my Trailing Stop products that automatically move the Stop Loss and inc
FREE
TBScanner
NUANCHAN SANTHONG
4.17 (6)
Timeframe-correlation signal generating with  Higher than 95% of accuracy This scanner shows the trend values of the  TrendBand  indicator for up to 20 instruments and H4,H1,M15,M5 and M1 time frames.  The scanner collects the trend signals of every timeframes (H4,H1,M15,M5,M1) from  TrendBand   indicator and also, generates daily signal under the considerations of like correlations of each timeframes,ATM rule and Fibonacci levels. Installation Note Before opening this indicator, the  TrendBan
FREE
SSA Stochastic Limited Edition
Roman Korotchenko
4.25 (4)
An analogue of the Stochastic oscillator based on algorithms of singular spectrum analysis (SSA) SSA is an effective method to handle non-stationary time series with unknown internal structure. It is used for determining the main components (trend, seasonal and wave fluctuations), smoothing and noise reduction. The method allows finding previously unknown series periods and make forecasts on the basis of the detected periodic patterns. Indicator signals are identical to signals of the original i
FREE
Heikin Ashi Delta
Flavio Javier Jarabeck
4.88 (8)
For those who love to trade using the Heikin Ashi Candlesticks, here it is a powerful ally: Heikin Ashi Delta . This indicator was presented by Dan Valcu in his book about Heikin Ashi candlesticks called " Heikin Ashi - How To Trade Without Candlestick Patterns " - and by the way this is a very cool book, we totally recommend it. Even for those of you who don't trade using Heikin Ashi candlesticks could use this Leading Indicator anyway. It is more "nervous" than let's say a Stochastic, but coul
FREE
LT Donchian Channel
Thiago Duarte
5 (1)
Donchian Channel is an indicator created by Richard Donchian. It is formed by taking the highest high and the lowest low of the last specified period in candles. The area between high and low is the channel for the chosen period. Its configuration is simple. It is possible to have the average between the upper and lower lines, plus you have alerts when price hits one side. If you have any questions or find any bugs, please contact me. Enjoy! This is a free indicator, but it took hours to develo
FREE
This indicator is an automated version of the Fibonacci retracement (Fib) indicator. Deciding the best areas to use when drawing the fib can be tricky and this  indicator was made with that in mind. When you drop it on the chart it will automatically choose the best points to draw the fib with, but in case you aren't satisfied with those regions, you can adjust it as you wish.
FREE
Sniper MACD
Yaroslav Varankin
3.9 (10)
Sniper MACD indicator which has been improved by several methods. it has an additional filter it is smoothed several times in order to get maximum informacion a volume indicator is also added to it in order to more accurately display information about the market and the current price condition indicator on timeframes from m1 to m30 as it is configured for short-term timeframes I advise you to trade on highly volatile currency pairs, for example, such as eur.usd - eur.jpy Thank you for your atten
FREE
Color
Sergey Ponomarev
Индикатор Color служит помощником для начинающего или опытного трейдера для выявления краткосрочного тренда или глобального в зависимости выбранного тайм фрейма, а так же для выявления флетовой зоны, которая очень хорошо видна в местах длинной проторговки в одной зоне индикатора Color. Индикатор не перерисовывается на завершённой свечи , но в моменте появления свечи и образования сигнала, может быть отклонён в прорисовке. Особенности работы индикатора Хорошо определяет тренд на волатильных инстр
FREE
This indicator is based on the Bollinger Bands indicator. It helps the user identifying whether to buy or sell. It comes with an alert that will sound whenever a new signal appears. It also features an email facility. Your email address and SMTP Server settings should be specified in the settings window of the "Mailbox" tab in your MetaTrader 5. Blue arrow up = Buy. Red arrow down = Sell. Line = Trailing Stop. You can use one of my Trailing Stop products that automatically move the Stop Loss and
FREE
Buyers of this product also purchase
How many times have you bought a trading indicator with great back-tests, live account performance proof with fantastic numbers and stats all over the place but after using it, you end up blowing your account? You shouldn't trust a signal by itself, you need to know why it appeared in the first place, and that's what RelicusRoad Pro does best! NOW $50 (MT5 RELEASE DISCOUNT $699) -  UNLIMITED ACCOUNTS (10 PCs or MACs LICENSE) **  User Manual + Strategies + Training Videos + Private Group with V
50 USD
Gold Stuff mt5
Vasiliy Strukov
4.97 (124)
Gold Stuff mt5 is a trend indicator designed specifically for gold and can also be used on any financial instrument. The indicator does not redraw and does not lag. Recommended time frame H1. Contact me immediately after the purchase to get   personal bonus! Settings  and manual   here   SETTINGS Draw Arrow - on off. drawing arrows on the chart. Alerts -   on off audible alerts. E-mail notification - on off. email notifications. Puch-notification - on off. Push notifications. Next, adjust the co
30 USD
Owl Smart Levels MT5
Sergey Ermolov
4.39 (31)
MT4 version  |  How to install?   |   FAQ The Owl Smart Levels Indicator is a complete trading system within the one indicator that includes such popular market analysis tools as Bill Williams' advanced fractals , Valable ZigZag which builds the correct wave structure of the market, and Fibonacci levels which mark the exact levels of entry into the market and places to take profits. Detailed description of the strategy Instructions for working with the indicator Advisor-assistant in trading Owl
97 USD
Top indicator for MT5   providing accurate signals to enter a trade without repainting! It can be applied to any financial assets: forex, cryptocurrencies, metals, stocks, indices .  MT4 version is here It will provide pretty accurate trading signals and tell you when it's best to open a trade and close it. Watch  the video  (6:22) with an example of processing only one signal that paid off the indicator! Most traders improve their trading results during the first trading week with the help of
125 USD
Price action trading, Trend trading strategies, Trend following indicators, Trend detection, Range identification, Smart Trend Trading System Indicator, Comprehensive trading system, Multi-indicator approach, Trend following strategy, Range reversal strategy, Smart Trend Cloud, Smart Reversal Zones, Trend Breakout Catcher, Smart Trailing Stop, Multi-timeframe trend finder, Complete trading toolkit, Market trend analysis, Range-bound market signals, Confident trading decisions, Price movement in
100 USD
Trend Screener Pro MT5
STE S.S.COMPANY
4.88 (49)
Unlock the Power of Trends with Trend Screener Indicator: Your Ultimate Trend Trading Solution! Are you ready to take your trend trading to the next level? Introducing Trend Screener, the breakthrough trend indicator that combines all the essential features you need into a single, powerful Indicator. With 100% non-repainting accuracy, multi-timeframe capabilities, and compatibility across various instruments, Trend Screener Indicator is your key to improve your trading in the world of forex, com
50 USD
AW Trend Predictor MT5
Alexander Nechaev
4.8 (45)
The combination of trend and breakdown levels in one system. An advanced indicator algorithm filters market noise, determines the trend, entry points, as well as possible exit levels. Indicator signals are recorded in a statistical module, which allows you to select the most suitable tools, showing the effectiveness of the signal history. The indicator calculates Take Profit and Stop Loss marks. Manual and instruction ->  HERE  / MT4 version ->  HERE How to trade with the indicator:  Trading wit
55 USD
ICT, SMC, SMART MONEY CONCEPTS, SMART MONEY, Smart Money Concept, Support and Resistance, Trend Analysis, Price Action, Market Structure, Order Blocks, BOS/CHoCH,   Breaker Blocks ,  Momentum Shift,   Supply&Demand Zone/Order Blocks , Strong Imbalance,   HH/LL/HL/LH,    Fair Value Gap, FVG,  Premium  &   Discount   Zones, Fibonacci Retracement, OTE, Buy Side Liquidity, Sell Side Liquidity, BSL/SSL Taken, Equal Highs & Lows, MTF Dashboard, Multiple Time Frame, BigBar, HTF OB, HTF Market Structur
65 USD
Matrix Arrow Indicator MT5
Juvenille Emperor Limited
5 (13)
Matrix Arrow Indicator MT5  is a unique 10 in 1 trend following   100% non-repainting  multi-timeframe indicator that can be used on all symbols/instruments:   forex,   commodities,   cryptocurrencies,   indices,   stocks .  Matrix Arrow Indicator MT5  will determine the current trend at its early stages, gathering information and data from up to 10 standard indicators, which are: Average Directional Movement Index (ADX) Commodity Channel Index (CCI) Classic Heiken Ashi candles Moving Aver
75 USD
Profit from market structure changes as price reverses and pulls back. The market structure reversal alert indicator identifies when a trend or price move is approaching exhaustion and ready to reverse. It alerts you to changes in market structure which typically occur when a reversal or major pullback are about to happen. The indicator identifies breakouts and price momentum initially, every time a new high or low is formed near a possible exhaustion point. The indicator draws in a rectangle on
49 USD
Blahtech Supply Demand MT5
Blahtech Limited
4.54 (13)
Was: $299    Now: $149   Supply Demand uses previous price action to identify potential imbalances between buyers and sellers. The key is to identify the better odds zones, not just the untouched ones. Blahtech Supply Demand indicator delivers functionality previously unavailable on any trading platform. This 4-in-1 indicator not only highlights the higher probability zones using a multi-criteria strength engine, but also combines it with multi-timeframe trend analysis, previously confirmed swi
149 USD
ICT Silver Bullet MT5
Haidar, Lionel Haj Ali
5 (14)
ICT Silver Bullet If you are searching for a reliable indicator to trade the ICT Silver Bullet concept, or ICT concepts, Smart Money Concepts, or SMC, this indicator will respond to your need!  Before version 2.2, this indicator was focused only on ICT Silver Bullet, but moving forward, we will include the different elements for smart money concept trading. This indicator will help you identify the following: FVG - fair value gaps Market structure: BOS and CHOCH. It is based on ZIGZAG as it is
39 USD
ICT, SMC, Smart Money Concept, Support and Resistance, Trend Analysis, Price Action, Market Structure, Order Blocks,   Breaker Blocks ,  Momentum Shift, Strong Imbalance,   HH/LL/HL/LH,    Fair Value Gap, FVG,  Premium  &   Discount   Zones, Fibonacci Retracement, OTE, Buyside Liquidity, Sellside Liquidity,  Liquidity Voids, Market Sessions ,Market Time,   , NDOG, NWOG,Silver Bullet,ict template  In the financial market, accurate market analysis is crucial for investors. To help investors better
39 USD
FX Volume MT5
Daniel Stein
4.8 (15)
Get your daily market update with details and screenshots via our Morning Briefing  here on mql5  and  on Telegram ! FX Volume is the FIRST and ONLY volume indicator that provides a REAL insight into the market sentiment from a broker's point of view. It provides awesome insights into how institutional market participants, like brokers, are positioned in the Forex market, much faster than COT reports. Seeing this information directly on your chart is the real game-changer and breakthrough solu
99 USD
Welcome to Propsense, the best solution for new and veteran traders with a simple   FREE   strategy! NEW to MT5! This indicator is a unique and affordable trading tool built on the teachings of a former bank trader. With this tool, you will be able to see inefficient points with ease. Additionally, traders will have a clean Heads Up Display which will show your running and closed P/L in pips AND currency units. As a highly requested option, a candle timer has been added which will allow you to j
50 USD
Introducing the Quantum Heiken Ashi PRO charts with integrated alerts Designed to provide clear insights into market trends, the Heiken Ashi candles are renowned for their ability to filter out noise and eliminate false signals. Say goodbye to confusing price fluctuations and hello to a smoother, more reliable chart representation. What makes the Quantum Heiken Ashi PRO truly unique is its innovative formula, which transforms traditional candlestick data into easy-to-read colored bars. Red and g
99.99 USD
Auto Order Block with break of structure Detect Break of Structure , Mark Order Block and draw Entry / Stop and Risk to Reward lines when Order block is touch by price with Alert. Trend is Manually set to filter signals in a direction by a button on the chart. Entry / Stop and Risk to Reward lines can also be switch on / off by button on chart. Futures Auto Mark Break of Structure Auto Mark Order block Auto Mark higher time frame Point Of  Interest ( POI ) Popup Alert when BoS , Order block
65 USD
Market Structure Patterns
Samuel Manoel De Souza
4.93 (14)
Market Structure Patterns is an indicator based on smart money concepts that displays structures and zones on the chart, can send alerts of any type, have his values accessed through global variables what makes easy create Expert Advisors based on it. This is the only one of this type in the market that allows the control of the transparency of the zones on the chart. The indicator also paints the   candlesticks   depending on the trend. This feature can be enabled in the parameter "Color Candle
30 USD
FX Power MT5 NG
Daniel Stein
5 (1)
Trading GOLD, and currencies, with the dog walk strategy Get your daily market update with details and screenshots via our Morning Briefing  here on mql5  and  on Telegram ! FX Power MT5 NG  is the next generation of our long-time very popular currency strength meter, FX Power.  And what does this next-generation strength meter offer? Everything you have loved about the original FX Power  PLUS GOLD/XAU strength analysis Even more precise calculation results Individually configurable analysis pe
99 USD
Quantum Trend Sniper
Bogdan Ion Puscasu
5 (7)
Introducing   Quantum Trend Sniper Indicator , the groundbreaking MQL5 Indicator that's transforming the way you identify and trade trend reversals! Developed by a team of experienced traders with trading experience of over 13 years,   Quantum Trend Sniper Indicator   is designed to propel your trading journey to new heights with its innovative way of identifying trend reversals with extremely high accuracy. ***Buy Quantum Trend Sniper Indicator and you could get Quantum Breakout Indicator fo
99.99 USD
Strong Support mt5
Vasiliy Strukov
5 (9)
Support and resistance levels have long been a powerful tool for market analysis. The Strong Support indicator plots support levels based on local price minima, and resistance levels based on local price maxima. My other developments can be viewed   here It is recommended to use together with a trend indicator, for example, Gold Stuff - this will allow you to trade according to the trend and simultaneously determine the zones of consolidation or trend reversal, as well as set stop loss and
30 USD
Black Dragon indicator mt5
Ramil Minniakhmetov
4.79 (48)
The trend detection indicator will compliment any strategy and can also be used as an independent tool. IMPORTANT! Contact me immediately after the purchase to get instructions and a bonus!  Benefits  Easy to use; does not overload the graphic wih unnecessary information. The ability to use as filter for any strategy. Contains bult -in dynamic levels of cupport and resistange,  which can be used both, for profit taking, and for settings up stop-losses. The indicator does not change color after t
30 USD
Introducing   Quantum Breakout PRO , the groundbreaking MQL5 Indicator that's transforming the way you trade Breakout Zones! Developed by a team of experienced traders with trading experience of over 13 years,   Quantum Breakout PRO   is designed to propel your trading journey to new heights with its innovative and dynamic breakout zone strategy. Quantum Breakout Indicator will give you signal arrows on breakout zones with 5 profit target zones and stop loss suggestion based on the breako
99.99 USD
The ADR Reversal Indicator shows you at a glance where price is currently trading in relation to it's normal average daily range. You will get instant alerts via pop-up, email or push when price exceeds it's average range and levels above it of your choosing so you can jump into pullbacks and reversals quickly. The indicator draws horizontal lines on the chart at the average daily range extremes and also extensions above those levels which have mathematical probabilities attached to them of pric
49 USD
IVISTscalp5
Vadym Zhukovskyi
5 (1)
We present you the iVISTscalp5 indicator, which is not only unique, but also effective in the analysis of trading operations. This indicator is based on time data and is the result of many years of experience and deep analysis of financial markets. The iVISTscalp5 indicator is an excellent assistant for manual trading. Convenience, simplicity and visualization. All the most difficult is hidden inside. We have simplified the settings and use of the iVISTscalp5 indicator as much as possible. The i
500 USD
The ADR Alert Dashboard shows you at a glance where price is currently trading in relation to it's normal average daily range. You will get instant alerts via pop-up, email or push when price exceeds it's average range and levels above it of your choosing so you can jump into pullbacks and reversals quickly. The dash is designed to be placed on a blank chart and just sit in the background and alert you when levels are hit so you do not need to sit and watch it or even look at all! MT4 VERSION AV
49 USD
The RSI / TDI alert dashboard allows you to monitor RSIs at once (selectable by you) on every major pair you trade. You can use it in two ways: 1.   Select multiple time frames and the dash will show you when there are multiple time frames extended beyond normal trading conditions. A great indicator that price has pushed hard recently as it has achieved an overbought or oversold level across multiple time frames so a pullback or reversal is due soon. 2.   Use one time frame (your favourite to tr
49 USD
Trend Scanner mt5 GS
Vasiliy Strukov
5 (14)
Trend Scanner mt5 scans market trends from Multi-Symbols and Multi-Time frames and displays it on a movable panel on the chart. It uses  Gold stuff indicator   for analysis .The trader can select multiple pairs of his choice for display.   Trend Scanner is a great tool to see the direction of the trend and can be used for manual trading or EA trading by allowing only buy or sell orders according to the trend. Real-time results can be viewed  here . Contact me immediately after the purchase to g
30 USD
Forex Master Pattern
Alberto Gauer Borrego
4.89 (9)
The Forex Master Pattern  is an alternative form of technical analysis that provides a framework which will help you to find and follow the hidden price pattern that reveals the true intentions of financial markets. This algorithm here does a good job detecting the Phase 1 of the Forex Master Pattern cycle, which is the contraction point (or Value).  On Phase 2 we get higher timeframe activation (also called Expansion), which is where price oscillates above and below the average price defined
49 USD
The EMA Cloud
Minh Nguyen Nam
The idea of this trading system from the EMA with a Mediante price from the EMA indicators is based exactly 100% from Ripster47 trading system, me is just the person to create it on the MT5 platform, but with alerts for your own buy/sell settings.  Hereby I make a copy from Ripster47 explanation for using that system: " EMA  Cloud By Ripster EMA  Cloud System is a Trading System Invented by Ripster where areas are shaded between two desired EMAs. The concept implies the  EMA  cloud area
89 USD
More from author
PCFLE Histogram
FLEK TRADING s.r.o.
PCFLE Histogram (Price Change From the Last Extreme) - plots the percentage movement from the last extreme. Can be used for graphical representation of percentage movement from last lowest low to current high / from last highest high to current low. Input parametters: InpDigits - the number of decimal places displayed on the y-axis You can set colors and horizontal levels in the indicator properties. Examples of how to trade with the indicator can be found in screenshots.
30 USD
Filter:
[Deleted] 2019.01.14 07:12 
 

User didn't leave any comment to the rating

Gennadiy Voltornist
11922
Gennadiy Voltornist 2018.01.07 19:26 
 

User didn't leave any comment to the rating

Daniel Andrejczuk
5595
Daniel Andrejczuk 2017.11.09 14:09 
 

User didn't leave any comment to the rating

Nork
6195
Nork 2016.04.11 03:22 
 

User didn't leave any comment to the rating

Rodrigo da Silva Boa
7137
Rodrigo da Silva Boa 2016.01.09 13:22 
 

User didn't leave any comment to the rating

Reply to review
Version 1.1 2021.11.17
Recompile application in the latest platform release build.