Something Interesting - page 31
You are missing trading opportunities:
- Free trading apps
- Over 8,000 signals for copying
- Economic news for exploring financial markets
Registration
Log in
You agree to website policy and terms of use
If you do not have an account, please register
Forum on trading, automated trading systems and testing trading strategies
Indicators: DeMarker (DeM)
Sergey Golubev, 2013.09.20 13:17
DeMarker Indicator
The DeMarker indicator named after Thomas DeMark is a momentum oscillator very similar in nature to the Relative Strength Index (RSI) developed by Welles Wilder. By comparing inter-period price maxima and minima the DeMarker indicator attempts to gather information about price movements to help determine the underlying trend strength and identify over-bought/sold trade conditions. One of the main benefits of the DeMarker indicator like the RSI is that they are less prone to distortions seen in indicators such as the Rate of Change (ROC), which are introduced by erratic price movements at the start of the analysis window which can cause sudden shifts in the momentum line even when the current price is little changed.
The Default time span for the calculation of the DeMarker indicator is 14 periods. The overbought and oversold lines are typically drawn at 0.7 and 0.3, respectively. Longer time spans in the calculation will result in shallower swings in the oscillator and vice versa, accordingly traders may wish to construct narrower overbought and oversold lines for longer time periods. DeMarkers based on short time spans experience greater volatility and are more suitable for indicating overbought and oversold conditions, whereas longer time spans with more stable trajectories are better suited for constructing trend-lines and analyzing price patterns.
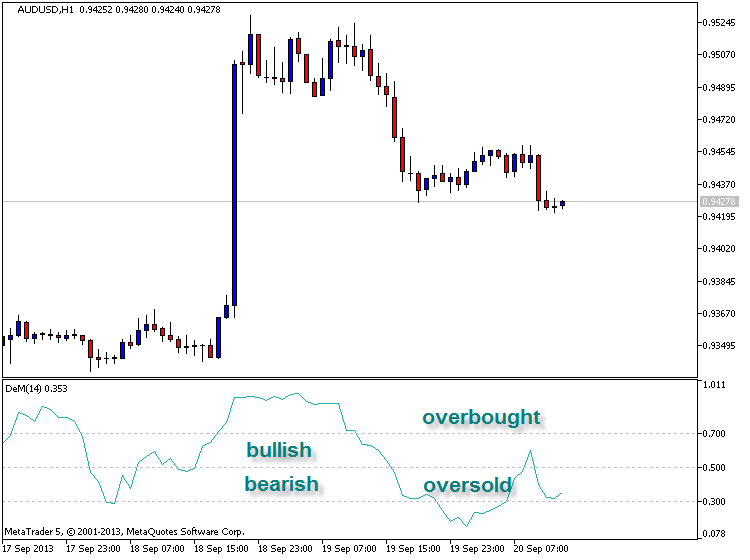
Trade Signals-Ranging MarketsTraders should look to go long when the DeMarker falls below 0.3 and rises back above it or where there is a bullish divergence with price where the first trough is below 0.3. Traders should look to go short when the DeMarker rises above 0.7 and falls back below it or where there is a bearish divergence with price where the first peak is above 0.70. Failure swings (see RSI for example of a failure swing) strengthen other signals.
Trade Signals- Trending MarketsTraders should look to go long during an up-trend, when the DeMarker falls below 0.4 and rises back above it and go short in a down trend when the DeMarker rises above 0.6 and falls back below it. Traders may wish to take profit on divergences or exit using a trend indicator. Traders should avoid selling/buying at overbought/oversold levels in strongly trending markets as subsequent periods of sideways trading can return the oscillator to more normal levels without any material favourable movement in the direction of the trade.
There are 3 very famous systems created by the famous guys (for MT4 sorry).
1. Dolly system (the link to the post with some threads with few versions + EA)
2. CatFx50 trading system created by Nina (the link to the post with some threads)
3. ISAKAS ashi by Kuskus Osentogg Trading System created by Zeman:
3.1. ISAKAS ashi by Kuskus Osentogg - the main thread
3.2. Isakas Ashi KusKus I - Isakas Kuskus EA: Expert Advisor (EA) based on the Isakas Ashi strategy written by Kuskus Osentogg @ Zeman - the thread with the EA
Some good indicators found for Metatrader 5:
And the thread with many indicators: Correlation indicators thread
All John Ehlers
1. All John Ehlers Indicators... - the thread
1.1. LowPassFilter indicator - the post
1.2. Non-Linear Kalman Filter indicator - the post
1.3. BandPassIndicator indicator - the post
1.4. KalmanBands indicator - the post
1.5. Gaussian Filter - indicator for MetaTrader 5
1.6. Adaptive Laguerre filter trend for MetaTrader 5
1.7. Adaptive Laguerre Filter indicator for MetaTrader 5
1.8. Adaptive Laguerre filter 2 for MetaTrader 5
1.9. Adaptive Laguerre indicator for MetaTrader 5
1.10. Laguerre indicator for Metatrader 5
2. Elder's Market Thermometer duscussion thread
3. Elders market thermometer - from "Come in my trading room" - a real classic: the thread
Just to remind about interesting indicator: FivePattern - indicator for MetaTrader 5
This is the indicator to show М & W Wave Patterns by Merrill and support/resistance levels.
===============
About Merill Patterns:
This is Merrill's patterns for downtrend:
Merrill's patterns for uptrend:
===============
And this is some other patterns:
Interesting thread was started by one of the coder: Piano - All timeframes, three bars
I had an idea - to show how at the last three bars the direction changed. And at the same time for all 21 timeframes. That is to show on the screen what bar - bull or bear.
Forum on trading, automated trading systems and testing trading strategies
label volume for VSA
Sergey Golubev, 2017.04.19 21:47
If VSA is the Volume Spared Analysis so there are the following tools in CodeBase: